2012 Review of Spectroscopic Instrumentation at Pittcon
As usual, there was concern at the 63rd Pittsburgh Conference on Analytical Chemistry and Applied Spectroscopy (Pittcon 2012) about how well the conference is doing. Although this reviewer heard casual comments about how the show appeared smaller and the aisles less crowded, other comments by some exhibitors indicated good attendance at their booths, and "quality" leads from those attendees who stopped in.
Despite these comments, we can only go by the figures. The total cumulative attendance was 15,754 as compared to the final 2011 attendance of 17,199. A breakdown of the attendance by attendee type and a comparison with previous Pittcons can be found at: http://www.pittcon.org/exhibitors/attendstats.php.
Here are some other attendance figures from information given on the Pittcon website and from e-mails they distributed:
- Exhibiting companies: 948
- Booths: 1854
- Exhibiting companies from outside the US: 191
- Number of countries: 28
- First-time exhibitors: 119
- Companies participating at sponsorship level: 6
- Individual presentations in the technical program (including posters): 2000
- Invited speakers: >100
- Short courses: 95
- Short course registrants: 1400
Some of the large, previously stalwart, instrument companies were notable by their absence or by their presence in only a nominal way. Countering that effect were many new small exhibitor companies (completely new or just new to Pittcon — see above). By most accounts, these smaller companies are the source of most innovation in any technology, so the attendance decrease is not the whole story. I try to find all of those new companies to include here, because nurturing new small companies is an important function of such things as this review (and of Pittcon itself, to be sure).
Over the years, long-time attendees note the arrival and departures of trends (or "fashions") in the instruments and booths seen. I remember when going to my first Pittcon (I won't say when that was, but you can guess from my comments) that I was impressed by the fact that just about every booth contained an oscilloscope, for displaying some results or other; that was the fashion at the time. Now, I understand that the fashion is based on the marketing consideration of being perceived as the company keeping up with the latest technology. Those oscilloscopes eventually faded from view, to be replaced by calculators (computers as such were still in the future); and then still more recently, of course, computers and other electronic displays became ubiquitous.
Early on, the acceptance of these new devices increased slowly. Their capabilities were limited; the personal computer (PC) (which at that time meant the units from Commodore, Amiga, Apple, and a few other small manufacturers) were not exactly impressive, and their cost was relatively high. Furthermore, they were not entirely trusted. Until the advent of the IBM PC, what that average person (or scientist) in the street knew about computers was largely based on dramatic (and dramatized) news stories about how some (mainframe) computer or other used in a payroll application would reward some lucky person with a multimillion dollar paycheck when figuring out their deductions and net pay. This did not inspire a whole lot of confidence in those "newfangled devices"!
Eventually, of course, the IBM PC did come on the scene. That, plus the appearance of the Macintosh computer (from Apple), gave small computers credibility among the business and academic markets. This, aided by their greater capabilities and the development of better software, led to their more widespread acceptance as auxiliaries to scientific instruments (with corresponding prominence at Pittcon), and their current position in the industry. However, those are also fading to some extent now, because the controlling computers are being incorporated into the electronics of the instruments themselves, rather than being separate devices.
Despite this trend, there remains the need for users to interact with and control the instrument. I think that at Pittcon 2012 we saw the start of the next new trend (or fashion) in instrumentation in this regard: the incipient use of cell phones and tablet computers as the controlling devices for the instrument. Because of the practical effect that the control link is wireless, these seem likely to become more prominent and widespread. As such, everything will be controlled by the latest new paradigm of computerdom: "There's an app for that!"
An ongoing development for the last several years, of course, has been the decreasing size of instrumentation. This trend is continuing, with technologies that previously required multiton devices now able to be held in the palm of your hand. We will be pointing out some of these.
Another innovative development, along with the decrease in size, has been the decrease in power requirements. Aided by the use of semiconductor sources (such as light-emitting diodes [LED] and infrared-emitting diodes [IRED]) to replace incandescent lamps, the low-power electronic technologies and improved batteries developed for cell phones have enabled some technologies to become more independent of mains power. This trend also has been taken one step further in instruments that dispense with the battery and derive all their power from the USB connection to the control computer.
This year, we are incorporating some innovations in our annual review. One new feature is the splitting of the review between the hard-copy version and a new on-line version that will be accessible at www.spectroscopyonline.com/Pittcon2012. The hard-copy version is a shorter and more condensed version, while the on-line version is more extensive and detailed. The formatting of both versions has been updated.
As we have done in the past, our listings indicate whether a given instrument is for the laboratory (that is, a fixed location), for process applications, or portable (handheld) deployable. For several instruments, we will also include their size or weight, especially for instruments that are portable or transportable. This provides readers with a precise idea of just how portable a given unit is (just a few are labeled as transportable, meaning they can be easily moved even though it may not be possible to carry them by hand).
As noted, the trend toward decreasing instrument size and the increasing presence of smaller instruments is still continuing. The need for such instruments seems unlikely to abate, and "robot transportable" seems to be coming in vogue.
There was only one nuclear magnetic resonance (NMR) manufacturer represented. Thus, NMR was included in the new category "Spectroscopy (other)." This is the second year when electron spin resonance (ESR) was seen.
Once again, I organized this review according to the wavelength region and type of spectroscopy involved. I tried to arrange it so readers could easily compare instruments from different manufacturers, even though this structure may sometimes lump together instruments of the "good enough is OK" type with ultraprecise laboratory designs. As I mentioned earlier, there is a new category: "Spectroscopy (other)." This is a catchall category for instruments that only have one manufacturer representing them, so that they did not warrant a separate listing of their own. The instruments in this category are circular dichroism, NMR, ion mobility, and a fluorometer with a supercontinuum source.
The categories we used in this review to classify the instruments (in alphabetical order) are as follows:
Accessories
Atomic spectroscopy
Components
Imaging
Mass spectrometry
Mid-IR (FT-IR)
NIR
Raman
Software
Spectroscopy (other)
Terahertz
UV–visible
It is inevitable that some categories include products from companies that might arguably also be classified under one of the other categories. These categories include accessories, components, imaging, and software. For example, a Raman imaging spectrometer might be found under the Raman category or the Imaging category. I tried to be consistent, but can't guarantee perfection in this regard. Thus, if a product is not found in an expected category, others should be checked. Another holdover is the index (Table I), which, if you know the name of a company you want to find, will tell you under what heading to find it. Of course, some companies with products based on multiple technologies will have multiple entries, but then presumably you know which type of instrument you're looking for.

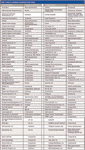

Table I: Index of companies mentioned in this article
Another new innovation in the presentation is the formatting of the information in the print-issue review as a short paragraph describing any particularly interesting instruments followed by a table that summarizes the features of the instruments listed. The on-line version contains a series of appendixes that include additional detailed information, corresponding more closely to previous reviews.
We also endeavored to give a synopsis of salient features for each product, or at least as much as could be included in limited space. We follow a "features-benefit" format that describes not only the key features of a given instrument but also the meaningfulness of those features to the user.
ACCESSORIES
The accessories category (Table II) includes a wide range of products, in terms of wavelength coverage (X-rays to terahertz and microwaves), size and weight (from minifiber couplers and Hitachi's microvolume accessory to large sample-handling accessories), power requirements (from USB-powered devices to [almost] 2 kW magnetrons). For example, Stellarnet provides a USB-powered digital microscope.

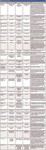

Table II: Accessory products
The past year was a good year for accessories to be noticed. Some products in this category stand out. One is the Protea LAESI DP-1000, which garnered the bronze Editor's Award. Another Editor's Award honoree is Block Engineering's Quantum Cascade laser which, incorporated into their new IR spectrometer, won honorable mention in this competition.
Several products are special high-temperature or high-pressure versions of otherwise standard products, and some are specially designed and intended to allow the user to perform measurements under extreme conditions.
ATOMIC SPECTROSCOPY
Progress is sometimes incremental. All the companies listed in the atomic apectroscopy category (Table III) have improved capabilities, such as higher-speed analysis or better sensitivity. Better analytical capabilities are sometimes achieved by combining two technologies in a single instrument, as PANalytical and PerkinElmer did. Others, such as Teledyne Leeman, improved ease-of-use and user-interface issues.

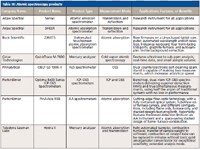

Table III: Atomic spectroscopy products
Arjae Spectral has an interesting additional feature: they manipulate the optical beam to produce a 15× greater light throughput than expected, with a corresponding increase in signal-to-noise ratio. Of course, you can't tell from marketing materials what their trick is, but my guess is that it's akin to the use of nonfocusing optics, such as those used in solar concentrators to increase their throughput and efficiency.
The above-named companies are all exhibiting general-purpose spectrometers. CETAC, on the other hand, provides an instrument designed and configured for one specialized type of measurement, in this case mercury vapor measurement, for which the most important property is sensitivity.
COMPONENTS
As a category, components (Table IV) is as varied as accessories. Different products have different characteristics that are applicable to that type of product. "Frames per second" capability, for example, is found only in high-speed imaging devices, such as Andor Technology's high-speed camera. It would be completely inapplicable, for example, to Glass Expansion's sample collection devices, or to Agilent's nebulizer. Those have their own strong points, which pertain to the nature of the component (low carryover for Glass Expansion's valve, and resistance to HF for Agilent's nebulizer). Therefore, these listings should consider each manufacturer's products on their own merits, and no attempt should be made to compare various manufacturers' products that are based on different criteria.

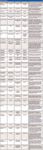

Table IV: Components
So what's the difference between a component and an accessory? In my mind, and more importantly in my usage and classification of products, a component is a device that can be used in the construction of an instrument and thus become an integral part of it; if it's not there then the instrument will not work, or at least it will be severely degraded. An accessory is a device that can optionally be used in conjunction with an instrument and is generally external to it; the instrument will work just fine without it, but the accessory extends the capabilities. Futhermore, an accessory can be removed to return the instrument to its previous performance level, whereas a component generally cannot be removed except by a factory-trained expert.
IMAGING
Imaging (Table V) is the category of products that creates the most difficulties in the choice of classification. Every imaging device has to image something, and indeed every imager uses a technology (for example, IR or NMR) that also is used without imaging. Indeed, NMR imaging (in a medical context) is in such widespread use that the name had to be changed (to magnetic resonance imaging) to avoid scaring the ultimate beneficiaries through the use of the word nuclear. So when looking for a Raman imager, for example, don't forget to look under Raman as well as under imaging. How did I decide where to place a given device? It was purely a matter of my interpretation of the manufacturers' descriptions of their products whether the imaging or the underlying technology was of more importance. It was purely idiosyncratic, because I decided it was hopeless to even try for consistency.


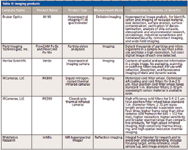
Table V: Imaging products
MASS SPECTROMETRY
This category of instrumentation (Table VI) is probably one of the best examples of the fact that, even within a single category of instrument, different design choices lead to instruments with different characteristics. The variety of different technologies to distinguish ions of different masses contributes to this variety of instruments, not only between companies, but even within a single company. Ionicon, for example, is providing three different mass spectrometers, each oriented toward a different characteristic, one featuring high sensitivity, one featuring portability, and one featuring high mass resolution. On the other hand, 1st Detect is not emphasizing any one characteristic, but is providing a good mix of features at a low price. We're also pleased to note that the Bruker Scion TQ won recognition as the silver winner of the Editor's Choice Awards.

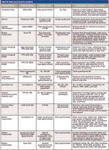

Table VI: Mass spectrometry products
MID-IR (FT-IR)
Block Engineering strikes again! Famous for their historical role in spinning off the first company (Digilab) to provide a commercial Michaelson-interferometer-based FT-IR instrument, it is also the first, as of this year, to provide a commercial mid-IR spectrometer based on the use of a quantum cascade laser as the illumination source. I think Myron Block would be proud, but you can never be too sure what Myron is thinking! For this development, the company was awarded Honorable Mention as the Editor's Choice Award.
Mid-IR spectrometers (Table VII), for which FT-IR is a commonly used synonym, despite the presence of two instruments right here in this review, are based on other technologies. Fourier transform spectroscopy is also used in other spectroscopic fields, but here is where it is most mature. Wavelength scales for all instruments are controlled by laser-fringe-referencing, and the noise characteristics are limited by the detector-noise characteristics of their sensors. Not that all instruments are the same, by any means. Different design decisions on the part of the manufacturer still give a variety of choices for the user to make.

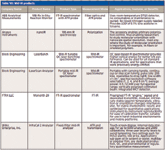

Table VII: Mid-IR products
For example, ABB is promoting ease-of-use by dispensing with the need to deal with a continuing supply of liquid nitrogen. FTRX is doing the same by sealing the optics and thereby removing the need to purge the humidity from the optics and interferometer modules; presumably the sample chamber will still need to be purged, though.
Anasys is specializing in providing a "microspectrometer" capable of measuring spectra of 100 nM samples, and controlling the polarization. Wilks is staying out of that arena entirely, by providing an analyzer based on the use of a set of interference filters.
NIR
NIR reflectance spectrometers (Table VIII) are on the forefront in pursuing small size and low-power operation. Manufacturers providing instruments that draw their power from their USB connection include B&W Tek, Inc. and JDS Uniphase. Bruker Optik provides an instrument that can run on battery power. The entire JDS Uniphase instrument, including source, optics, and detector, can be held in the palm of your hand.

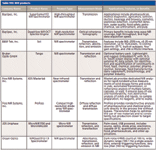

Table VIII: NIR products
Just about every manufacturer provides a unit that is portable, transportable, or handheld, although users needs to decide for themselves exactly what they consider to fall into each category. That's the reason we ask for size and weight information. I started to count how many instruments in all categories were portable, transportable, or handheld, but I lost track; I couldn't count that high without my computer!
RAMAN
The ongoing computer revolution continues to make it's way into the Raman instrument world (Table IX). As described in the introduction, B&W Tek has a tablet computer to interface with its spectrometers. Mustard Tree Instruments has a touch-driven user interface, for the noncognoscenti among us.

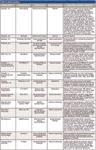

Table IX: Raman products
Miniaturization is seen here in more than one way. BioTools has a portable Raman microscope. As with NIR, just about every manufacturer provides at least one model that is portable, transportable, or handheld, although users need to decide for themselves exactly what they consider to fall into each category, that's the reason we ask manufacturers for the size and weight information.
SOFTWARE
Except for Silk Scientific, whose software is tied to their specific hardware, software (in the sense used here) is all portable, although the meaning is somewhat different than for hardware. When referring to software, portable means that the software can be run on any computer of the correct type. All instrument manufacturers provide software for their own instruments; they have to so that users can take their data, or their results, out from the instrument. Unless it's a USB or other standardized connection, or the instrument is completely self-contained, the hardware and the software used to read data from the instrument are generally proprietary. In this review, therefore, software (Table X) means two things. The first meaning is "third-party software," software written not necessarily by an instrument manufacturer and thus not tied to a particular instrument; such software can perform data processing or other functions to extend the capabilities of the overall system beyond what the manufacturer has included in the instrument itself. Eigenvector and Symbion are premier examples of companies providing program packages. Most of the companies listed here provide software packages of this nature.


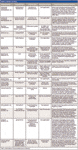
Table X: Software products
The second meaning of software, as used here, covers compilations of spectral data. ACD, for example, provides the Coblentz Society's collection of spectral data. Bio-Rad provides both spectral data compilations and data-processing software.
SPECTROSCOPY (OTHER)
This category (Table XI) contains, as the title implies, a hodgepodge of instruments that didn't quite seem to fit in elsewhere, or, perhaps, were the only examples of their type.

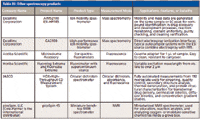

Table XI: Other spectroscopy products
Miniaturization is seen in this category, also. PicoSpin has devised an NMR instrument small enough to be inserted into a glovebox. These things are all relative, of course; it's not that long ago that instruments for optical spectroscopy that size were considered "state of the (miniaturization) art," too. Another item that is shrinking is the sample size; Horiba can measure fluorescence spectra on samples of 1 μL (1 mm3).
TERAHERTZ
Terahertz imaging (Table XII) is becoming a standard product outside the realm of analytical chemistry, with the now widespread use of the technique for monitoring people in airports. Indeed, because both products listed here are imaging devices, I debated whether I should include them in the imaging section. However, as I mentioned elsewhere, my decisions are somewhat idiosyncratic (and therefore unexplainable, even to myself sometimes), but I felt that since there were two devices, they deserved a section of their own (if there has only been one, it would have been placed in the "Spectroscopy (Other)" section).

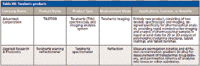

Table XII: Terahertz products
UV–VISIBLE AND X-RAY
Now, here's something of interest that's not related to small size or low-power instrumentation: Avantes (Table XIII) has a changeable slit. With grating instruments, an inherent property of the optical system is that the narrower the slit, the smaller the wavelength range that will pass through it (everything else in the optics being optimized, of course); this gives better spectral resolution. That improvement comes at the cost of energy coming through the slit, since narrower slits keep out more photons than wide slits, thus reducing the signal-to-noise performance of the instrument. Five decades ago this was standard knowledge and instruments were designed to have adjustable-width slits, so that users could set the slit width for a particular sample and measurement conditions of concern. Spectroscopists can trade off one characteristic for the other to optimize results, a time-tested way of running an instrument. For many reasons, such as simplicity of operation (particularly by unskilled operators), reduced manufacturing costs, and finally the advent of Fourier transform methods wherein the slit disappeared entirely, the adjustable slit all but vanished, especially in the smaller spectrometers, where matching the slit to an optical fiber was paramount. So, with Avantes reintroducing the adjustable slit, we come back to giving spectroscopists more control over the instrument than has been the case for a long time. Welcome back, slit!

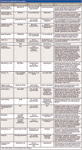

Table XIII: UV-visible and X-ray products
Of course, that's not the only way to improve signal-to-noise ratios. Horiba is doing that with high-speed optical design. In the context of optics, high-speed means how large a solid angle the light impinges on the detector, with higher "speed" generally giving more signal, everything else being the same.
Shimadzu isn't necessarily going for the best signal-to-noise ratio, but is improving results by minimizing stray light with a double monochromator, another time-tested, albeit expensive, approach. Tec5USA, on the other hand, is going for speed, rather than increasing signal-to-noise ratio. Good for getting spectra of dynamic processes.
APPENDIXES AVAILABLE ONLINE
Additional product details appear online in the appendixes, at:
Appendix I: Accessories www.spectroscopyonline.com/Accessories2012
Appendix II: Atomic Spectroscopy www.spectroscopyonline.com/AtomicSpectroscopy2012
Appendix III: Components www.spectroscopyonline.com/Components2012
Appendix IV: Imaging www.spectroscopyonline.com/Imaging2012
Appendix V: Mass spectrometry www.spectroscopyonline.com/MassSpectrometry2012
Appendix VI: Mid-IR (FT-IR) www.spectroscopyonline.com/Mid-IR2012
Appendix VII: NIR www.spectroscopyonline.com/NIR2012
Appendix VIII: Raman www.spectroscopyonline.com/Raman2012
Appendix IX: Software www.spectroscopyonline.com/Software2012
Appendix X: Spectroscopy (other) www.spectroscopyonline.com/Spectroscopy(other)2012
Appendix XI: Terahertz www.spectroscopyonline.com/Terahertz2012
Appendix XII: UV–visible www.spectroscopyonline.com/UV-visX-ray2012
Howard Mark serves on the Editorial Advisory Board of Spectroscopy and runs a consulting service, Mark Electronics (Suffern, New York). He can be reached at hlmark@nearinfrared.com


The Single-Bullet Theory Comes to New York – But Was it a Direct Hit?
November 22nd 2023Pete Diaczuk of John Jay College of Criminal Justice gave a recollection at EAS 2023 of a case he worked on in Manhattan involving a victim fatally shot, incomplete ballistic evidence, and the wrong gun recovered at the scene.

