2018 Salary Survey: Back to the Baseline
Our annual spectroscopy salary and employment survey shows encouraging increases, but in many areas, spectroscopists have simply gained back ground that had been lost in recent years.
The latest Spectroscopy salary and employment survey shows encouraging increases, but in many areas, spectroscopists have simply gained back ground that had been lost in recent years.
The results from this year represent two new records for the Spectroscopy salary survey. First, the average salary broke the $90,000 mark for the first time. Second, the average salary showed the single largest change we have ever recorded. At 7.6%, this year's rise in average salary represents an increase of $6411 compared to 2017 (Table I). Breaking the $90,000 barrier for the first time also represents a return to salaries not seen since 2013–2014. Is this a new horizon of a positive trend or a false dawn, a one-time blip? Time will tell.

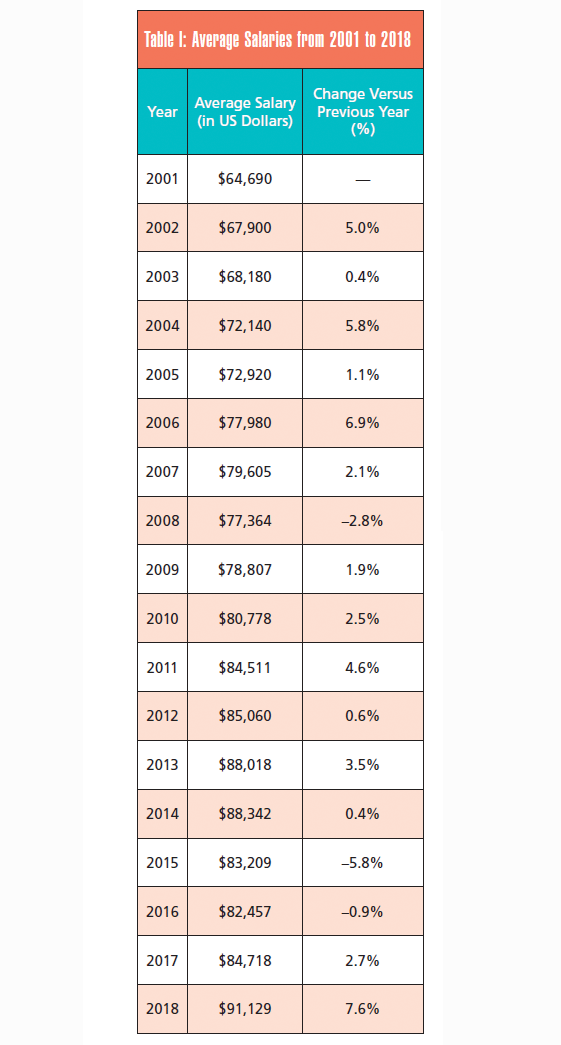
Breaking down the data reveals a more complicated picture, with gains and stagnation in all the usual places, with a few surprise decreases. As shown in Table II, the average male salary has leapt up by $9572, breaking the $100,000 barrier for the first time and eclipsing the previous highs set in 2013–14. The average female wage has seen an increase by a slightly more modest $6117, to $79,770. The already prominent gender pay gap (approximately 20%) did not get any smaller.

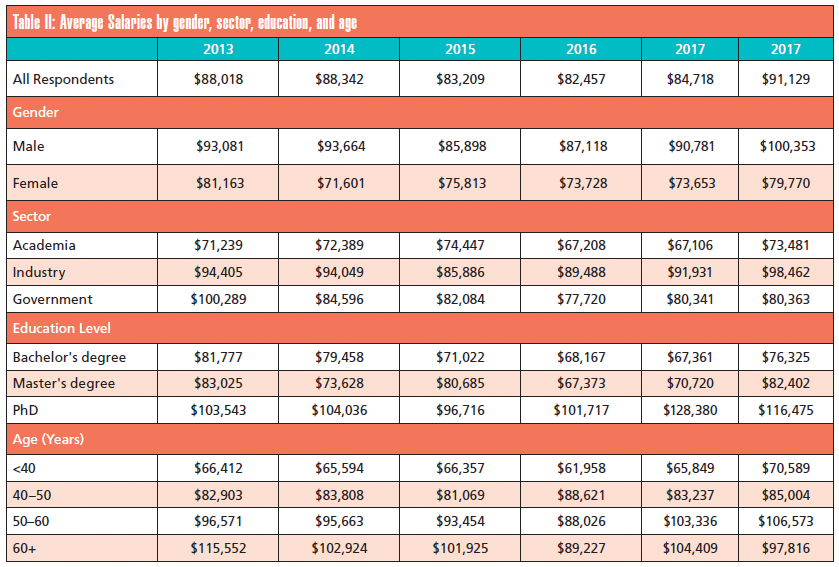

Moving on to sector data, average salaries increased in academia by $6375 and returned to the $70,000+ bracket following two years at $67,000. The largest gain was found in the industrial sector, with an increase of $6531, eclipsing the previous highs from 2013–14 but falling short of breaking the $100,000 mark. Government salaries maintained parity with last year's result at $80,363.
Breaking the average salaries down by education level reveals a startling reduction of 9.3% for those who have completed a PhD. However, the 2018 average for this group is still considerably higher than all other previous years, suggesting that individuals educated to that level have seen reasonably good wage growth so far this decade. As for those educated to the bachelor's and master's levels, the results are also positive. Increases in both categories come to 13.3% and 16.5%, respectively, compared to last year. The caveat to these uplifting results is that when compared to results from just a few years earlier, the gains don't amount to much; both results are lower than those seen in 2013. It is probable that this yearly variation in average salaries derives from the wide pay spectrum available for this group, with some earning salaries that rival those educated to a PhD level while others languish far behind.
In terms of the next factor, age, the logic that experience demands higher wages continues, except for in the 60+ bracket where the last few years have seen historically unusual drops in average salary. This year's decrease is not as dramatic as that seen in 2016, when average salaries for those over 60 dropped below the $90,000 mark, but 2018 does show a drop below the $100,000 mark and even below the average salaries reported by respondents in the 50–60 age bracket. The reasons for this aren't clear. As for the younger age brackets, those below 40 recorded a 7.9% increase from last year and those in the 50–60 bracket experienced a small increase of 2.1%.


Working Hard
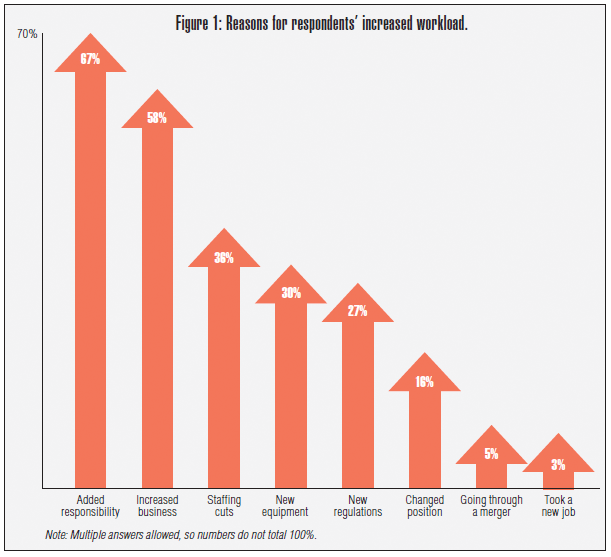
There is an eerie consistency with which respondents to this survey cite their increasing workloads year after year. Once again, those who say their workloads have increased account for 63.5% of respondents, about the same as in 2017, 2016, and 2015. And on it goes. Only 4.2% of respondents said their workload had decreased and the remaining 32.3% indicated that their workloads had remained the same. As to the reasons for this reported increase, we expanded the options in this question this year to gain a more detailed explanation. For the first time, increased business is not the most cited reason (Figure 1), being trumped by added responsibility, which 67% of respondents selected. Staffing cuts, new equipment, and new regulations all feature prominently, at 36%, 30%, and 27% respectively. Other reasons for increased workloads included "changed position within the organization," which 16% of respondents selected, and the least frequently selected reasons included "going through a merger" at 5% and "took a new job" at 3%.

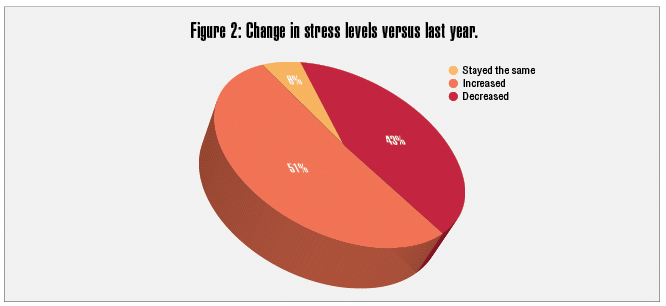

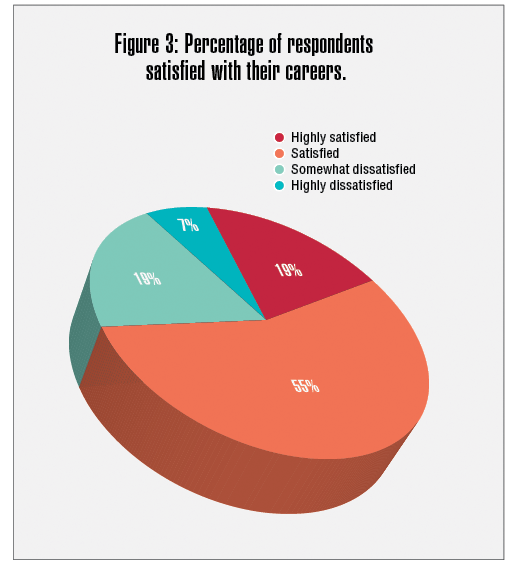
Stress continues to be an issue (Figure 2). Just over half of respondents indicated an increase in stress compared to last year while only 6% indicated a reduction in their work-related stress (Figure 2). This increased stress appears to have had a knock-on effect on job satisfaction levels (Figure 3), with a prominent reduction in those highly satisfied with their work, now at only 19%, a 7% drop compared to last year. But it's not all doom and gloom; this reduction doesn't translate to a massive increase in those who are "somewhat dissatisfied" or "highly dissatisfied" with their work. Perhaps "a little bit peeved" would best describe it, with 55% indicating that they are just "satisfied" with their work.


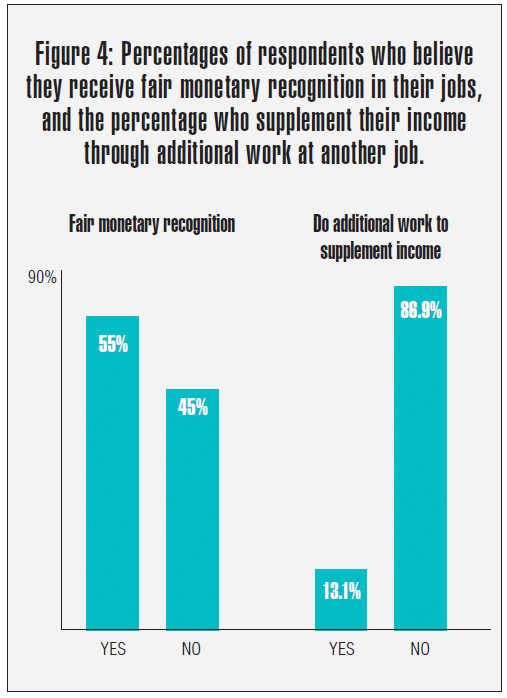
A major factor in job satisfaction is feeling that the work you do receives fair monetary recognition. In the previous year's survey, we found that well over half of respondents (65%) believed their work and time generated a fair wage; however, in this year's survey we recorded a 10% drop in that figure, to only 55%. This could go some way to explaining the drop in job satisfaction. Our findings also indicated that 13% of respondents take on extra work to beef up their income, which is consistent with last year's result (14%). Some of the roles taken on included lecturing roles, teaching, writing, tutoring, and consulting, as well as restaurant work and secret shopping.


Home Truths
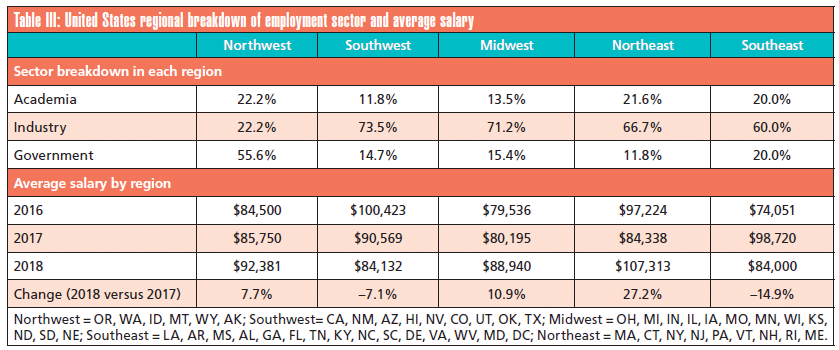
Through birth, choice, or sheer happenstance, where you live has a profound impact on your career prospects and, in turn, your salary, as can be seen in Table III. Northeastern states have undergone a Lazarus-like resurrection following three successive years of decline. A 27.2% increase rockets the Northeast back to the top, with an average reported wage of $107,313, which is significantly higher than any other region. The second highest region, the Northwest, shows a 7.7% increase from 2017, bringing the average salary to $92,381. The Midwest lives up to its name, taking the middle position with an average salary of $88,940, a 10.9% increase from last year. Languishing at the bottom are the two southern regions, but they come from drastically different starting points. The Southwest suffered a second successive reduction to $84,132, down from $100,423 in 2016. The Southeast, on the other hand, has taken a 14.9% hit, down to $84,000; however, this figure is still considerably higher than results obtained in 2015 ($77,381) and 2016 ($74,051).


Gender Gap Continues
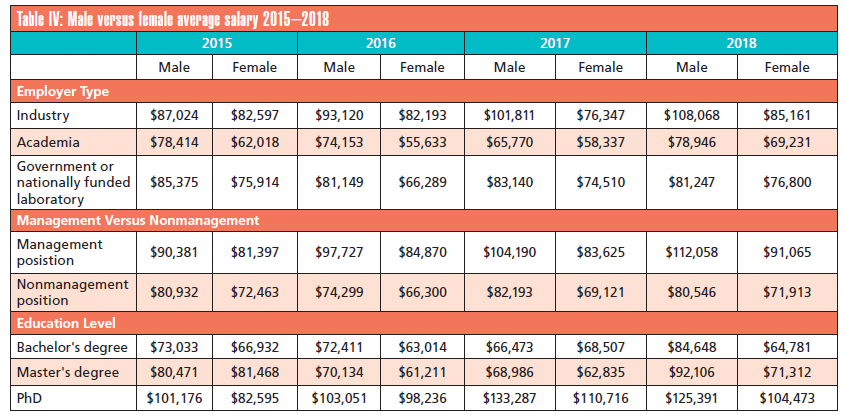
When we look at the ongoing gender pay gap (Table IV), the minor glitch in the matrix last year, which showed women with bachelor's degrees earning more on average than men, turned out to be just that, a glitch. This year sees a return to the status quo, with men's salaries being higher on average across the board, regardless of education level, management position, or employer type. Perhaps the core reasons for this disparity are outside the scope of a simple salary survey, but the sheer consistency with which female salaries are, on average, lower can't be a coincidence. There is some burden unshared, some bias unchecked, some accumulation of factors causing this difference, and if we are to reach our egalitarian potential, more needs to be done.


Ascendant Moment
Continuing on from last year's questions about discrimination, this year our survey focused on sexual harassment in the workplace, following the slew of high profile cases of abuse coming to light in recent months. Respondents were asked a series of questions with the aim of gaining an impartial assessment of the current landscape with regard to the percentage who have experienced harassment, the ease of reporting incidents, and the current state of company and institutional policy on the matter.


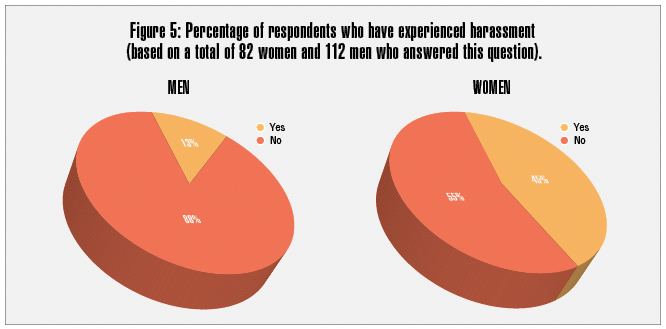


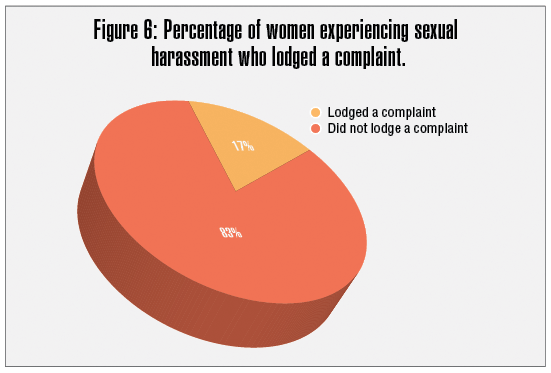
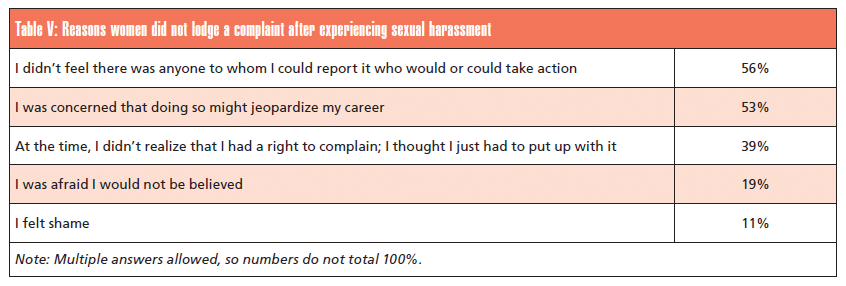
As shown in Figure 5, 45% of women and 13% of men indicated they have experienced some form of harassment in the workplace. Figure 6 shows, however, that only 17% of women suffering harassment lodged a complaint. Table V highlights the reasons for this inaction on the part of women experiencing harassment, with similar results obtained from male respondents. The top reasons, across both genders, for not lodging a complaint were career concerns and feeling there was no one to report it to who would or could take action. These answers fall in line with what has been seen in other workplaces, where most victims of harassment did not report it until recently, when the floodgates opened and more victims felt they would now be believed.


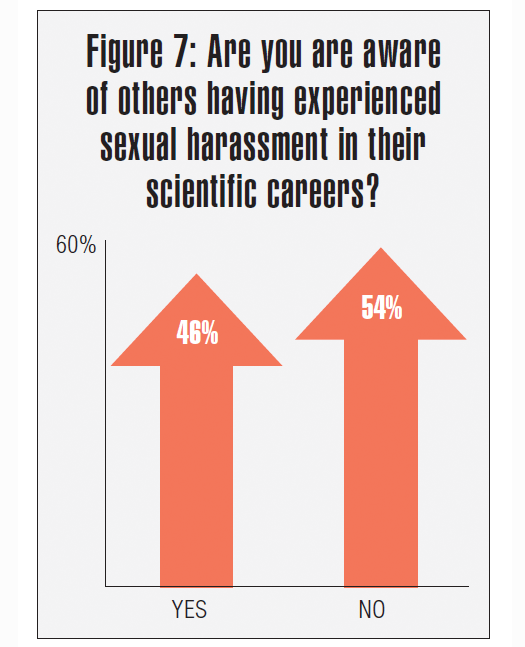
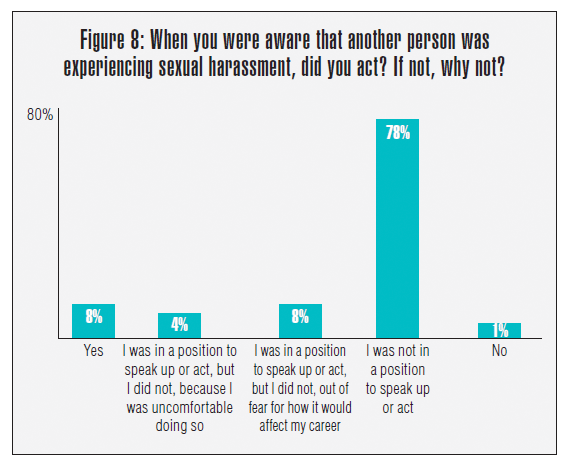
For those aware of others having experienced harassment in their scientific careers (Figure 7), the vast majority (78%) indicated they believed they were not in position to speak up or act (Figure 8). This could be a sign that these people knew that the organizational culture would not protect the harassed. It is also something for companies and institutions to consider when attempting to improve reporting systems.


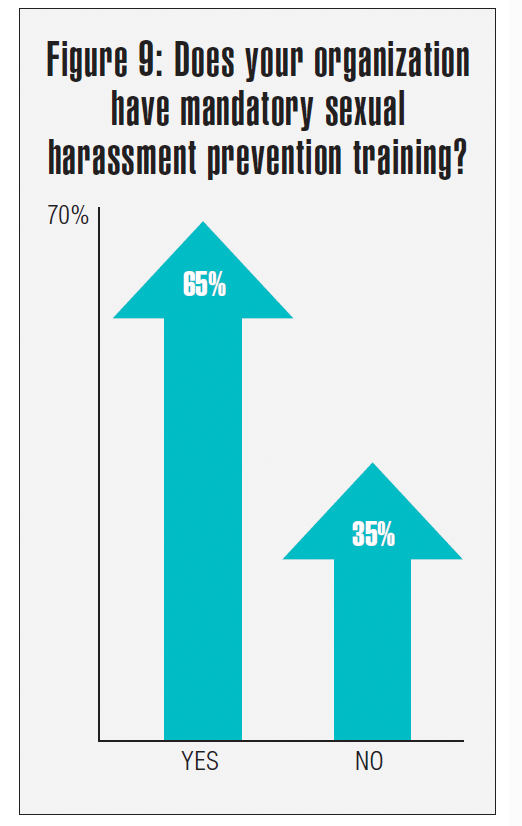
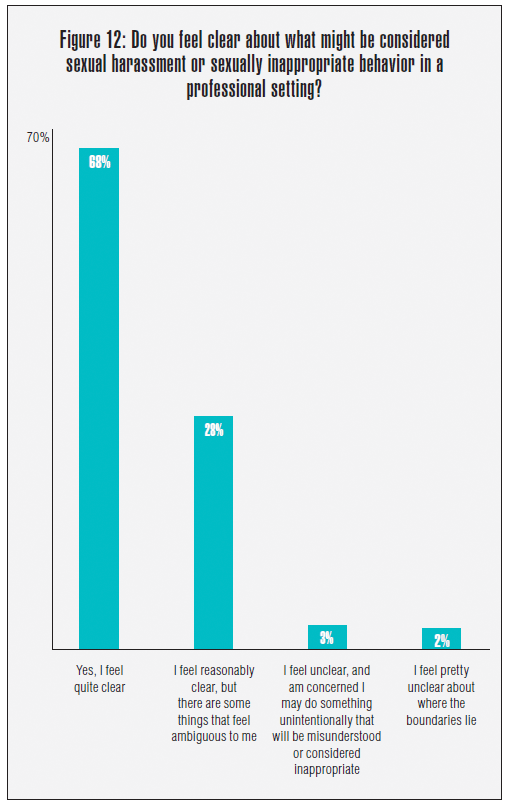
Finally, delving into the current state of organizations' response to this problem, our survey found that only 65% carry out mandatory sexual harassment prevention training (Figure 9). In spite of this, 68% of respondents feel clear about what might be considered sexual harassment or sexually inappropriate behavior in a professional setting (Figure 12). Of the rest, 28% feel reasonably clear, but some situations feel ambiguous to them; another 2% feel "pretty unclear" of where the boundaries lie; and a further 3% feel totally unclear. That leaves a fairly large chunk of the working population with questions that require frank discussion. It is perhaps no wonder that these uncertainties and tensions have erupted into the public forum when even highly educated individuals, like our readers, aren't clear on the boundaries.


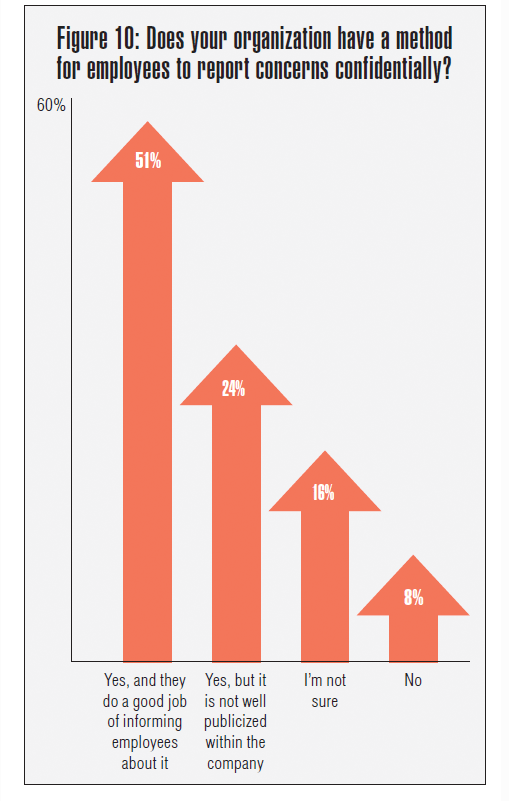

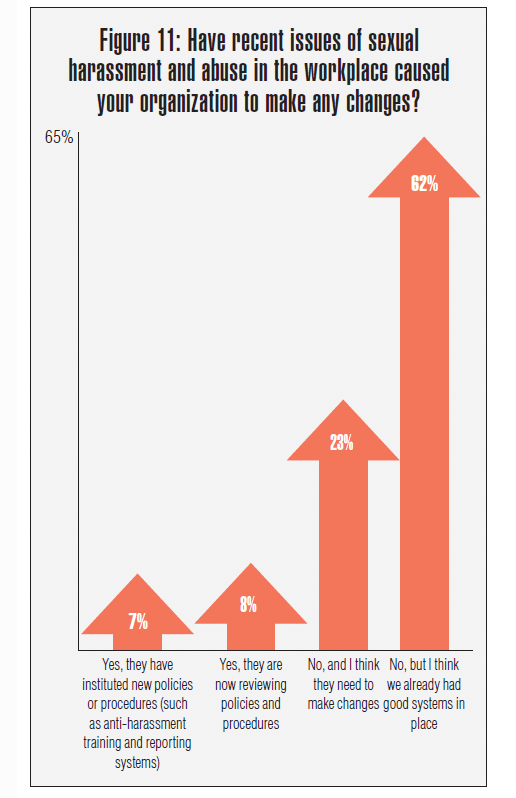
Furthermore, while there is a broadening awareness that harassment is a problem, organizations still have some way to go with regard to putting in place methods of reporting and dealing with incidents. Only 51% of our respondents believe their organizations have methods to report concerns confidentially that are well known to employees (Figure 10). A further 24% indicated the methods were there but the knowledge of their existence was not, while 16% weren't sure and 8% said their organizations had no established method for reporting incidents. Finally, we asked whether organizations were making inroads toward change (Figure 11). While 62% indicated that good systems are in place to prevent and report harassment, 23% believe change is needed but their organization isn't currently doing anything. Another 7% said their organizations have instituted new policies and procedures, and 8% said their organizations are currently reviewing policies and procedures.


Conclusions
This year cemented the gains seen in 2016–2017, with wages finally looking like they will significantly eclipse the salaries in the earliest parts of the decade. The hope is that future salary surveys will find the average salary regularly breaking into the $90,000 bracket and finally put to bed the demons of the 2007–2008 financial crisis that sent shockwaves through the world economy.

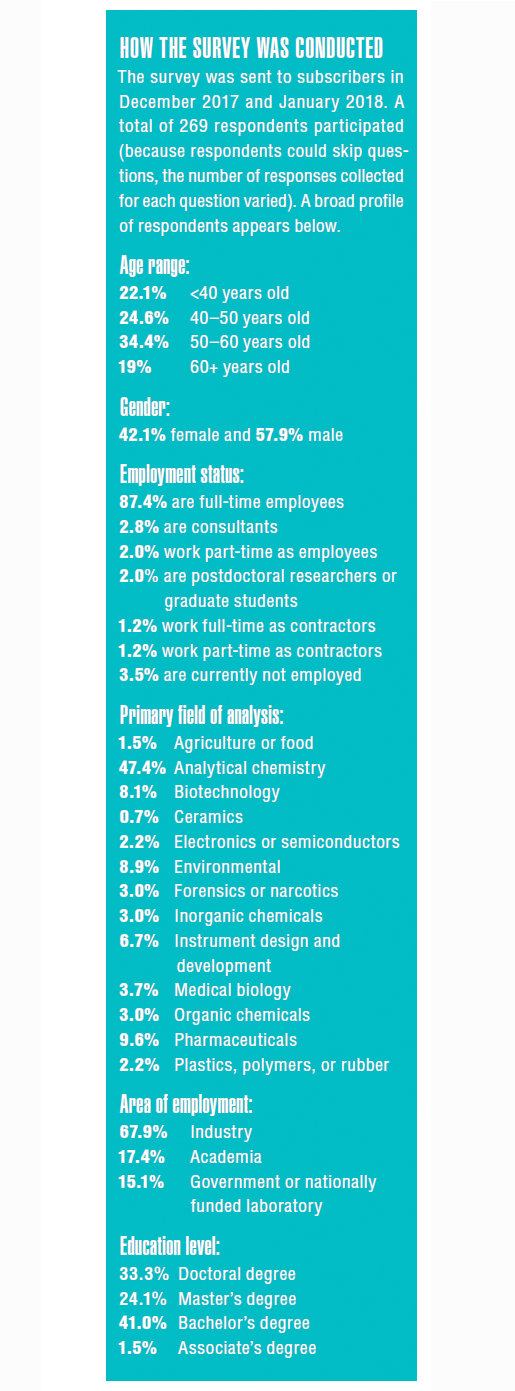

HOW THE SURVEY WAS CONDUCTED
This year, workloads increased, stress levels rose, and job satisfaction dropped, while the Northeastern states reclaimed their throne atop the US region salary table. Once again, our results showed that young spectroscopists planning for the future should consider continuing their education and completing a PhD to maximize their earning potential. But for many, a bachelor's degree and a lot of hard work can still land one not far from the top end of the earnings spectrum.
The harassment landscape looks bleak at the moment, with many organizations needing to do more and large swaths of uncertainty remaining for many. Some frank discussions are likely to come in the next 12 months, if our results are anything to go by.
Lewis Botcherby is an associate editor for LCGC Europe, a sister publication to Spectroscopy.
Direct correspondence to: lewis.botcherby@ubm.com


Getting accurate IR spectra on monolayer of molecules
April 18th 2024Creating uniform and repeatable monolayers is incredibly important for both scientific pursuits as well as the manufacturing of products in semiconductor, biotechnology, and. other industries. However, measuring monolayers and functionalized surfaces directly is. difficult, and many rely on a variety of characterization techniques that when used together can provide some degree of confidence. By combining non-contact atomic force microscopy (AFM) and IR spectroscopy, IR PiFM provides sensitive and accurate analysis of sub-monolayer of molecules without the concern of tip-sample cross contamination. Dr. Sung Park, Molecular Vista, joined Spectroscopy to provide insights on how IR PiFM can acquire IR signature of monolayer films due to its unique implementation.

Deep Level Transient Spectroscopy Reveals Influence of Defects on 2D Semiconductor Devices
April 25th 2024A recent study used deep level transient spectroscopy to investigate the electrical response of defect filling and emission in monolayer metal-organic chemical vapor deposition (MOCVD)-grown materials deposited on complementary metal-oxide-semiconductor (CMOS)-compatible substrates.


Single Cell and Microplastic Analysis by ICP-MS with Automated Micro-Flow Sample Introduction
April 25th 2024Single cell ICP-MS (scICP-MS) is increasingly seen as a powerful and fast tool for the measurement of elements in individual cells, mainly due to the high sensitivity and selectivity of ICP-MS. Analysis is performed in the same way as single nanoparticle (spICP-MS) analysis, which has become a well-established technique for the analysis of nanoparticles and particles.
Hot News on Agilent LDIR, New Developments, and Future Perspective
April 25th 2024Watch this video featuring Darren Robey and Dr. Wesam Alwan from Agilent Technologies to gain insights into the future trends shaping microplastics research and the challenges of their characterization. Discover the essential components necessary for accurate microplastics analysis and learn how the Agilent 8700 LDIR system addresses these challenges. Offering rapid and precise analysis capabilities, along with easy sample preparation methods that minimize contamination, the Agilent 8700 LDIR system is at the forefront of advancing microplastics research.

