Analysis of Diamonds by FT-IR Spectroscopy
Diamonds are by far the world's most popular gemstone. Because of this popularity and the high prices of quality gemstones, there is a large market for cheaper counterfeit stones that resemble diamonds. Detecting these counterfeit stones can be a significant problem for diamond buyers when the stones are represented as the genuine article by unscrupulous sellers. Fourier transform-infrared (FT-IR) spectroscopy can be a useful tool for buyers and sellers to determine authenticity.

Diamonds are unique among gemstones because they are composed of a single element (carbon), while virtually all other gems contain multiple elements, including significant amounts of oxides. The infrared spectrum of a diamond is equally unique and can be used as an easy way to confirm that a stone is authentic. Figure 1 compares the spectrum from a diamond with several of the most common diamond simulants. The three materials are cubic zirconia (CZ: ZrO2), yttrium aluminum garnet (YAG: Y3Al5O12), and clear corundum (white sapphire: Al2O3). The strong vibrational modes from the Al-O, Zr-O, and Si-O chemical bonds absorb the entire infrared signal below 1000 cm–1.
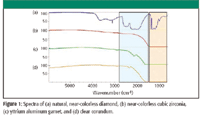
Figure 1
A diamond consists of a crystalline lattice of carbon atoms; the extreme conditions required to create diamonds also provide a way for trace amounts of other elements to be trapped in the crystal matrix. The most important trace element is nitrogen, which can be found in different forms in the diamond crystal and reveals a great deal about the diamond's character and how it was created. These nitrogen aggregates create unique features in the infrared spectrum and are a key element in classifying diamonds. The spectra from three different types of nitrogen aggregates are compared with a nitrogen-free diamond (Type IIa) in Figure 2.
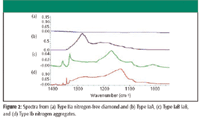
Figure 2
Hydrogen, boron, and carbonates are other important trace materials that are found in diamonds, all of which have identifiable features in the infrared spectral region. Although it is easy to confirm that a stone is a diamond, it is much more difficult to determine if it is synthetic or treated. Laboratory-grown high pressure–high temperature diamonds are now available commercially, and their identification is one of the major challenges for the gem industry today. In certain cases, a similar process can be used to treat lower quality diamonds and significantly improve their appearance. The infrared peaks corresponding to the nitrogen aggregates or the presence of other elements can be used to provide valuable evidence that a stone might not be natural. In this article, several techniques based upon Fourier transform–infrared (FT-IR) spectroscopy that are commonly employed in gemological laboratories will be discussed.
Experimental
Methodology
The instrument used in this work consisted of a Nicolet 6700 FT-IR spectrometer (Thermo Fisher Scientific, Madison, Wisconsin), equipped with an optimized beam condenser or reflection accessory. TQ Analyst (Thermo Fisher Scientific) multivariate analysis software was employed to calculate the results. The infrared spectra were acquired at 1-cm–1 spectral resolution, and a baseline correction was applied before further processing.
Rapid Confirmation That a Stone Is a Diamond
Automatic material confirmation is a technique that has been used extensively in the pharmaceutical industry to ensure that incoming material is labeled correctly. Reference spectra are acquired from all of the materials that are used in the products, and then a similarity-matching algorithm is employed to calculate the similarity of the incoming material spectrum to the specified referenced material spectrum. For diamonds, a reference spectrum from a Type IIa diamond was used to develop a similarity-match method. A match value is then computed. The value will be 100 if the spectrum from the sample is identical to the reference and zero if there is no similarity between the two spectra. Because the spectra for all diamonds are slightly different, the match value will always be less than 100. In this experiment, setting a threshold for a pass of 80 gave no false positives and yet accepted a certain amount of variance in the sample spectra. The primary features observed in a spectrum of pure diamond are the infrared phonon bands resulting from the vibrational modes of the crystal lattice structure. These peaks are observed in the 1500–4000 cm–1 spectral region. The major exception is Type IIb diamonds with high boron levels, which result in severely distorted features in the phonon region. An example of analyzing a typical diamond is shown in Figure 3.
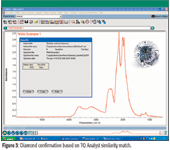
Figure 3
Classifying Diamonds
A technique used extensively in quantitative analysis is classical least squares (CLS). The basis of CLS is the assumption that the spectrum from a sample that is a mixture of known materials can be modeled by a linear combination of the spectra from the pure reference materials. In this example, spectra from diamonds with well-defined nitrogen aggregates have been used: Type IaA, Type IaB, and Type Ib. Because we do not know the actual concentrations of nitrogen in the spectra, we have arbitrarily assigned the value to be 100 ppm, so the actual values reported here are relative to the arbitrary value for illustrative purposes.
The results of this example CLS method are shown in Figure 4. Although the calculated standard error terms indicate that all three nitrogen types are present, adding more standards to the method might resolve any questions about the presence of the Type Ib aggregates. In many cases, an infrared spectrum is acquired from a stone before it undergoes the high temperature–high pressure process, because the nitrogen aggregates behave differently during the process.
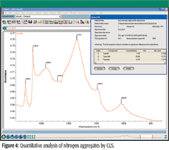
Figure 4
Many diamond spectra have a peak in the 1360 cm–1 region, which has been attributed to the formation of platelets in the crystal. This peak is interesting in that it both shifts and broadens depending upon the overall makeup of the sample. Curve resolution, or peak fitting, is a technique that can be very effective in this type of situation. This technique synthesizes peaks based upon a predefined line shape and minimizes the difference between the actual spectrum and a linear combination of the synthetic peaks. Figure 5 shows two platelet peaks that are shifted by several wave numbers.
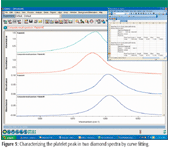
Figure 5
The results of the Peak Resolve curve fit reveal that the full width at half maximum (fwhm) has gone from 3.2 cm–1 to 4.8 cm–1 as the peak has shifted from 1359 cm–1 to 1364 cm–1. A closer examination of the curve fit results also shows that the peaks are asymmetric and can be fitted better with two synthetic peaks.
Assisting in the Detection of Synthetic Diamonds
In addition to the platelet peak, several other peaks in the spectrum can be helpful when trying to identify synthetic or treated stones. In many of these cases, the amount of nitrogen in the diamond is very low, so it can be difficult to confirm the presence of particular peaks. In this example, a simple CLS method was developed to confirm the presence of trace-level nitrogen and hydrogen by measuring the intensity of peaks at 3107 cm–1, 1344 cm–1, and 1332 cm–1. A key advantage to the CLS approach is that a standard error term is reported with the analysis. Although it is not a rigorous statistical confidence level, if the peak intensity is three to five times the reported error term, the presence of a peak has been confirmed. An example for a sample containing very low levels of nitrogen is shown in Figure 6. In this example, all three peaks are present at detectable levels.
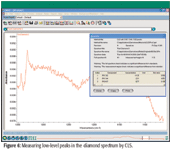
Figure 6
Conclusions
Numerous gemological laboratories employ FT-IR on a daily basis to characterize diamonds and other gemstones. As with most natural materials, there is a broad range of trace component concentrations found in diamonds. As more sophisticated methods are developed to help ensure that a stone is natural and untreated, the developers of synthetic diamonds and high pressure–high temperature treatments also learn how to better mimic the natural processes. The combination of an FT-IR spectrometer and an optimized accessory can be used with multivariate statistical analysis techniques to provide a rapid, reliable information source of great importance to classifying diamonds. By automating these methods, the results are consistent and supported by a quality, or confidence, metric. In many cases, FT-IR is used by an operator to rapidly screen out the samples that clearly pass or fail the test, allowing the outliers to be examined by an expert. While it is straightforward to detect simulants, the proliferation of high-quality synthetic and treated stones makes advanced analysis techniques such as FT-IR a key part of the modern gemological laboratory.
Stephen Lowry is with Thermo Fisher Scientific, Madison, Wisconsin.
References
(1) M.J. Mendelssohn and H.J. Milledge, Int. Geol. Rev. 37, 95–110 (1995).
(2) S.R. Boyd, I. Kiflawi, and G.S. Woods, Phil. Mag. B69, 1149 (1994).
(3) S.R. Boyd, I. Kiflawi, and G.S., Phil. Mag. B72, 351 (1995).
(4) G.S. Woods, Diamond Conf., Proc. Royal Soc. Lon. 407, 219–225 (1986).
(5) G.S. Woods and A.T. Collins, J. Phys. Chem. Solids 44, 471–475 (1983).
(6) D. Fisher and R.A. Spits, Gems Gemol. 36(1), 42–49 (2000).
(7) C.P. Smith, G. Bosshart, J. Ponahlo, V.M.F. Hammer, H. Klapper, and K. Schmetzer, Gems Gemol. 36(1), 192–215 (2000).
(8) J.E. Shigley, S.F. McClure, C.M. Breeding, A.H. Shen, and S.M. Muhlmeister, Gems Gemol. 40(2), 128–145 (2004).
(9) S. Fernandes, M. Kahn, and G. Choudhary, Australian Gemologist 21, 321–327 (2003).
Measurement of Ammonia Leakage by TDLAS in Mid-Infrared Combined with an EMD-SG Filter Method
April 9th 2024In this article, tunable diode laser absorption spectroscopy (TDLAS) is used to measure ammonia leakage, where a new denoising method combining empirical mode decomposition with the Savitzky-Golay smoothing algorithm (EMD-SG) is proposed to improve the signal-to-noise ratio (SNR) of absorbance signals.