Carbon Black At-Line Characterization Using Portable Raman Spectroscopy
Carbon black is a form of amorphous carbon. It is mainly used as reinforcement filler in automobile tires and other rubber products, but it's also used in pigments, paint, and carbon paper.
Carbon black is a form of amorphous carbon. It is mainly used as reinforcement filler in automobile tires and other rubber products, but it's also used in pigments, paint, and carbon paper. Raman spectroscopy is a very effective analytical technology for characterizing carbon materials. The Raman bands associated with different carbon bonds reveal details of the structure on the molecular level. Most of the research using Raman technology has been applied to carbon nanotubes and graphene. The fast characterization of carbon black material using Raman spectroscopy is discussed here to demonstrate that Raman technology is well suited for carbon black material characterization.
Carbon black material is mainly used as reinforcing filler in automobile tires and other rubber products. It is also used in pigments, paint, and carbon paper. The morphology study of carbon black material provides useful information about the property of the original materials and how it will affect the properties of an end user's materials. For example, the particle size distribution of the carbon black is directly related to the degree of blackness, the degree of reinforcement to the rubber, and the material's capability of ultraviolet (UV) absorption.
Because of the complexity of the material structure and lack of definitive standard test methods, material characterization of carbon black materials is rather limited to conventional tests (1), which include surface area, particle size estimated from the surface area values, iodine adsorption numbers for evaluation of carbon black grades, and dibutyl phthalate absorption numbers to determine the relative amount of oil that carbon blacks can absorb. While there are techniques such as X-ray diffraction (XRD), high-performance imaging systems such as transmission electron microscopy (TEM), and micro-Raman spectroscopy and Raman imaging systems that can effectively depict the morphology of carbon black material structure, none of these approaches allow for the quick and convenient on-line or at-line real-time testing on the molecular level that may help evaluate, control, and monitor the carbon black manufacturing process.
In this article, portable Raman spectroscopy for at-line characterization of carbon black is explored. Because of the distinctive information contained in the peak ratio between the D-band and G-band of sp2 carbon material, Raman spectroscopic analysis can be an effective test to characterize carbon black material. Because of the highly selective, unique chemical signatures contained in Raman spectra and the fact that the intensity of Raman peaks is proportional to the related compound concentration, Raman technology has been used as a molecular fingerprint to analyze molecular structures, to identify specific molecules, and to predict the chemical concentrations in mixtures. The peak intensity ratio between two Raman signature peaks can also provide useful information about material crystallinity, phase transition, and material structure disorder. Because of the nondestructive nature and the fact that no sample preparation is required for testing, Raman spectroscopy has become a go-to method of analysis.

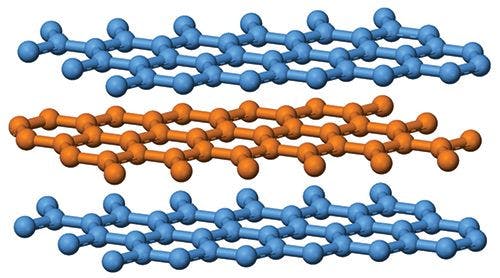

Figure 1: Carbon atoms layer stacking in graphite. Image is taken from reference 8 with permission from public domain.
Graphite Versus Carbon Black
The carbon microstructure is highly Raman active, making Raman uniquely suited for analysis of carbon materials in different crystal structures. Graphite contains hexagonal planes of carbon atoms, with four carbon atoms in one unit cell. Figure 1 displays the graphite crystal structure with carbon atoms in perfect layer stacking structure. The different planes are connected by translations or rotations around the symmetry axis (2). For the single crystal graphite symmetric group D6h4, one of the vibrational modes E2g is strongly Raman active and is associated with a Raman peak at 1582 cm-1 (G-band) (3). Figure 2 shows the graphite structure of the E2g mode within one layer, which is an in-plane vibration that is associated with the G-band. Graphite with highly single crystallinity, under the name of highly ordered pyrolytic graphite (HOPG), only displays a Raman peak at 1582 cm-1. The Raman spectrum of HOPG also displays a broad Raman peak around 2710 cm-1. This is a second-order Raman peak of graphite with the name of G' or 2D. G' implies the peak is specific to graphite, while 2D implies the second-order nature of the peak.

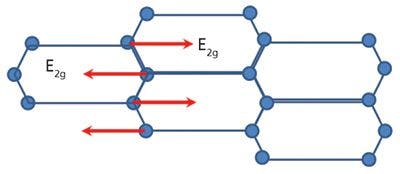

Figure 2: E2g vibrational mode of carbon atoms in one graphite layer.
Carbon black material is graphite in an amorphous structure, with a lower degree of crystallite development than graphite. For carbon black material with amorphous microcrystalline structures, another peak around 1350 cm-1 (D-band) will appear. It has been concluded that the peak at 1350 cm-1 is attributed to the structure disorder near the edge of the microcrystalline (hence the name D-band) that destructs the structure of the symmetry (3). Therefore, the Raman peak intensity ratio of ID/IG can be used to characterize the degree of disorder of the graphite materials. Researchers also believe that the ID/IG is inversely proportional to the grain size of the carbon black materials for grain sizes larger than 2 nm (4). In addition to the peak ratios, the full width half maximum (FWHM) of both the D-band and G-band provide information on the development of carbon crystallites. For both the D-band and G-band, the FWHM of the Raman bands decreases (the band narrows) when a higher degree of crystallite develops (5).
Experimental
Commercially available carbon black materials were characterized by Raman spectroscopy using the i-Raman Plus portable Raman spectrometer (B&W Tek, Inc.) with a 532-nm laser excitation and spectral resolution at 4.5 cm-1. A portable video microscope sampling system was coupled with the portable i-Raman Plus system to facilitate accurate laser focus on the sample surface. The Raman spectra were collected at room temperature with an integration time of 120 s using laser power around 40 mW.
The data analysis was done using BWSpec (B&W Tek, Inc.). Baseline correction, which is based on an algorithm called adaptive iteratively reweighted penalized least squares (airPLS) (6), was applied to the carbon black spectrum to extract the peak intensities for both the D-band and G-band.


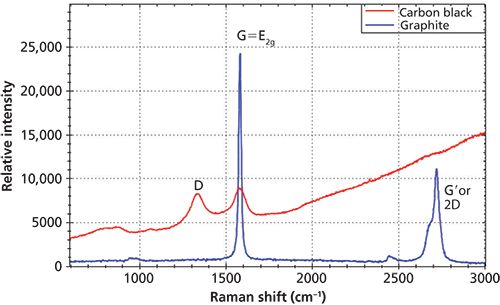
Figure 3: Raman spectra of carbon black and graphite.
Results and Discussion
The distinctive Raman peaks for carbon-based material reveals the structure difference of carbon materials. The G-band relates to an in-plane vibration that is associated graphite structure. The D-band is related to the level of disorder of the crystal structure with reduced symmetry. Figure 3 shows the overlay of Raman spectra of graphite and carbon black where the Raman spectrum of graphite displays a strong and sharp G-band while the D-band is not present at all, whereas the Raman spectrum of carbon black shows a broader G-band and the existence of the D-band that is associated with the structure disorder near the edge of the microcrystalline.

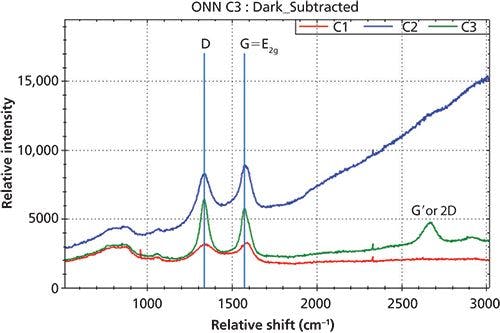
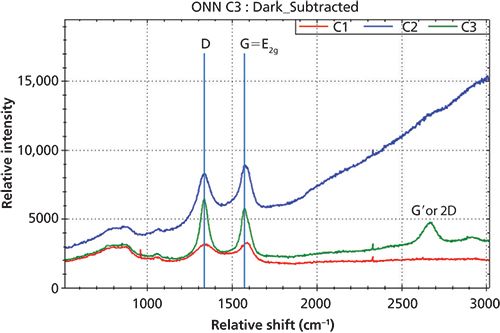
Figure 4: Raman spectra of three carbon black materials with D-band and G-band.
Figure 4 displays Raman spectra of three different carbon black samples with the noted D-band and G-band. Since the D-band is attributed to the structure disorder near the edge of the microcrystalline that destructs the structure of the symmetry of sp2 carbon, the Raman peak intensity ratio of ID/IG is directly related the degree of disorder of the graphite materials. The overlay of the Raman spectra in Figure 4 reveals the different level of ID/IG for these three carbon black materials.

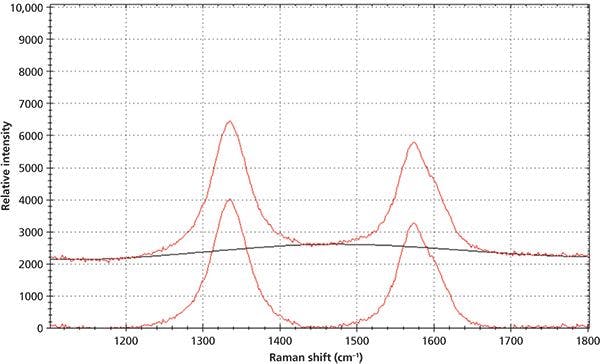
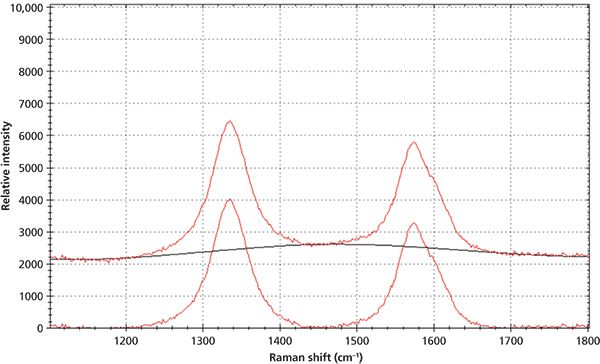
Figure 5: Raman spectrum of carbon black before and after the baseline correction.
The baseline correction was a crucial step in obtaining the accurate peak intensity which was then used to calculate peak ratio of ID/IG. Any fluorescence that may accompany the Raman signal had to be removed by the baseline correction. Figure 5 demonstrates the Raman spectrum of carbon black before and after the airPLS baseline correction. After the baseline correction, the Raman peak positions, peak intensities, and FWHM of the peaks were obtained by using the peak analysis function of the software. The Raman peak intensity ratio of the D-band and G-band was then calculated.

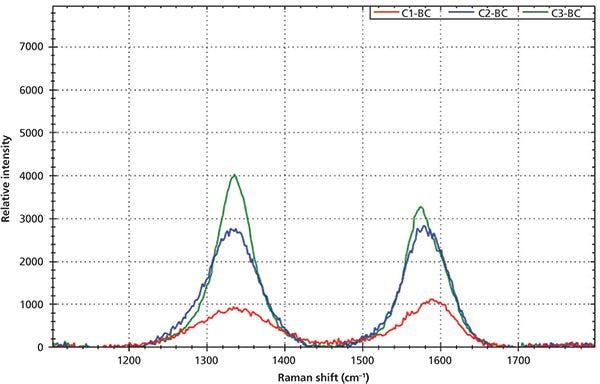
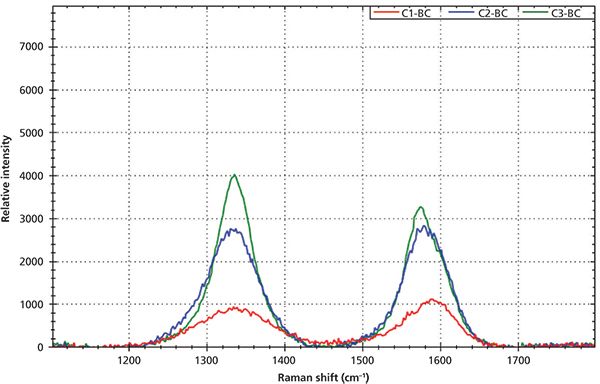
Figure 6: Raman spectra of carbon black samples after the baseline correction with different ID/IG values: red is for C1, blue is for C2, and green is for C3.
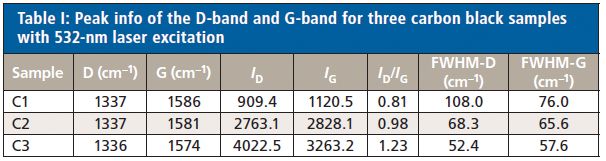
Figure 6 shows the Raman spectra of three different carbon black materials after baseline correction. The D-band and G-band peak positions, peak intensities, and peak ratios ID/IG of three samples are calculated and displayed in Table I. One feature of the D-band that makes it more interesting is that the D-band position is not independent of the excitation laser wavelength. It was reported that the D-band peak position is shifted from 1360 cm-1 to 1330 cm-1 when the laser excitation changed from 488 nm to 647 nm (7). As demonstrated in the experiment, the D-band peak position is around 1337 cm-1 when using 532-nm laser excitation. For samples C1 and C2, the ID/IG ratios are less than one, indicating that these carbon black materials have some degree of disorder, which is in the typical range of graphite rod (C1) (3) and graphite powder (C2) (3). For sample C3, the ID/IG ratio is larger than one, which indicates that the sample has a higher degree of disorder. The FWHM of both the D-band and G-band indicates the degree of crystallite development of the samples. C3 has the highest degree of development of carbon crystallites among the three samples, while C1 has the lowest degree of carbon crystallites development. The fact that the G' appears in the Raman spectrum of C3 is also an indication of the higher degree of crystallites. The development of carbon crystallite can be directly related to process parameters during the carbon black manufacturing process, such as temperature.


Conclusions
Correlations between the Raman spectra and the structure of carbon black materials can be established. The G-band represents the level of order of graphite in its single crystalline form. The presence of a D-band is related to the level of disorder of the crystal structure with reduced symmetry of the sp2 carbon. The ratio of ID/IG can be used to characterize carbon black material in several aspects, including the degree of disorder of the carbon black, an estimation of the grain size of the carbon black materials, batch uniformity when multiple measurements are taken at different locations of the materials, and the degree of development of carbon crystallite, which can be directly related to the process parameters of the carbon black manufacturing.
Compared to large benchtop, lab-grade Raman spectrometers, which cannot be easily placed on-line or at-line for real-time analysis, portable Raman spectrometers with high sensitivity are an easier alternative for obtaining quality spectra with detailed spectroscopic information and distinctive D-bands and G-bands. This may benefit carbon black manufacturing for process control and monitoring.
Dawn Yang is an applications manager with B&W Tek, Inc., in Newark, Delaware. Direct correspondence to: dawny@bwtek.com
References
(1) D.T. Norman, http://www.continentalcarbon.com/pdfs/What_Is_Carbon_Black.pdf.
(2) S. Reich and C. Thomsen, Phil. Trans. R. Soc. Lond. A 362, 2271–2288 (2004).
(3) Y. Wang, D.C. Alsmeyer, and R.L. McCreery, Chem. Mater. 2, 557–563 (1990).
(4) F. Tuinstra and J.L. Koenig, J. Chem. Phys. 53, 1126 (1970).
(5) K. Ishimaru, T. Hata, P. Bronsveld, T. Nishzawa, and Y. Imamura, J. Wood Sci. 53, 442–448 (2007).
(6) Z.-M. Zhang, S. Chen, and Y.-Z. Liang, Analyst 135, 1138–1146 (2010).
(7) R.P. Vidano, D.B. Fischbach, L.J. Willis, and T.M. Loehr, Solid State Commun. 39, 341 (1981).
(8) Benjah-bmm27-Own work. Licensed under Public Domain via Wikimedia Commons, http://commons.wikimedia.org/wiki/File:Graphite-layers-side-3D-balls.png#mediaviewer/File:Graphite-layers-side-3D-balls.png.


Getting accurate IR spectra on monolayer of molecules
April 18th 2024Creating uniform and repeatable monolayers is incredibly important for both scientific pursuits as well as the manufacturing of products in semiconductor, biotechnology, and. other industries. However, measuring monolayers and functionalized surfaces directly is. difficult, and many rely on a variety of characterization techniques that when used together can provide some degree of confidence. By combining non-contact atomic force microscopy (AFM) and IR spectroscopy, IR PiFM provides sensitive and accurate analysis of sub-monolayer of molecules without the concern of tip-sample cross contamination. Dr. Sung Park, Molecular Vista, joined Spectroscopy to provide insights on how IR PiFM can acquire IR signature of monolayer films due to its unique implementation.


