Classical Least Squares, Part I: Mathematical Theory
In this month's installment of "Chemometrics in Spectroscopy," the authors begin a new subseries with the goal of explaining the classical least squares algorithm.


One of our goals in writing this series of columns is to explicate, in words of one syllable or less, the inner workings of the various algorithms that are commonly used for analyzing data, and especially those used for multivariate calibration. In (relatively) recent times, we have presented the math behind multiple linear regression (MLR) — also sometimes known as inverse least squares (ILS), inverse Beer's law, and sometimes as the P-matrix calibration algorithm (1) — and the math behind principal component analysis (2–8).


Howard Mark
Our next victim for this type of analysis is the algorithm known as classical least squares (CLS), also known as direct least squares, the Beer's law method, and also as the K-matrix calibration algorithm, although use of this last term (as well as the corresponding "P-matrix") is discouraged, due to confusion caused by the plethora of names for the same methodology. While not as widely used in practice as the other algorithms mentioned (and others yet to be discussed), this method has the advantage of being more closely related to the way chemists and spectroscopists think about spectra, rather than how mathematicians and statisticians think about spectra. It turns out, by the way, that along the way to understanding CLS ourselves, we came across some rather interesting consequences of applying the CLS algorithm to calibration data. We will discuss all this eventually, in due course, as we explain our approach to understanding the algorithm.


Jerome Workman, Jr.
We'll begin approaching this by presenting some algebraic equations, describing the two approaches. Because we are talking about Beer's law, we begin with the equation for Beer's law:


Where
Ai is the total absorbance of the ith component in the mixture
ai is the absorbance of the pure ith component
b is the pathlength through the sample
ci is the concentration of the pure ith component
Equation 1a applies wavelength-by-wavelength, and tells us that at any given wavelength, the absorbance (A) is proportional to the absorptivity (a) of a material at the chosen wavelength, the pathlength of the light through the material (b), and the concentration of the material (c). The absorptivity (a), of course, is the implicit property of a molecule, that varies with wavelength, and constitutes the "spectrum" of that molecule. Because the pathlength is, in practice, often a quantity fixed by the cell that contains the sample, and is certainly the same for all components of a sample being measured, it is convenient to combine it with a and consider the product ab as the quantity we are measuring. This product was represented with the symbol K in older literature, hence, the origin of the "K matrix" nomenclature.
Equation 1a applies to a single component in a sample. When there are multiple absorbing components, the total absorbance is the sum of the absorbances of all the absorbing materials at the wavelength of interest. Because this happens at every wavelength, we also speak of the spectrum of a mixture, that is, the absorbance at every wavelength, as being the sum of the spectra of the components of the mixture, each one weighted by its concentration. The total absorbance at any wavelength is the sum of the absorbance, at that wavelength, of all the components in the mixture, for example:


Equation 1 was derived for, and therefore applies to, measurements made using transmission measurement geometry, when the sample is a clear (that is, nonscattering) liquid. The presence of optical scattering enormously complicates the situation, to the point where it is still considered an unsolved problem despite the extensive efforts of many scientists over the years (see references 9–14 for typical examples). We do not currently consider this situation in our column.
In this form, we have previously described how the relationship between the absorbance and analyte concentration can be found using least squares calculations (1), that is, the MLR (under any of its names, as described earlier) algorithm.


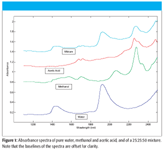
Figure 1
An example of this form of addition of spectra is illustrated in Figure 1, where we present the spectra of water, methanol, acetic acid, and a mixture of these three components. The particular mixture shown contains (by weight) 25% water, 25% methanol, and 50% acetic acid.
Both the CLS and ILS algorithms apply least squares calculations to the spectral data. The difference between the CLS and ILS approaches lies in how we treat the spectral data. Because we have presented the ILS treatment previously, we now present the corresponding treatment according to the CLS methodology. This methodology tells us that, as shown in equation 1, that at every wavelength, the total absorbance (A) equals the sum of the contributions from each component, weighted by their concentrations.
We begin by expanding the summation in equation 1b. We assume that we are working with a three-component mixture; this suffices to show how multiple components can be handled, without the equations becoming completely unwieldy, and this is the example we will use:

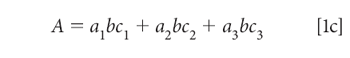

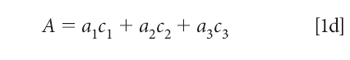
To simplify the notation, we note that the pathlength (b), which of course is the same for all components in a mixture, and we assume that it is also constant for all samples of interest to us. This permits us to assume a unit of pathlength measurement that allows us to set the pathlength to 1 (unity), so that equation 1c becomes:


The Mathematics Behind the CLS Method
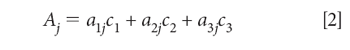
Equation 1d is our starting point for further discussion. This equation is valid for a single wavelength of a single sample. The CLS algorithm is based upon applying equation 1d to all the wavelengths in the spectral range of interest. Equation 1d becomes equation 2:


Where:
Aj is the absorbance at the jth wavelength
a1j is the absorptivity of the pure material 1 at wavelength j
c1 is the concentration of the pure material 1 (and c2 and c2 similarly)
Knowing a1j, a2j, a3j at all wavelengths j (where j goes from 1 to n, the number of wavelengths in the spectrum) means knowing the spectra of the pure components making up the mixture. If we know the spectra of those pure components, then we can set up a least squares computation this way, similar to other least squares computations we have derived.
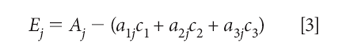
For a given known set of spectra a1j, a2j, a3j, we want to find the concentrations c1, c2, c3, that best determine the mixture absorbance A. Therefore, we define Ej as the error in the determination of the value of Aj: for the jth wavelength:


The "least square" principle defines the fact that we want to minimize the sum-squared error in the reproduction of the values of Aj over all j wavelengths. The next step, therefore, is to set up and define the sum-squared error:


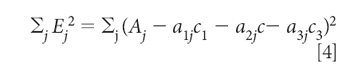
Equation 4 defines the sum-squared error. Then we minimize the sum squared error by the usual procedure of taking the derivative and setting it to zero. In this case, because we want to find the concentrations that give the least square estimation of the absorbances, the derivatives are taken with respect to the three concentrations, c1, c2, and c3. Thus, starting by taking the derivative with respect to C1, for example, we get:

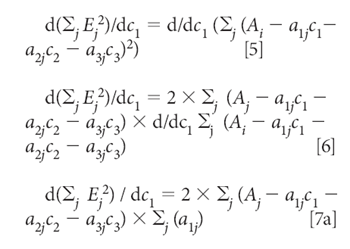

Similarly, the derivatives with respect to C2 and C2 are

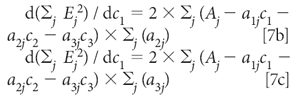

Setting all these derivatives to zero and dividing each equation by 2 gives us

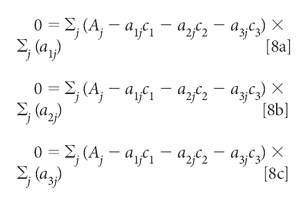

Distributing the summations and multiplying through by the aij, we get

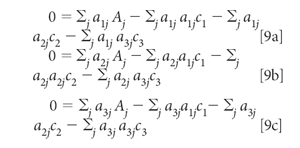

Finally, moving the first term in each equation to the other side:


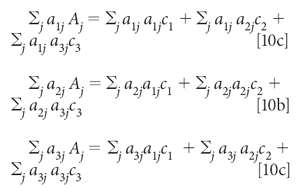
With known spectra for the three components, a1, a2, and a3, and a measured spectrum for A, the unknown variables in equation 10 are the three concentrations, c1, c2, and c3. Once the data (that is, the spectral values) are plugged into the expressions represented by equation 10, the equations can be solved (by considering them as simultaneous equations, and solved for the three value of c.
Alternatively, the equations can be converted into a matrix expression, in which equation 10 becomes


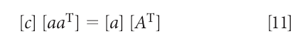
which, when solved for the concentration [c], is


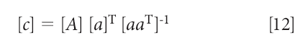
Put into this form, equation 12 looks an awful lot like the MLR equation, and even the whole derivation of it (1). Anyone reading the above explanations will be (or at least should be) asking themselves, "So what's the difference between the "inverse" least squares and this "Classical" (or "direct" least squares) methods? They're both least squares, aren't they?"
The answer is "Yes, but . . .". The matrix equations are the same, and the computations are the same. The differences lie in the meanings of the variables that the equations represent, and therefore, the data that go in the computations specified by those equations.
In both formulations, the vector [c] represents the concentrations of the various components of the samples of interest. In the "least squares" equations for MLR, those concentrations are considered "known" because they have been measured by some other, external "reference lab" method. In CLS, the concentrations are unknown, and are computed as the result of the least squares computations themselves. In fact, this application of CLS is virtually an "absolute" computation. We compute the concentration of the components of a mixture based solely upon first principles, that is, the principal of absorbance being proportional to concentration, in accordance with Beer's law.
In both formulations, the spectra of mixture samples are measured. In MLR, those spectra are related to the reference laboratory values by the least squares calculations. In CLS, those spectra are related to the spectra of the pure components, no reference laboratory values are used.
In CLS, spectra of the mixture components in pure form are measured. No corresponding measurements are made for the MLR algorithm. In a sense, the spectra of the pure components "replace" the reference laboratory results, and by virtue of their being "pure," serve as "absolute" references for the computations.
So in summary, concentration information about mixture components, as well as spectra of the mixtures are involved, each in their own way, in both algorithms. But each algorithm also requires a piece of data that the other does not. MLR requires external "Reference Laboratory" values for the concentrations, while CLS requires spectra of the pure mixture components. Indeed, by properly organizing the data, the same software that is used for MLR calibrations can be used for CLS calculations as well. One simply needs to keep track of what data has been used for the different variables in the software, and which ones contain the results.
The evaluation of the CLS algorithm historically has been similar to the MLR algorithm: How well does it predict? The difference lies in what its predicting. In the case of the CLS algorithm, the question is how well does it predict the spectrum of the mixture?
We applied the CLS algorithm to the spectrum of the 25% water, 25% methanol, 50% acetic acid shown in Figure 1, and then calculated the predicted value of absorbance at each wavelength (the predicted spectrum). Figure 2 presents the plot of the mixture spectrum reproduced from the calculated CLS concentrations. We observe that, while the main features of the mixture spectrum are reproduced, overall, the recreation of the spectrum is indifferently good, at best. We will return to this data and re-examine the underlying causes of this less-than-stellar performance, after examining some more aspects of CLS theory in our next column.


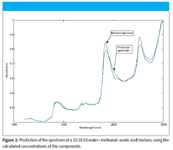
Figure 2
Howard Mark serves on the Editorial Advisory Board of Spectroscopy and runs a consulting service, Mark Electronics (Suffern, NY). He can be reached via e-mail: hlmark@prodigy.net
Jerome Workman, Jr. serves on the Editorial Advisory Board of Spectroscopy and is currently working in the medical device industry using spectroscopy. His new email address is: jworkman@masimo.com
References
(1) H. Mark and J. Workman, Spectroscopy 21(5), 34–38 (2006).
(2) H. Mark and J. Workman, Spectroscopy 22(9), 20–29 (2007).
(3) H. Mark and J. Workman, Spectroscopy 23(2), 30–37 (2008).
(4) H. Mark and J. Workman, Spectroscopy 23(5), 14–17 (2008).
(5) H. Mark and J. Workman, Spectroscopy 23(6), 22–24 (2008).
(6) H. Mark and J. Workman, Spectroscopy 23(10), 24–29 (2008).
(7) H. Mark and J. Workman, Spectroscopy 24(2), 16–26 (2008).
(8) H. Mark and J. Workman, Spectroscopy 24(5), 14–15 (2009).
(9) A. Schuster, Phil. Mag. 5, 243 (1903).
(10) A. Schuster, Astrophys. J. 21, 1 (1905).
(11) P. Kubelka, F. Munk, Z. Techn. Physik 12, 593 (1931).
(12) G. Kortum, Reflectance Spectroscopy: Principles, Methods, Applications, 1st ed. (Springer-Velag, New York, 1969).
(13) W.W. Wendlandt and H.G. Hecht, Reflectance Spectroscopy (John WIley and Sons, Hoboken, New Jersey, 1966).
(14) D.J. Dahm and K.D. Dahm, Interpreting Diffuse Reflectance and Diffuse Transmittance: A Theoretical Introduction to Absorptin Spectroscopy of Scattering Materials, 1st ed. (IM Publications; West Sussex, UK, 2007).