Comparison of Enhanced Productivity ICP Approaches for Engine Oil Analysis
The measurement of metals in used engine oils provides valuable information about the engine and the state of the lubricant, information that can be used to increase the efficiency of the equipment in which the engine resides and lower the cost of maintenance. Table I lists the metals that are typically of interest and their sources (1–4). The presence of wear metals is important because it can pinpoint a specific component for maintenance. For example, copper is an indication of bearing wear, while lead can come from bushings and chromium from piston rings and seals. Other elements such as calcium, magnesium, and zinc are added to the oil to produce a "soap" to protect engine components. So it is important to ascertain that these metals remain at an optimum concentration. Also, dirt can contaminate the oil, which would be evidenced by the presence of elements like silicon and sodium.
The measurement of metals in used engine oils provides valuable information about the engine and the state of the lubricant, information that can be used to increase the efficiency of the equipment in which the engine resides and lower the cost of maintenance. Table I lists the metals that are typically of interest and their sources (1–4). The presence of wear metals is important because it can pinpoint a specific component for maintenance. For example, copper is an indication of bearing wear, while lead can come from bushings and chromium from piston rings and seals. Other elements such as calcium, magnesium, and zinc are added to the oil to produce a "soap" to protect engine components. So it is important to ascertain that these metals remain at an optimum concentration. Also, dirt can contaminate the oil, which would be evidenced by the presence of elements like silicon and sodium.


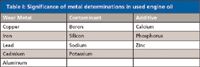
Table I: Significance of metal determinations in used engine oil
Despite the importance of these measurements, the need for fast analysis (high volumes of samples) and the undemanding accuracy requirements (trend determination only is required), speed of analysis is often one of the most critical requirements of the industry. In this paper, we will compare two methods of oil analysis, one using off-line dilution followed by high-speed analysis, and the other employing in-line dilution and analysis with a single high productivity system. The preference of one approach over the other will depend more upon the individual laboratory's operational set-up than on anything else.

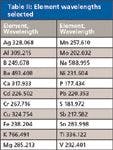
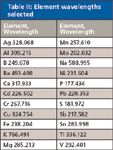
Table II: Element wavelengths selected
Experimental
All work was performed on an inductively couple plasma optical emission spectroscopy (ICP-OES) system (Vista Pro radial, Varian Instruments, Melbourne, Australia) configured with a Twinnabar spray chamber (20-mL internal volume with baffle), a ceramic VeeSpray modified Babington nebulizer, and a single-piece quartz torch with an 0.8-mm-bore injector (all from Glass Expansion, Melbourne, Australia). Organometallic standards were used throughout (Conostan, Ponka City, Oklahoma). The elements selected for monitoring and the associated wavelengths of measurement are listed in Table II. The plasma conditions are listed in Table III.

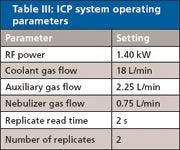
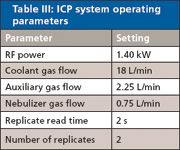
Table III: ICP system operating parameters
Off-line Dilution Approach
For this approach, an auto diluter (ML500 Series, Hamilton, Reno, Nevada) was used to affect a 10x dilution of the raw oil. Diluted samples were then placed in an AIM High Capacity autosampler (Clontarf, Australia), and analyzed via a Niagara Plus sampling accessory (Glass Expansion). This device was previously described for the analysis of environmental waters (5). The accessory utilizes a recently developed switching valve and a positive displacement pump to speed both delivery of the sample to the nebulizer and subsequent washout. The switching valve was designed for minimum carryover and fast washout and has the following characteristics:
- Minimal swept volume
- Constant sample path ID
- Rigid rotor
- Replaceable PTFE stator
- Color-coded ports for ease of assembly
The design and material of the rotor and stator are of particular importance for this application due to the need for a rugged analytical protocol. Wear metals exist as small particles in a slurry of oil (6) and can cause damage to the valve if the wrong materials are employed. In this case, the rotor is composed of PEEK and is quite resistant to scoring, while the less wear-resistant stator is designed for easy removal, cleaning, and installation. The proximity of the nebulizer to the valve, which is mounted on an adjustable-height stand, contributes to the speed of the system. Figures 1 and 2 demonstrate the operation of the switching valve in its two modes of operation. In the "Rinse/Refill" mode, the sample loop is being loaded via the positive displacement pump while the nebulizer is rinsed with solvent. In the "Home/Inject" mode, the sample in the loop is injected into the nebulizer while the remainder of the system is rinsed with solvent.

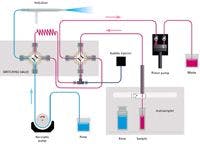
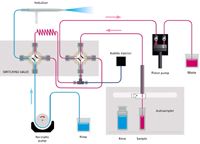
Figure 1: Niagara Plus flow schematic, Rinse/Refill stage.
The method parameters are given in Table IV. Note that the positive displacement pump is programmed to use different speeds during the two modes, a faster speed while loading the sample loop and a slower speed while rinsing the system (inject mode). This not only conserves solvent and reduces waste, but we have found that the slower speed also improves washout. Two other fields merit explanation. "Time in Sample" allows the autosampler probe to be programmed to come out of the sample while the sample loop is being loaded, thus reducing the cycle time even more. The "Bubble Inject Time" defines when the bubble injector activates to place several gas bubbles in the sample line to limit boundary diffusion. Note the rinse time in the instrument method is set to zero, as the accessory is rinsing during the sample loading step anyway. For the sake of comparison, we also employed a method with a 1-s rinse programmed (which due to the autosampler and processor overhead contributed several seconds to the cycle time).

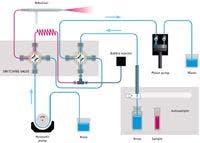

Figure 2: Niagara Plus flow schematic; Home/Inject stage.
In-Line Dilution and Analysis
This approach substituted an accessory (Assist, Glass Expansion) for the autodiluter system that is mounted in front of the ICP spectrometer. The three syringes that are part of the accessory system are used to load the sample loop, inject the sample, and dilute the oil. As shown in Figure 3, during the Rinse/Refill stage, the dilutor syringe pumps kerosene diluent while the sample uptake syringe draws sample. The two syringes are programmed to affect a 10× dilution of sample. During this time, the rest of the sample introduction system is rinsed with diluent. During the Home/Inject stage (Figure 4), the diluter and sample uptake syringes are 180° out of sync to continuously pump diluent through the sample lines while the inject syringe delivers the diluted sample to the nebulizer. The accessory method parameters are given in Table V. While the sample loop was being filled for 15 s, the autosampler probe started moving to the rinse after only 11 s (Time in Sample). Standardization was performed by autodilution of the stock standard with the accessory. Again the programmed rinse time was zero.

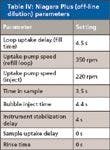

Table IV: Niagara Plus (off-line dilution) parameters
Results
Using the Niagra Plus (off-line dilution), we evaluated carryover with and without a programmed 1-s rinse (Figure 5). The data were obtained by running successive blank/100 ppm standard pairs and monitoring the blanks as a percent of the high standard in comparison to the first blank. The theory is that if carryover is significant, an increasing trend in the blanks would result. In either case, the level did not increase with increasing numbers of standards run, indicating no significant improvement using the 1-s programmed rinse. Using the 1-s programmed rinse method, we took a second look at carryover for several elements by running a blank subsequent to a very high concentration sample (3000 ppm of boron and potassium and 1500 ppm of phosphorus and zinc). The test was run twice to gauge reproducibility (Figure 6). Carryover did not exceed 0.2% for any element monitored. The sample cycle time without a programmed rinse was 18.5 s.

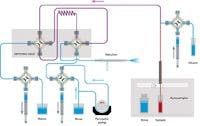
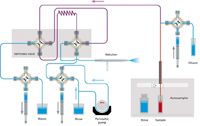
Figure 3: Assist flow schematic, Rinse/Refill stage.
Using the Assist (in-line dilution), we first examined the linearity of in-line standard dilution and analyis. The resultant calibration curves for four elements are shown in Figure 7. All have correlation coefficients of at least five nines demonstrating excellent correlation. Figure 8 examines the difference between the first and second replicate of an analysis. To attain confident results, we averaged 10 first replicate results of a high standard and compared that average to the average of 10 s replicate results. Note that there is no significant difference between replicates for the program used (Assist ) (blue). This test is a valuable test protocol to ascertain that the method is adequately developed. The red bars represent a hypothetical case of insufficient uptake volume. In this case, if the sample loop has not been adequately filled, the second replicate will be lower than the first. The yellow bars represent a hypothetical case of insufficient read delay, where the signal is being measured before the sample reaches equilibrium in the torch.
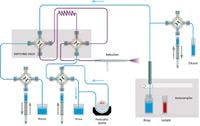
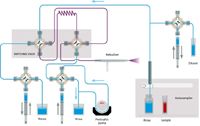
Figure 4: Assist flow schematic; Home/Inject stage.
Reproducibility of a 100-ppm standard was compared and the data are shown in Figure 9. Although the Niagara Plus data show slightly better reproducibility, the Assist data are still well within the 10% deviation goal. Better reproducibility can be obtained by reducing the uptake rate of the undiluted oil and incorporating a nonlaminar flow path in the sample loop and uptake lines (putting bends such as figure eights in the lines). This leads to greater mixing of the sample and diluent at the expense of slightly longer analysis time. Figure 10 shows the carryover found with the accessory by running a succession of blank/100ppm standard pairs. Note that the results compare well with those shown in Figure 5b for the Niagara Plus system (no programmed rinse for either). The sample cycle time with the Assist was 28 s.

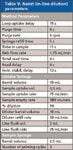
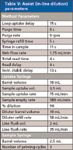
Table V: Assist (in-line dilution) parameters
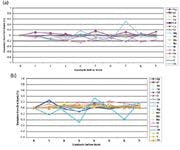
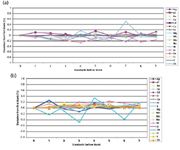
Figure 5: Carryover test for diluted oil on Niagara Plus (a) with and (b) without a 1-s programmed rinse.

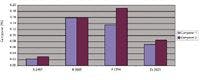
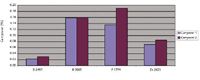
Figure 6: Carryover test for high concentration elements for diluted oil on Niagara Plus with 1-s programmed rinse.

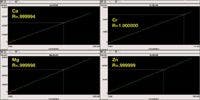
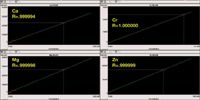
Figure 7: Assist generated calibration curves.
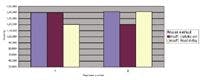

Figure 8: Replicate study for Assist; average of 10 100-ppm standard results for 21 element lines.

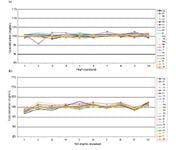
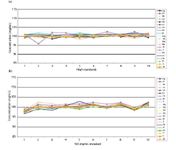
Figure 9: Reproducibility study: (a) Diluted oil on Niagara Plus without a programmed rinse; (b) undiluted oil with Assist without a programmed rinse.


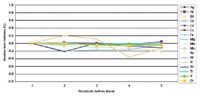
Figure 10: Carryover test for undiluted oils on Assist system without a programmed rinse.
Conclusion
We have shown that acceptable reproducibility and washout can be achieved with two enhanced productivity approaches to the analysis of engine oils for metals. The faster sample cycle time of 18.5 s was achieved with the Niagara Plus off-line dilution method, while the less labor intensive Assist in-line dilution and analysis method still attained a cycle time under 30 seconds. Without these enhanced productivity accessories, sample cycle times from 45 to 60 seconds are typical.
Jerry Dulude is with Glass Expansion, Inc., Pocasset, Massachusetts. Scott Bridger is with Glass Expansion, Pty., West Melbourne, Australia.
References
(1) R.A. Hofstader, O.I. Miller, and J.H. Runnels, "Analysis of Petroleum for Trace Metals," in Advances in Chemistry Series No. 156 (ACS, Washington DC, 1976).
(2) B.E. Buell, Appl. Atom. Spectrosc. 2, 53 (1978).
(3) W.A. Glaeser, F.D. Newman, and D.K. Snediker, "The Application of Oil Analysis Techniques to the Diagnosis of Failure in U.S. Army Construction Vehicles," U.S. Dept. of Commerce, National Technical Information Service, Nov. (1973).
(4) C.A. Waggoner, "Spectrometric Oil Analysis-Principles and Practice, Materials Report," Defense Research Establishment, Pacific Victoria, BC, Canada (1971).
(5) J. Dulude and V. Dolic, Spectroscopy Supplement, 16–23, November 2009.
(6) V. Sychra, I. Lang, and G. Sebor, Prog. Anal. Atom. Spectrosc. 4, 341–426 (1981).


Getting accurate IR spectra on monolayer of molecules
April 18th 2024Creating uniform and repeatable monolayers is incredibly important for both scientific pursuits as well as the manufacturing of products in semiconductor, biotechnology, and. other industries. However, measuring monolayers and functionalized surfaces directly is. difficult, and many rely on a variety of characterization techniques that when used together can provide some degree of confidence. By combining non-contact atomic force microscopy (AFM) and IR spectroscopy, IR PiFM provides sensitive and accurate analysis of sub-monolayer of molecules without the concern of tip-sample cross contamination. Dr. Sung Park, Molecular Vista, joined Spectroscopy to provide insights on how IR PiFM can acquire IR signature of monolayer films due to its unique implementation.

Researchers Develop Adaptive Gap-Tunable SERS Device
April 24th 2024In a new study, researchers from Ulsan National Institute of Science and Technology and Pohang University of Science and Technology presented a new surface-enhanced Raman spectroscopy (SERS) device, improving gap plasmon resonance.


