Comprehensive Analysis of Human Plasma Using Gas Chromatography–High Resolution Time-of-Flight Mass Spectrometry: A Workflow to Leverage Electron and Chemical Ionization
Gas chromatography with electron ionization and mass spectrometry (GC–EI-MS) detection is a workhorse among analytical techniques in metabolomics. A major challenge in the utilization of GC–EI-MS in metabolomics is the identification of unknowns.
Gas chromatography with electron ionization and mass spectrometry (GC–EI-MS) detection is a workhorse among analytical techniques in metabolomics. A major challenge in the utilization of GC–EI-MS in metabolomics is the identification of unknowns. The recent availability of high resolution, accurate mass, time-of-flight mass spectrometry (TOF-MS) systems provides great potential for identifying unknowns by reducing uncertainty in possible formulas and enhancing detection continuity between sample sets. A workflow using GC–EI-MS spectra for library identification, with molecular formula information for unknowns provided by chemical ionization-mass spectrometry (CI-MS) and accurate mass analysis was used for the analysis of blood plasma.
Metabolomics provides a foundation for quantitative, comparative biology and is indispensable for the comprehensive characterization of molecules and differential analysis of populations. It entails instrumental detection, characterization, and quantification of small molecules (molecular weight < 1500 Da) produced, or transformed in the cells of living organisms (1,2). Although no single instrument is capable of fully profiling the metabolome, the unique capabilities of time-of-flight mass spectrometry (TOF-MS) make it an ideal tool for metabolomic studies. Gas chromatography–time-of-fight-mass spectrometry (GC–TOF-MS) is a powerful approach for unbiased metabolic profiling and quantitation of a diverse array of metabolites (3,4). High-resolution TOF-MS provides additional benefits such as mass accuracies below 1 ppm for robust formula determinations and resolving power in excess of 50,000 for resolution of isobars and minimization of background interferences. A workflow that combines accurate mass electron ionization (EI) and chemical ionization (CI) high-resolution TOF-MS for confident characterization of different compound classes was used for the analysis of human blood plasma. It includes recommendations for sample preparation, analytical conditions, and data analysis.
General Workflow
The majority of metabolites in blood plasma are labile and exhibit low volatility making their analysis by GC difficult. This is addressed by using a two step derivatization procedure involving the treatment of samples with O-methylhydroxylamine hydrochloride in pyridine (MEOX) followed by silylation with N-methyl-N-trifluoroacetamide/1% trimethylchlorosilane (MSTFA) (5). This two-step procedure minimizes the number of possible forms of reducing sugars as shown for glucose in Figure 1. Treatment of glucose with MSTFA (Figure 1b) results in four different forms (α- and β-furanose and pyranose trimethylsilyl derivatives), while the two-step procedure typically produces two geometric isomers of the open chain structure of the monosaccharide (Figure 1a). Note that one isomer is produced preferentially in this two-step derivatization of glucose. This not only simplifies the analysis of blood samples, but also increases the likelihood of compound detection.
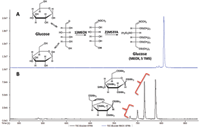
Figure 1: (a) Extracted ion chromatogram showing one major product for the two-step derivatization of glucose. (b) Products for the one-step MSTFA derivatization of glucose.
GC–MS compound characterization in metabolomics relies primarily on retention time and spectral similarity. A higher confidence for feature identification can be achieved through the addition of accurate mass formula determinations for molecular ions, quasimolecular ions, and fragments. Key to the success of analyte identification was a workflow that included both EI and CI high-resolution TOF-MS data acquisition (Figure 2) (6). CI high-resolution TOF-MS data were critical in characterizing compounds that produced poor spectral matches in relation to commercially available libraries or did not exhibit molecular ions in their EI high-resolution TOF-MS mass spectra.
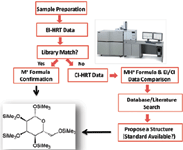
Figure 2: General workflow.
Sample Preparation
Blood plasma (100 μL) was transferred to a 2-mL microtube and treated with 400 μL of methanol to precipitate proteins. The heterogeneous mixture was vortexed for 30 s at 2500 rpm and centrifuged for 15 min at 15,000 rpm. The supernatant was removed and transferred to a GC vial (400 μL insert). The mixture was dried with a SpeedVac for 2 h and lyophilized overnight at -50 °C to remove residual water. The dry sample was treated with 25 μL of MEOX reagent (20 mg/mL in pyridine) and shaken at 80 °C for 15 min. It was then treated with 75 μL of MSTFA and shaken at 80 °C for 15 min. The product mixture was allowed to cool to room temperature, vortexed for 30 s and analyzed by EI and CI high-resolution TOF-MS.

Table I: Data acquisition instrument settings for GC
Data Acquisition (Instrument Settings)
See Tables I and II in the on-line version of this article for the GC and MS instrument settings.

Table II: Data acquisition instrument settings for MS
Results
An analytical ion chromatogram (AIC) for National Institute of Standards and Technology (NIST) human plasma is displayed in Figure 3, and can be divided into three general areas based on compound classes: acids, diacids, amino acids; sugars and related compounds; and fatty acids and sterols. Chromatographic peaks corresponding to derivatives of 5-oxo-proline, inositol, and α-tocopherol are marked with asterisks (*).
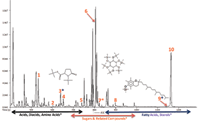
Figure 3: EI high-resolution TOF-MS, AIC of NIST human plasma.
Quality EI high-resolution TOF-MS data indicated traditional fragmentation and facilitated searches against nominal mass libraries as evident by similarity values for representative compounds in human plasma (Table III). Similarity values for nine of the compounds ranged from 848 to 915 out of a possible score of 1000.
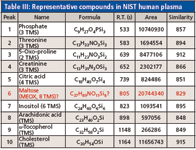
Table III: Representative compounds in NIST human plasma
An increased level of confidence for compound identification was achieved through accurate mass molecular and fragment ion formula determinations. For example, the peak true (deconvoluted) mass spectrum, NIST library match, and molecular ion mass accuracy values for a creatinine derivative (3 TMS) in human plasma are shown in Figure 4 in the on-line version.
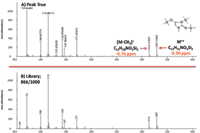
Figure 4: (a) Peak true and (b) library mass spectral data for a creatinine derivative. Library match score: 866/1000.
Mass accuracy values for creatinine ions at m/z = 329.17665 [M]+ and m/z = 314.15323 [M-CH3]+ were -0.90 and -0.76 ppm, respectively. Additional molecular and fragment ion mass accuracy values for the other representative compounds in NIST human plasma are listed in Table IV. Values ranged from -1.10 to 0.40 ppm (mean |ppm| = 0.69).
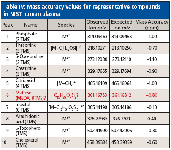
Table IV: Mass accuracy values for representative compounds in NIST human plasma
Combining EI and CI high-resolution TOF-MS accurate mass data is particularly useful for compounds without molecular ions in their EI high-resolution TOF-MS spectra. This is illustrated in the EI high-resolution TOF-MS data for inositol where the molecular ion is absent; however, a strong protonated molecular ion [M+H]+ is visible in its CI high-resolution TOF-MS spectrum at m/z = 613.30730 (Figure 5).
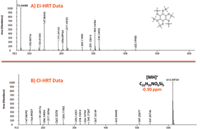
Figure 5: (a) EI and (b) CI high-resolution TOF-MS spectra for inositol.
Leveraging accurate mass data was critical for the characterization of compound 6 (Tables III and IV) because spectral similarity searches were inconclusive. It was misidentified as the MEOX/TMS derivative of maltose (similarity = 829/1000). Furthermore, the first 10 library hits (similarity >800) were derivatized disaccharides (Table V). This was not surprising since sugars are difficult to characterize because of their thermal instability and similar EI-MS fragmentation patterns.
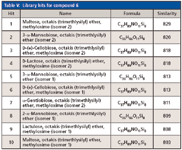
Table V: Library hits for compound 6
Acquisition of CI high-resolution TOF-MS data for compound 6 (Figure 6) resulted in a protonated molecular ion at m/z = 570.29486 (C22H55NO6Si5, MA = 0.00 ppm). Compound 6 was determined unequivocally to be glucose (MEOX, 5 TMS) after comparison to data obtained from a derivatized authentic standard.
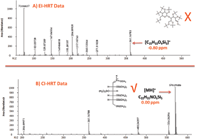
Figure 6: (a) EI and (b) CI high-resolution TOF-MS data for compound 6 in human plasma.
Conclusion
The methodology presented in this study provides a workflow for rapid and reliable profiling of human plasma. While high quality spectral data and excellent mass accuracy values resulted in confident identification of most compounds using EI, the addition of CI high-resolution TOF-MS data was essential for characterization of labile blood plasma compounds with absent or low-abundance molecular ions.
On-Line Edition
The on-line version of this article includes Figure 4 as well as Tables I and II. To see the full version please visit: spectroscopyonline.com/AlonsoCTMS1013.
References
(1) T. Kind, G. Wohlgemuth, D.Y. Lee, M. Palazoglu, S. Shahbaz, and O. Fiehn, Anal. Chem. 81, 10038–10048 (2009).
(2) A. Jiye, J. Trygg, J. Gullberg, A.I. Johansson, P. Johnsson, H. Antti, S.L. Marklund, and T. Moritz, Anal. Chem. 77, 8086–8094 (2005).
(3) B. Ma, Q. Zhang, G.-J. Wang, J.-Y. A, D. Wu, Y. Liu, B. Cao, L.-S. Liu, Y.-Y. Hu, Y.-I. Wang, and Y.-Y. Zhen, Acta Pharmacol. Sin. 32, 270–278 (2011).
(4) J.W. Allwood, A. Erban, S. de Koning, W.B. Dunn, A. Luedemann, A. Lommen, L. Kay, R. Loscher, J. Kopka, and R. Goodacre, Metabolomics 5, 479–496 (2009).
(5) W.B. Dunn, D. Broadhurst, P. Begley, E. Zelena, S. Francis-McIntrye, N. Anderson, M. Brown, J.D. Knowles, A. Halsall, J.N. Haselden, A.W. Nicholls, J.D. Wilson, D.B. Kell, and R. Goodacre, The Human Serum Metabolome (HUSERMET) Consortium Nature Protocols 6(7), 1060–1083 (2011).
(6) S. Abate, Y.G. Ahn, T. Kind, T.R.I. Cataldi, and O. Fiehn, Rapid Commun. Mass Spectrom. 24, 1172–1180 (2010).
David E Alonso, Joe Binkley, John Heim, and Jeff Patrick are with LECO Corporation. Direct correspondence to: david_alonso@leco.com

Getting accurate IR spectra on monolayer of molecules
April 18th 2024Creating uniform and repeatable monolayers is incredibly important for both scientific pursuits as well as the manufacturing of products in semiconductor, biotechnology, and. other industries. However, measuring monolayers and functionalized surfaces directly is. difficult, and many rely on a variety of characterization techniques that when used together can provide some degree of confidence. By combining non-contact atomic force microscopy (AFM) and IR spectroscopy, IR PiFM provides sensitive and accurate analysis of sub-monolayer of molecules without the concern of tip-sample cross contamination. Dr. Sung Park, Molecular Vista, joined Spectroscopy to provide insights on how IR PiFM can acquire IR signature of monolayer films due to its unique implementation.