Determination of 2-Hydroxy-4-(methylthio)butanoic Acid in Bovine Serum and Sea Water
Simple, sensitive, rapid, selective, and precise reversed-phase liquid chromatography (LC), electrospray ionization mass spectrometry (ESI-MS), and tandem MS (ESI-MS-MS) methods were developed and validated for the determination of 2-hydroxy-4-(methylthio)-butanoic acid (HMTBA) in bovine serum and sea water matrix. HMTBA is the ?-hydroxy analog of the sulfur-containing amino acid methionine and is extensively used as a methionine supplement in poultry and bovine feed.
Simple, sensitive, rapid, selective, and precise reversed-phase liquid chromatography (LC), electrospray ionization mass spectrometry (ESI-MS), and tandem MS (ESI-MS-MS) methods were developed and validated for the determination of 2-hydroxy-4-(methylthio)-butanoic acid (HMTBA) in bovine serum and sea water matrix. HMTBA is the α-hydroxy analog of the sulfur-containing amino acid methionine and is extensively used as a methionine supplement in poultry and bovine feed.
Methods were developed and validated for the determination of 2-hydroxy-4-(methylthio)butanoic acid (HMTBA), which is a water-soluble hydroxy acid. HMTBA is a commercially available α-hydroxy analogue of the sulfur-containing limiting amino acid methionine.
HMTBA and its isopropyl ester has been shown to be a highly effective dietary methionine supplement in dairy cows, poultry, and aquaculture (1–10). It has been shown that both the D and L enantiomers are converted to L-methionine (L-Met) through a stereospecific transamination pathway (11–13). The relative efficacy of uptake of racemic HMTBA and D,L-Met have been investigated in several studies; efficacies in such studies have been established through growth rate assessment in poultry or milk production rate in lactating cows. Studies show that HMTBA or its isopropyl ester supplementation yield higher growth rates and higher milk yields than Met supplementation (13,14). Uptake of HMTBA and its subsequent conversion to methionine has been studied in lactating dairy cows with infusion of 13C-labeled HMTBA. It was shown that infusion of HMTBA increased whole-body plasma flux of Met (15). It has been postulated that uptake of Met and HMTBA from the gastrointestinal track involve different mechanisms; Met uptake involves an active transport across the cell membrane and HMTBA uptake occurs through diffusion, this uptake is more efficient especially when animals experience stress, for example, heat stress. It has also been shown that HMTBA can lead to increased production of antioxidant metabolites such as taurine and reduced glutathione (16). However, experiments that link HMTBA supplemented in feed directly with its concentration in blood serum have not been reported in literature.
HMTBA has also been used in a chelated form such as zinc-HMTBA (Zn-[HMTBA]2) which is an efficient carrier of micronutrients (17,18). Zinc-HMTBA chelate has also been used as an antifouling agent in marine paints and coatings (19). It has been reported that it minimizes biofouling and is less toxic to the environment than other Zn and tin-based antifouling agents. It has also been shown that Zn-HMTBA is more effectively retained in the coatings. However, direct leaching of HMTBA from marine coatings and its stability in the marine environment have not been reported because of a lack of accurate and precise methods for HMTBA determination in sea water. This article deals with a sensitive, accurate, and precise method for quantification of HMTBA in blood serum and sea water.
Experimental
Chemicals and Reagents
HMTBA was obtained from Novus International, Inc. High performance liquid chromatography (HPLC)-grade acetonitrile, methanol, and acetone were obtained from Fisher Scientific. Ammonium hydroxide (NH4OH, 28–30% solution of ammonia in water) and sodium chloride (NaCl, certified ACS grade) were also obtained from Fisher Scientific. Trifluoroacetic acid (spectrophotometric grade) was procured from Sigma-Aldrich. Adult bovine serum was obtained from Hyclone. Water was purified with a Synergy 185 filtration system (Millipore) prior to use. Mobile phases were filtered using 0.22-μm type GV membrane filters (Millipore) before use. Sample solutions were filtered through 0.1-μm type GVHP membrane filters (Millipore) before the analysis. Bovine serum and sea water samples were obtained from Novus International, Inc. All the samples were stored at -30 °C before the analysis.
Apparatus
HPLC
HMTBA determinations were carried out using a Hitachi LaChrom Elite HPLC system (Hitachi High Technologies America) equipped with a model L2100 solvent delivery system, a model L2200 autosampler, a model L2300 column oven, and a model L2450 diode array detector.
Mass Spectrometry System
HMTBA determinations were also carried out with a Varian (Agilent Technologies) model 1200 L triple-quadrupole mass spectrometer equipped with an electrospray ionization (ESI) source and a Harvard 11 plus infusion syringe pump. The liquid chromatography–tandem mass spectrometry (LC–MS-MS) system consisted of Prostar 210 solvent delivery pumps, a model Prostar 410 autosampler, and a model Prostar 325 dual-wavelength UV–vis detector (all from Agilent Technologies).
Accurate Mass MS System
Accurate mass measurements of selected samples were carried out with a Varian 920 FT-MS ion cyclotron resonance system equipped with a 7-T magnet and Omega FT-MS workstation version 9.2.30 software.
Sample Preparation
Extraction of Serum Samples
Serum samples (1 mL) were stored at -30 °C; samples were transferred and then lyophilized for 12 h. The lyophilized residue was mixed with 2 mL of methanol, agitated with a vortex mixer for 30 s, and then sonicated for 5 min. The sonicated mixture was centrifuged for 15 min at 3000 rpm, supernatant was transferred to a 10-mL vial. The precipitate was extracted twice with 2 mL of methanol. The extracts were pooled and brought to near dryness under a nitrogen stream. The dried residue was reconstituted in 1 mL of a 50:50 (v/v) water–methanol mixture. Sample extracts were filtered through 0.1-μm syringe filters and an aliquot was introduced into either a reversed-phase LC, ESI-MS, or ESI-MS-MS system for HMTBA determination.
Extraction of Sea Water Samples
Sea water samples were extracted with a procedure similar to that used for the extraction of serum samples. Sea water samples (1 mL) were stored at -30 °C, and samples were transferred and then lyophilized for 12 h. The lyophilized residue was mixed with 2 mL of acetone and agitated with a vortex mixer for 30 s, then sonicated for 5 min. The sonicated mixture was centrifuged for 15 min at 3000 rpm, and the supernatant was transferred to a 5-mL vial. The precipitate was extracted twice with 2 mL of acetone. The extracts were pooled and brought to near dryness under a nitrogen stream. The dried residue was reconstituted in 1 mL of a 50:50 (v/v) water–methanol mixture. Sample extract aliquots were filtered through 0.1-μm syringe filters and 5-μL aliquots of the filtered extracts were introduced into either a reversed-phase LC, ESI-MS, or ESI-MS-MS system for HMTBA determination.
HMTBA Quantification
HPLC Parameters
Separation of HMTBA from coextractants present in the samples was achieved with a 25 cm × 4.6 mm, 5-μm dp C18 column. The mobile phase consisted of water and acetonitrile with 0.1% trifluoroacetic acid. Both the isocratic and the gradient elution were evaluated. The isocratic elution was carried out with 20:80 (v/v) water–acetonitrile with 0.1% trifluoroacetic acid. In gradient elution, the mobile phase composition was changed from 100% water (0.1% trifluoroacetic acid) to 70% water and 30% acetonitrile (0.1% trifluoroacetic acid) in 15 min. The mobile-phase flow rate during both the isocratic elution and gradient elution was maintained at 1 mL/min. The separated components were detected with a diode-array detector over the 190–350 nm wavelength range.
ESI-MS Parameters
The mass spectrometer was operated with an ESI source in the negative ion mode. Ions produced in the ESI source were monitored both in the scan and selected ion monitoring (SIM). During the scan mode, the mass range was set between 100 and 150 amu. During SIM only one ion, m/z 149, was monitored. The ion source temperature was set at 50 °C, the needle voltage was maintained -3500 V, the ion capillary shield voltage was set at -600 V, the capillary voltage was set -80 V, and the detector voltage was set at +1600 V. Air was used as the nebulizing gas, and its pressure was set at 50 psi. Nitrogen was used as the drying gas, and its pressure was set at 18 psi; the drying gas temperature was set at 150 °C. A 50:50 water–methanol mixture was used as the carrier solvent in the direct infusion pump, and its flow rate was set at 100 μL/min.
ESI-MS-MS Parameters
The deprotonated HMTBA ion at m/z 149 was selected as the precursor ion in Q1; the ion energy was set at 15 eV. Argon was used as the collision gas in Q2, and collision-induced dissociation (CID) fragment ions were monitored with Q3 over the m/z 50–149 range. The principal fragment ion was found to be m/z 101. In a later experiment, Q3 was set in SIM at m/z 101 and m/z 149.
HMTBA Quantification in Bovine Serum and Sea Water Samples
Two sets of calibration standards were prepared by fortifying aliquots of bovine serum (free of HMTBA) and simulated sea water with an HMTBA stock solution in methanol. The simulated sea water was prepared by dissolving 4.0% sodium chloride in deionized water. The HMTBA concentration in the calibration standards for HPLC ranged from 1.0 to 100.0 μg/mL, while the concentration range for ESI-MS and ESI-MS-MS was 0.001–10 μg/mL. The HMTBA in the fortified aliquots was extracted with the extraction procedure was outlined in a previous section.
Limit of Detection and Limit of Quantification
The limit of detection (LOD) and limit of quantification (LOQ) in the present context refer to the lowest concentration of HMTBA in bovine serum and 4% salt solution that can be detected and unambiguously quantified. The LOD was a concentration that yielded a signal-to-noise ratio (S/N) of 5 and the LOQ was a concentration that yielded a S/N of 10. Both parameters were evaluated by monitoring signal from six replicate aliquots. The precision was assessed in terms of percent relative standard deviation (% RSD) for the response factors.

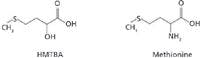

Figure 1: Chemical structures of HMTBA and methionine.
Linearity, Accuracy, and Recovery
The linearity of the reversed-phase LC, ESI-MS, and ESI-MS-MS methods was determined with five-point calibration curves, and the linearity was evaluated in terms of correlation coefficient (R2) values.

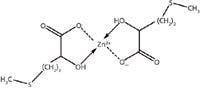

Figure 2: Molecular structure of zinc-HMTBA chelate (Zn[HMTBA]2).
The accuracy of the methods is determined with bovine serum and 4% salt solution samples fortified with known concentrations of HMTBA. Accuracy of the methods was also assessed through quantification of HMTBA in "blind" check samples that were obtained from Novus International.

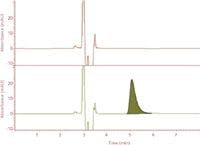
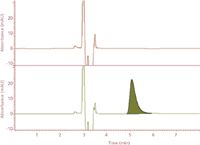
Figure 3: Chromatograms of unfortified simulated sea water (top) and a simulated sea water sample fortified with HMTBA (bottom).
Results and Discussion
Sample Preparation and HMTBA quantification
Isocratic and Gradient Elution Reversed-Phase LC
Liquid–liquid and solid–liquid extraction were evaluated and optimized. The aim of optimization was to minimize interference, ion suppression, and extraction period and maximize analyte recovery. The liquid–liquid extraction involved addition of an organic solvent directly to the bovine serum or simulated sea water samples. For solid–liquid extraction, the serum and simulated sea water samples were first lyophilized and the solid residue was then extracted with an organic solvent. The extracts were introduced into reversed-phase LC, ESI-MS, and ESI-MS-MS systems for HMTBA quantification.

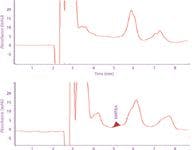
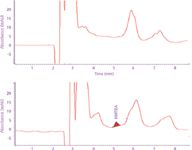
Figure 4: Chromatograms of unfortified (top trace) bovine serum extract and fortified bovine serum extract (bottom trace) obtained with isocratic elution.
Quantification of HMTBA in sea water and bovine serum extracts was first carried out on the reversed-phase LC system, where HMTBA eluted from the C18 column was quantified by monitoring absorbance at 210 nm. A rapid isocratic elution with 50:50 (v/v) water–methanol mixture as the mobile phase with a flow rate of 1 mL/min was first evaluated, and the elution time for HMTBA under these conditions was found to be 5.1 ± 0.02 min. Figure 3 shows the chromatographic outputs for unfortified simulated sea water sample and simulated sea water sample fortified with HMTBA.

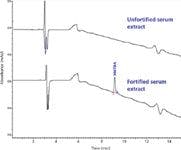
Figure 5: Chromatograms of unfortified bovine serum extract and fortified bovine serum extract obtained with gradient elution.
Figure 4 shows the isocratic chromatographic analyses of the methanol extracts of unfortified bovine serum sample and bovine serum sample fortified with HMTBA. Chromatograms show the presence of peaks that can interfere with HMTBA, making quantification at concentrations below 10 μg/mL very difficult.

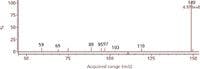

Figure 6: Negative ion ESI-MS spectrum of HMTBA mass scan range m/z 50â150.
The matrix interferences observed in bovine serum samples under isocratic elution method were eliminated with gradient elution using the reversed-phase LC method. The gradient elution parameters were selected to keep retention factor (k') for HMTBA less than five and the total run time of 15 min with complete elimination of potential interfering coeluted compounds. Chromatographic profiles obtained with gradient elution of unfortified bovine serum sample and serum sample fortified with HMTBA at 10 μg/mL are shown in Figure 5. The LOQ for HMTBA in serum sample with methanol denaturation–extraction followed by the gradient elution reversed-phase LC and quantification at 210 nm was found to be 0.5 μg/mL.


Figure 7: Equilibrium equation for HMTBA in sea water.
ESI-MS — Negative Ion Selected Ion Monitoring
Deprotonation of HMTBA results in the pseudomolecular anion m/z 149, which can be readily monitored with ESI-MS operating in the negative ion mode. The negative ion ESI-MS spectrum of HMTBA is shown in Figure 6. The spectrum shows the presence of only one dominant peak at m/z 149. With selected ion monitoring, the LOQ for HMTBA in organic- and salt-free basified water–methanol solutions was found to be 1.0 ng/mL.

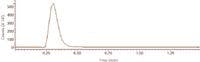
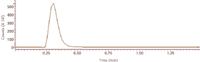
Figure 8: Extracted ion (m/z 149) output for sea water sample fortified with HMTBA, concentration 1 ppm.
However, the presence of salt in the simulated sea water extracts in methanol severely suppressed the anion signal and a discernible signal could not be obtained even at 100-fold higher concentrations. The presence of salt ions in the solution shifts the equilibrium to the left, resulting in a decrease in HMTBA anion concentration. To reduce salt concentration in the extracts, lyophilized residues from the samples were extracted with acetone instead of methanol as outlined in the experimental section. The extracts were reconstituted in basified water–methanol, filtered, and introduced into the ESI-MS system through direct infusion. An extracted ion profile for HMTBA anion at m/z 149 in a simulated sea water sample is shown in Figure 8. The HMTBA concentration in the sample was 1 μg/mL.

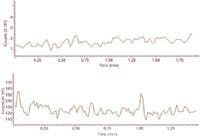
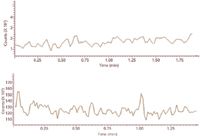
Figure 9: Extracted ion (m/z 149) outputs for unfortified fresh serum sample extract (top) and unfortified aged serum extract (bottom).
The quantification of HMTBA in bovine serum samples through direct infusion of extracts into the ESI-MS system gave inconsistent results. The inconsistencies arose from background signal in some of the serum samples. The background signal in serum samples that were relatively fresh (storage period less than one week) was found to be more than an order of magnitude lower than that of the serum samples that had been stored for periods longer than two weeks. Extracted ion m/z 149 outputs for two unfortified serum samples are shown in Figure 9. The top trace depicts extracted ion output for a fresh serum sample, storage period one week, whereas the lower trace depicts extracted ion output for serum sample that was stored for one month. The background ion counts in the lower trace were 35 times higher than in the upper trace. The higher background counts most likely result from migration of phthalates into the serum samples from the plastic vials during the longer storage time. The background could arise from a weak ion at m/z 149 from phthalic acid.

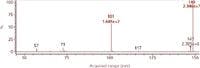
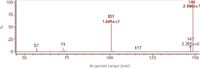
Figure 10: Fragment ion spectrum obtained through CID of HMTBA precursor ion m/z 149.
ESI-MS-MS or Tandem MS Analysis
The use of ESI-MS-MS was evaluated to overcome the matrix interference problems encountered during HMTBA determination with negative ESI-MS in serum samples. In these determinations, Q1 was set to transmit ion m/z 149. The ion was subjected to CID with argon as the collision gas in Q2, the resulting fragment ions were monitored over the range m/z 50–149 with Q3. The tandem mass spectrum spectra obtained is shown in Figure 10.

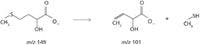

Figure 11: Loss of the neutral fragment methyl mercaptan from the m/z 149 ion.
The predominant fragment ion was observed at m/z 101, mostly resulting from the loss of methyl mercaptan as a neutral fragment.

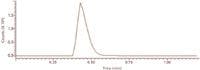
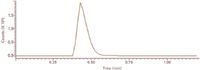
Figure 12: Extracted ion output for fragment ion m/z 101 obtained for serum sample fortified with HMTBA, concentration 50 ppb.
Subsequent HMTBA determinations in fortified bovine serum samples were carried out by direct infusion of serum extracts into the ESI-MS-MS system. HMTBA quantification was done by monitoring the integrated response for ion m/z 101. The response obtained for HMTBA-fortified serum sample is shown in Figure 12; the fortification concentration was 50 ng/mL. The LOQ was found to be 1 ng/mL.

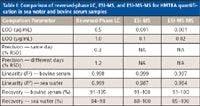
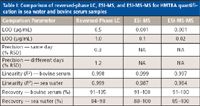
Table I: Comparison of reversed-phase LC, ESI-MS, and ESI-MS-MS for HMTBA quantification in sea water and bovine serum samples
A comparison of the reversed-phase LC, ESI-MS, and ESI-MS-MS approaches for HMTBA quantification in the two matrices is given in Table I. Results show that better sensitivity of the ESI–MS and ESI-MS-MS approaches gave superior results compared to reversed-phase LC for both matrices. HMTBA quantification in sea water samples was readily carried out with direct infusion with the ESI-MS method. However, because of matrix interferences, the ESI-MS-based approach was not satisfactory for the analysis of serum samples.

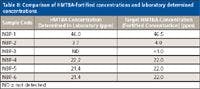
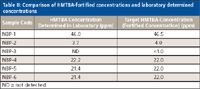
Table II: Comparison of HMTBA-fortified concentrations and laboratory determined concentrations
Validation
The ESI-MS and ESI-MS-MS approaches for the quantification of HMTBA in sea water samples and bovine serum samples, respectively, were validated with blind checks received from Novus International. The samples were analyzed for free HMTBA in the laboratory, and the results were submitted to Novus International. A very good agreement was found between the fortification levels and the laboratory determined concentration. Results for the sea water samples are shown in Table II. Results for the bovine serum samples are shown in Table III.

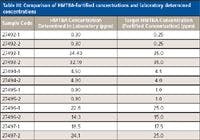
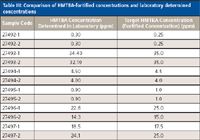
Table III: Comparison of HMTBA-fortified concentrations and laboratory determined concentrations
Conclusions
Simple, rapid, and accurate approaches for quantification of HMTBA in sea water and bovine serum samples were developed. The direct-infusion ESI-MS approach yielded satisfactory results for quantification of HMTBA in sea water samples when the salt concentration in the extracts is minimized. However, the approach suffered from matrix-related interferences during quantification of HMTBA in serum samples. These interferences were readily eliminated in direct-infusion ESI-MS-MS.
Acknowledgments
The partial support for this work was provided by the Center for Environmental Science and Technology (CEST) at Missouri University of Science and Technology and Novus International, Inc., in St. Charles, Missouri.
Balaji Viswanathan is with Pfizer St. Louis in Chesterfield, Missouri. Rachadaporn Seemamahanoop is with Brewer Science in Rolla, Missouri. Shubhen Kapila is with Missouri University of Science and Technology in Rolla, Missouri. Steve Lobert is with Novus International in St. Charles, Missouri. Direct correspondence to: kapilas@mst.edu
References
(1) C.R. Creger, J.R. Couch, and H.L. Ernst, Poult. Sci. 47, 229 (1968).
(2) R. Elkin and P. Hester, Poult. Sci. 62, 2030 (1983).
(3) C.D. Knight and A.F. Giesen, Poult. Sci. 62, 1449 (1983).
(4) B.L. Reid, A. Madrid, and P.M. Maiorino, Poult. Sci. 61, 726 (1982).
(5) P. Waldroup, C. Mabray, J. Blackman, and Z. Johnson, Poult. Sci. 60, 438 (1981).
(6) J.J. Dibner and C.D Knight, J. Nutr. 114, 1716 (1984).
(7) J.J. Dibner, J. Nutr. 113, 2116 (1983).
(8) J. Cermakova, V. Kudrna, J. Illek, K. Blazkova, and J. Haman, Czech J. Anim. Sci. 57, 410 (2012).
(9) B.B. Nobari, A. Taghizadeh, M. Khorvash, S. Alijani, J. Shodja, and F.P. Khajeh-Diza, Ann. Biol. Res. 4(1), 213 (2013).
(10) C.L. Browdy, A.S. Bharadwaj, J.A. Venero, and A.J.P. Nunes, Aquacult. Nutr. 18, 432 (2012).
(11) J.D. Richards, C.A. Atwell, and J.J. Dibner, Poult. Sci. 84, 1397 (2005).
(12) G.E. Lobley, T.J. Wester, J.J. Dibner, and D.S. Parker, J. Dairy. Sci. 89, 3508 (2006).
(13) G.E. Lobley, T.J. Wester, J.J. Dibner, and D.S. Parker, J. Dairy. Sci. 89, 1072 (2006).
(14) Z.H. Chen, G.A. Broderick, N.D. Luchini, B.K Sloan, and E. Devillard, J. Dairy Sci. 94, 1979 (2011).
(15) H. Lapierre, M. Vazquez-Anon, D. Parker, P. Dubreil, G. Holtrop, and G.E. Lobley, J. Dairy Sci. 94(3), 1526 (2011).
(16) R.M. Venegas, M.T. Brufau, A.M. Guerrero-Zamora, Y. Mercier, P.A. Geraert, and R. Ferrer, Food Chem. 141, 1702 (2013)
(17) J.D. Richards, M. Manangi, and J.J. Dibner, Feed Stuffs 82, 10 (2010).
(18) M.K. Manangi, M. Vazquez-Anon, J.D. Richards, S. Carter, R.E. Buresh, and K.D. Christensen, J. Appl. Poult. Res. 21, 881 (2012).
(19) P. Handa, C. Fant, and M. Nyden, Process in Org. Coatings 57, 376 (2006).


Synthesizing Synthetic Oligonucleotides: An Interview with the CEO of Oligo Factory
February 6th 2024LCGC and Spectroscopy Editor Patrick Lavery spoke with Oligo Factory CEO Chris Boggess about the company’s recently attained compliance with Good Manufacturing Practice (GMP) International Conference on Harmonisation of Technical Requirements for Registration of Pharmaceuticals for Human Use (ICH) Expert Working Group (Q7) guidance and its distinction from Research Use Only (RUO) and International Organization for Standardization (ISO) 13485 designations.


