Entering Raman's Realm
Raman spectroscopy can be used to measure the vibrational spectra of both organic and inorganic materials.


It is now well understood that Raman spectroscopy can provide information that is not available by other analytical means. This fact has sparked interest in the technique, yet many analysts remain uneasy because of their lack of knowledge or experience. As a result of instrument developments over the last 20 years, however, recording the spectra is not the challenge that it used to be. But the very property that makes Raman spectroscopy attractive — the wealth of information it provides — can make it appear daunting. This column provides a roadmap that will enable you, the analyst, to start recording and interpreting Raman spectra.
This column will not explain how to record Raman spectra. Instrumentation innovations have simplified that task enormously, and if you want to get started on that, your instrument manufacturer should be able to help you. What I want to spend time on is how to decide what to measure and how to extract the information from the spectra.
One of the first things to appreciate is that Raman spectroscopy is used successfully in a number of areas that do not overlap. The biggest division is between physics on the one hand and the chemical and biological sciences on the other.
To give a few examples, if you are a chemical analyst, you want to identify chemicals in applications as diverse as contaminant analysis, trace evidence analysis, reverse engineering, and structure. For more sophisticated applications, you may be interested in determining orientation, which can be done using polarization analysis of the spectra.
If you are studying metallo-organics, or unsaturated organics with electronic absorbances in the visible range, then the Raman spectra are resonance-enhanced, which means that the laser couples very strongly to the electronic transitions, and the vibrations that are coupled to these electrons are enhanced in the Raman spectra by up to six orders of magnitude. A study of this behavior can elucidate the electronic structure of these compounds.
You may also be a chemical analyst interested in inorganic materials. Raman spectra can easily differentiate polymorphs of the same chemical species, and differentiate similar entities like CaCO3 vs. MgCO3 vs. CaMgCO3.
If you are studying semiconductors or perovskites (superconductors, ferroelectrics, piezoelectrics, and so forth), the Raman spectra are used to assist in determining the physical properties of the materials, which are then used to engineer devices.
In this column installment I will deal with the first and third topics — chemical identification of organic and inorganic species. In pursuing such identification, one learns that vibrations of chemical functional groups can often, but not always, be identified. I will deal with organic materials first, and then inorganic materials.
Raman Spectra of Organic Materials
The number of possible vibrations in a molecule follows from the number of "degrees of freedom." Each atom can move in three orthogonal directions, so the total number of degrees of freedom is equal to 3N, where N is the number of atoms. However, all the atoms of the entire molecule can translate together without changing their interatomic spacing, so three of those degrees of freedom do not produce an interatomic vibration. In addition, the molecule can rotate intact without changing interatomic distances, and this will also eliminate another three degrees of freedom (two, actually, if the molecule is linear). Thus, the total number of possible vibrations is 3N – 6 (or 3N – 5). For organic molecules, that total number of vibrations can be quite large. So the concept of vibrating functional groups goes a long way in simplifying our understanding of spectra.
All of this, of course, is identical for IR spectra. That raises the question: Why bother with Raman, which is probably more expensive and less developed than Fourier-transform infrared (FT-IR), for measuring vibrational spectra? The answer is multifaceted:
1. Because of the polarity of photons, and the fact that IR absorption couples one photon to a molecule (whereas Raman scattering couples two photons to a molecule), there are selection rules that dictate that if a vibration is strong in the IR range, it is weak in the Raman, and vice versa. And if the molecule has a center of symmetry, vibrations cannot be active in both. The result is that you may not see what you need in the IR spectrum.
2. If spatial resolution is important, the Raman can provide spectra from smaller spots than IR, because the spatial resolution is determined in part by the wavelength of the probing light (20–2.5 μm in the IR compared to 1–0.2 μm in the Raman).
3. Often, it is not possible to use IR to examine a material inside packaging because the packaging material is totally absorbing. However, many of these materials are transparent, thereby enabling the recording of Raman spectra inside the package without opening the package. For applications such as forensic analysis, incoming materials identity confirmation, and drug analysis (for example, distinguishing a placebo from a tablet that contains an active pharmaceutical ingredient), such capability is quite important in that it leaves the product intact after the analysis.
4. Along the same lines, it is often possible to measure a depth profile (for example, in a polymer multilayer film) without cross-sectioning the film.
Now you understand more clearly why Raman is important, even if you already do IR spectroscopy.
Getting back to the topic of how to interpret these spectra, let's return to the issue of vibrational functional groups. The issue is to understand, at least on an intuitive level, why this works. What happens in a molecule when one atom begins to move? The coupled pendulum experiment, which is often performed in a basic physics course, makes it easy to understand the answer. In that experiment, two inequivalent pendulums are mounted side-by-side and connected by a weak spring. If one of the pendulums is set in motion, it will transfer some of its energy to the second pendulum through the spring. Eventually, the two pendulums will start swinging together with a frequency reflecting the frequencies of the two isolated pendulums and the coupling spring. The coupled motion is called the normal motion. The same phenomenon occurs in molecules. Think of a methyl group, –CH3. If you try to move one of the protons, you will find that all three move together. There are several ways, actually, that they can move: in a symmetric CH stretch, in which all three protons move together, or in either of two asymmetric CH stretches, in which there is some asynchrony. The frequencies of these three motions are not the same, although the two asymmetric stretches are degenerate (which means they have the same frequency). Another useful observation is that CH stretches from saturated groups occur between 2800 and 3000 cm–1, whereas CH stretches from unsaturated groups are above 3000 cm–1. Typical values are ~3015 cm–1 for an ethylene stretch and ~3060 cm–1 for an aromatic stretch.
What types of chemical functional groups have identifiable vibrational bands? The texts listed in the references (1–4) are a helpful place to start this discussion. We have already described CH motion in the previous paragraph. Because the mass of the proton (bound hydrogen atom) is so much lower than anything it is bound to, its motions appear as easily identifiable bands in the spectra. This is true for OH, NH, CH, PH, SH, SiH, and so forth. Because of hydrogen bonding, the OH and NH bands tend to shift a lot in different molecules. A large shift to lower frequency indicates strong hydrogen bonding, and broadening indicates heterogeneous hydrogen bonding. The OH band or bands occur between 3000 and 3600 cm–1, whereas the NH bands occur nearer to 3300 cm–1. The presence of the SH band near 2500 cm–1 is quite useful in studying proteins where post-translational modifications can change two SH groups to a disulfide linkage (strong band near 500 cm–1). SiH has been observed on silicon surfaces, and can be informative when preparing surfaces for device electronics.
As we move to lower energy in the spectra, the atoms in motion become heavier. There can be triple bonds involving both C and N. The alkyne (CC triple bond) band occurs between 2100 and 2260 cm–1, with its frequency dependent on the substitutions; the frequency can be even lower if the substitution is a heavy element or group. Its CH occurs between 3280 and 3340 cm–1. The nitrile group (CN triple bond) occurs between 2100 and 2280 cm-1, again depending on substitutions.
The >C=O group has a frequency near 1750 cm–1, but is very sensitive to the chemistry of its environment, resulting in shifts as large as 100 cm–1. An electronegative atom will raise its frequency. The frequency can be lowered by hydrogen bonding, unsaturation in the α,β position, and by ring strain. The carboxylic acids usually exist as dimers in which the Raman band occurs between 1640 and 1685 cm–1. An amino acid in a protein is a special case where the >C=O stretch is coupled to the NH band producing a band between 1620 and 1680 cm–1. In fact, the position of this so-called amide I band is related to the configuration of the peptide bond and is used to determine the α-helix, β-sheet, and random coil content of a given protein.
The carbon double bond >C=C< occurs between 1620 and 1680 cm–1, but is lowered in conjugated compounds. The observed frequency can be used to estimate the conjugation length. This is of practical use in studying naturally occurring carotenoids, and in analyzing degradation of polyvinyl chloride (PVC), in which a proton and Cl evolve from every other carbon linkage, resulting in a conjugated polyene. By tuning the laser for resonance Raman conditions, one can estimate the composition in terms of chain length, which is related to the degree of degradation of the polymer.
Then comes everything below 1500 cm–1. CH2 and CH3 deformations are identifiable in the range between 1400 and 1460 cm–1, but most of the rest of the spectrum is a complex mixture of atomic motions. For this reason, this range is called the "fingerprint" part of the spectrum; the spectral pattern reflects a fingerprint enabling the identification of a material, just as a fingerprint enables the identification of a person. In a compound made of a mixture of C, O, and N atoms (with protons added to satisfy valence requirements) the atoms all have similar masses (same row in the periodic table) and force constants (a C–O single bond has a similar energy to a C–N and C–C bond), so the movement of one atom is going to pull its neighbors along, with a cascading effect until "normal modes" are established.
There are, of course, some identifiable bands in the fingerprint region. Earlier, I mentioned the disulfide stretch near 500 cm–1, which is quite strong in the Raman spectrum. (Sulfur is a very polarizable atom, and that polarizability is an important factor in determining Raman intensity.) The C–S linkage also will be strong and identifiable. Other heavier elements also will be reflected in identifiable bands, but I refer you to the texts to identify those that might be important to your work.
Before I leave the topic of organic molecules, I want to mention the effect of the solid state. Small organic molecules can crystallize in the solid state. In fact, they can crystallize in multiple forms, a phenomenon that is of great interest to the pharmaceutical industry. It turns out that the bioavailability of an active pharmaceutical ingredient is quite different in different crystallographic forms as well as in its hydrates and salts. Consequently, a lot of effort is expended in determining the optimal form of the drug to be compounded in a tablet. Just as important, this information is considered intellectual property and is used for patent protection of these materials. It turns out that the spectra of the same molecule in different crystalline forms and complexed in different salts or hydrates are different. Raman spectra can be used to determine and quantify which forms are present, and this can be done on the microscopic scale. So, suppose that you are concerned about hydration or dehydration of a compound. You can follow that phenomenon spectrally, in real time, on a Raman microscope. You might even see a particle change as the hydration front moves. And if very low frequency shifts are required to observe such phenomena, new ultralow-frequency (ULF) filters are now available for benchtop units.
Raman Spectra of Inorganic Materials
Inorganic materials in the crystalline form may sometimes be described as molecular crystals, which means that there is a recognizable molecule in the crystallographic unit cell. In that case, Raman spectra can differentiate polymorphs, just as we discussed earlier for active pharmaceutical ingredients. One well-known example is CaCO3, which can occur in the calcite and aragonite forms, and is clearly distinguishable. It is interesting to note, however, that the strongest band, the CO3 symmetric stretch, is nearly identical in the two spectra, but bands in the lower frequency regime reflect the crystallographic phase. Another similar material, dolomite, is an analog of calcite, but in it, every other Ca atom is replaced by a Mg atom. It too can be differentiated, but in this case, the symmetric CO3 stretch also is affected by the difference. Figure 1 shows spectra of these compounds as an illustrative example. Note that it is unimportant to fully explain why the spectra are different if your goal is to identify the materials.

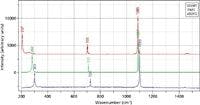
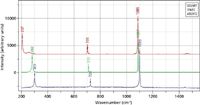
Figure 1: Raman spectra of aragonite (CaCO3, top), calcite (CaCO3, middle), and dolomite (CaMgCO3, bottom).
Another class of spectra consists of materials that do not have an identifiable molecule in the crystallographic unit cell. There are many metal oxides that fall into this category, such as TiO2 and ZrO2. Figure 2 shows spectra of two forms of TiO2 that are used in many industrial applications.

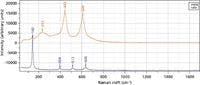
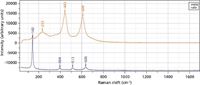
Figure 2: Raman spectra of rutile (top) and anatase (bottom), two phases of TiO2.
If you want to get into this field, you need access to spectra, unless you want to develop your own database. A good place to start is S.D. Ross's Inorganic Infrared and Raman Spectra, published by McGraw Hill in 1972. However, the last time I checked, this book was out of print, so you may have difficulty tracking down a copy. For the MOx materials, there is a good compilation by Griffiths, but this goes back to 1970, and I know of a few errors in the numbers. But there is a solution: the Raman and X-ray diffraction mineralogy database of Professor George Rossman at the California Institute of Technology. This database is available at www.rruff.info, from which you can download software that will enable you to search your own spectra.
Finally, I have to mention materials studied by physicists. This is a topic that will have to be treated in a future column. But if you want to get started, I can point you to two references. Scattering of Light by Crystals by William Hayes and Rodney Loudon was published by Wiley Interscience in 1978. Here we go again! But in this case there is a good contemporary reference. Phonons in Nanostructures by Michael Stroscio and Mitra Dutta was published by Cambridge University Press in 2001 and includes discussions of quantum confinement, which is definitely a hot topic today.
Concluding Remarks
I am sure that I have not condensed into 2700 words a complete introduction to Raman spectroscopy. My goal was to enable you to define what you want to do and help you understand how to get started. There is a learning curve involved, but the tools are available to enable you to start using this growing technology.
If any of you are aware of good references that I have not cited, please feel free to contact me and get me updated. In addition, I wouldn't mind hearing whether this column, or previous installments, have been useful for you.
Fran Adar is the Worldwide Raman Applications Manager for Horiba Jobin Yvon (Edison, New Jersey). She can be reached by e-mail at fran.adar@horiba.com.


Fran Adar
References
(1) G. Socrates, Infrared and Raman Characteristic Frequencies, 3rd Edition (John Wiley and Sons, Chichester, UK, 2001).
(2) D.W. Mayo, F.A.l. Miller, and R.W. Hannah, Course Notes on the Interpretation of Infrared and Raman Spectra, (Wiley Interscience, 2004).
(3) D. Lin-Vien, N.B. Colthup, W.G. Fateley, and J.G. Grasselli, The Handbook of Infrared and Raman Characteristic Frequencies of Organic Molecules, (Academic Press, New York, 1991).
(4) J.C. Merlin, Pure Appl. Chem. 57(5), 785–792 (1985).
(5) W.P. Griffith, J. Chem. Soc.(A), 286–291 (1970).


Nanometer-Scale Studies Using Tip Enhanced Raman Spectroscopy
February 8th 2013Volker Deckert, the winner of the 2013 Charles Mann Award, is advancing the use of tip enhanced Raman spectroscopy (TERS) to push the lateral resolution of vibrational spectroscopy well below the Abbe limit, to achieve single-molecule sensitivity. Because the tip can be moved with sub-nanometer precision, structural information with unmatched spatial resolution can be achieved without the need of specific labels.


