Evaluation of Eye Shadow Compounds Using Raman Microspectroscopy
Special Issues
Cosmetic preparations are common consumer products that consist of various organic and inorganic materials. In this paper, a method for the identification and spatial discrimination of the components in eye shadow samples using laser Raman microspectroscopy is described. The use of a multivariate curve resolution (MCR) is utilized during the analysis of the cosmetic preparation mapping data to develop the spatial discrimination information presented within this note.
Cosmetic preparations are common consumer products that consist of various organic and inorganic materials. In this article, a method for the identification and spatial discrimination of the components in eye shadow samples using laser Raman microspectroscopy is described. The use of a multivariate curve resolution (MCR) is used during the analysis of the cosmetic preparation mapping data to develop the spatial discrimination information presented within this article.
Miniaturization of components, reduction in laser costs, and charge-coupled device (CCD) detectors have resulted in Raman spectroscopy being used for the analysis of a wide range of materials in various fields. In addition to research and development, quality control and quality assurance applications have adopted Raman spectroscopy as a primary spectroscopic analysis method. In comparison to infrared (IR) spectroscopy, there are several advantages of Raman analysis, including the noncontact, nondestructive nature, the ease of sampling, and the high spatial resolution that can be obtained (approximately 1 µm) during measurements. An additional (and important) advantage, is that measurements in the low wavenumber range can be easily used to obtain spectral information on inorganic samples. Cosmetic preparations are common consumer products that consist of various organic and inorganic materials. In this article, a method for the identification and spatial discrimination of the components in eye shadow samples using laser Raman microspectroscopy is described. A multivariate curve resolution (MCR) program is used during the analysis of the cosmetic preparation mapping data to develop the spatial discrimination information presented within this article.
Raman spectroscopy provides numerous unique advantages for materials analysis and the technique has greatly expanded into numerous application fields. Our interest in the cosmetic preparations presented in this article is a result of the multicomponent nature of these formulations. Cosmetic materials such as lipstick and eye shadow, among others, provide unique opportunities to demonstrate the capabilities of Raman spectroscopy on samples with a multicomponent matrix and a wide range of possible components, both organic and inorganic.
MCR Analysis
A sample with a multicomponent matrix can be difficult to analyze and provide a color image with spatial distinction between components. There are numerous chemometrics processing algorithms that can be applied to data of this type, including partial least squares (PLS) regression or principal components analysis (PCA). A MCR program can process an array of spectral data and provide an analysis and spectral separation without direct knowledge of the possible components or concentrations. Chemical components are separated by distinct spectral variations and a distribution map developed based on the component segregation. There are numerous methods to provide this capability, but they often require a large amount of user interaction, while the MCR method can analyze the array of spectral data unattended, providing the completed results for review and can, where necessary, be revised for the final selection of included components.
Experimental
Two types of eye shadow (manufactured by company A and company B) were coated onto a metal plate. The eye shadow samples were measured using a JASCO NRS-4100 laser Raman spectrometer to obtain spectral mapping data and develop chemical images for each sample. The individual component data were analyzed and the materials identified using a Raman spectral search database.
The NRS-4100 Raman instrument system used for these experiments included an excitation laser with a 532-nm wavelength and multiple gratings for the spectrometer. A 900-groove/mm grating was used for these experiments, providing a 2-cm-1/pixel spectral resolution with the standard 200-mm spectrograph. A selection of neutral density filters were used to reduce the laser power at the sample and for these experiments, a laser power of 3.2 mW was focused through the 100x objective lens onto the samples. A sampling area of 35 x 35 µm was selected for the sample mapping area and a 1-µm interval was used to collect an array of 1225 individual spectra from the selected sample area.
Results and Discussion
Figures 1a and 1b demonstrate the microscopic visible image of each eye shadow formulation as placed on the metal plate for Raman analysis. Figures 2a and 2b outline the spectra of the main components of each eye shadow (the black spectra are the principal component spectra derived by the MCR method and the red spectra are the match results from the database search). Figures 3a and 3b present the color mapping images for each eye shadow based on the score value of each principal component. The differences in the particle size of the chemical constituents or the color of the two eye shadow formulations cannot be easily visualized in the video images (Figures 1a and 1b).

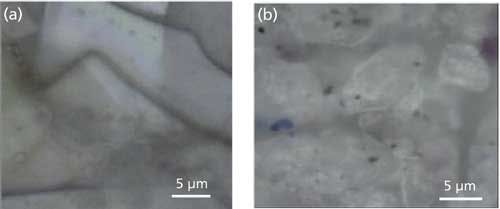

Figure 1: Video micrographs of eye shadow from (a) company A and (b) Company B.
The difference between the two kinds of eye shadows can be easily recognized from the spectra shown in Figures 2a and 2b. The eye shadow formulation manufactured by company A includes a majority of surfactant in addition to the rutile form of TiO2 and pigment. The formulation by company B, however, comprises a high concentration of talc, a surfactant, calcite, the anatase form of TiO2, and a pigment, identified as lapis lazuli. Regarding the pigments, the difference between the two samples is also interesting. It was found that organic compounds are used as pigments for the eye shadow manufactured by company A, which can be observed from the peaks from organic compounds in the 1700â1000 cm-1 region detected in the principal component spectrum. On the other hand, inorganic compounds (mainly lapis lazuli) are used in the eye shadow manufactured by company B. These differences in the spectra appear to demonstrate the component preferences for each manufacturer.

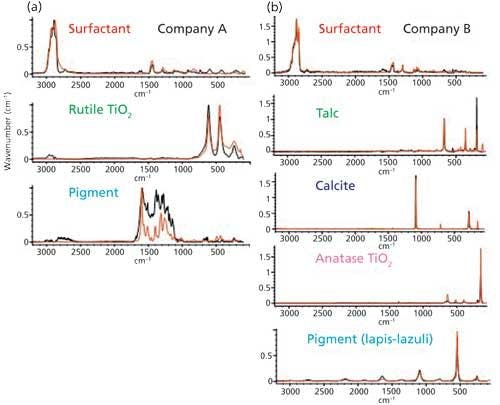
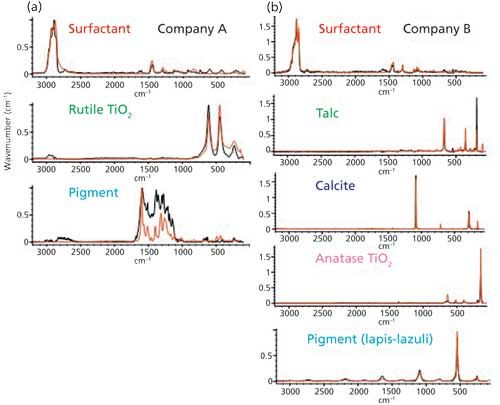
Figure 2: Raman spectra of (a) company A and (b) company B eye shadow chemical components.
Figures 3a and 3b provide color mapping images of the principal components distribution for each eye shadow formulation. The differences in component dispersion can be reviewed by the various colors used to “image” the chemical components in the mapping images.

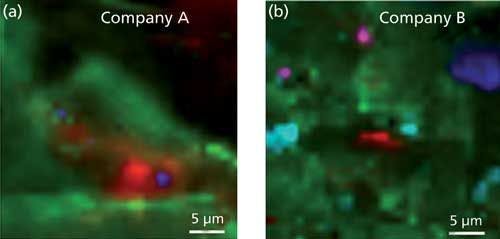

Figure 3: Raman image maps of (a) company A and (b) company B eye shadow chemical components. Company A: red: surfactant; green: rutile TiO2; blue: pigment. Company B: red: surfactant; green: talc; cobalt: calcite; pink: anatase TiO2; aqua: pigment (lapis lazuli).
Conclusions
Raman microspectroscopy easily highlights the composition differences in chemical formulations that cannot be discerned by optical or IR microscopy. And chemometrics, such as MCR, is a powerful tool for the analysis of chemical formulations even if the components and distribution of samples are complex. As an example, the dispersion of inorganic crystals that demonstrate polymorphism can be easily measured by colored mapping images of the spectral peaks. Raman micro-spectroscopy is highly effective for the measurement of composite materials like cosmetics that contain organic and inorganic material dispersed in discrete micrometer-sized locations within the chemical formulation and whose functionality arises from a mixture of organic and inorganic compounds.
Richard A. Larsen is with JASCO Incorporated in Easton, Maryland. Mie Okazaki, Takeo Soejima, Ken-ichi Akao, Kohei Tamura, and Koushi Nagamori are with JASCO Corporation in Tokoyo, Japan. Direct correspondence to: rlarsen@jascoinc.com


Nanometer-Scale Studies Using Tip Enhanced Raman Spectroscopy
February 8th 2013Volker Deckert, the winner of the 2013 Charles Mann Award, is advancing the use of tip enhanced Raman spectroscopy (TERS) to push the lateral resolution of vibrational spectroscopy well below the Abbe limit, to achieve single-molecule sensitivity. Because the tip can be moved with sub-nanometer precision, structural information with unmatched spatial resolution can be achieved without the need of specific labels.


