A Fast Method for Targeted Allergen Screening and Nontargeted Characterization for Personal Care Products
Special Issues
Compounds that are added as fragrances to personal care products (PCPs) can also be allergens or skin irritants for some consumers. Knowing whether these compounds are present in a product is important for both consumers with known allergies and for manufacturers in order to be compliant with various regulations related to allergens. Here, a GC-TOFMS method was developed to screen for and quantify regulated allergens in approximately 5 minutes. This method utilized a short and narrow chromatographic column along with mathematical deconvolution of the TOFMS data to separate the target allergens from each other in the standards and from matrix interference in samples. Calibration equations were compiled for standards from 1 ppb to 1 ppm (on-column) with excellent linearity and correlation coefficients. These were applied to various commercially-available perfume and cologne samples to determine quantitative information for the targeted allergens. The full-mass range data acquisition also provided for non-targeted characterization and comparisons to better understand the aroma profile of each sample. The reported method reduced analysis time for allergen screening while simultaneously increasing the acquired information about the PCP samples.
Compounds that are added as fragrances to personal care products (PCPs) can also be allergens or skin irritants for some consumers. Knowing whether these compounds are present in a product is important for both consumers with known allergies and for manufacturers to be compliant with various regulations related to allergens. Here, a gas chromatography–time-of-flight mass spectrometry (GC–TOF-MS) method was developed to screen for and quantify regulated allergens in approximately 5 min. This method used a short and narrow chromatographic column along with mathematical deconvolution of the TOF-MS data to separate the target allergens from each other in the standards and from matrix interference in samples. Calibration equations were compiled for standards from 1 ppb to 1 ppm (on-column) with excellent linearity and correlation coefficients. These were applied to various commercially available perfume and cologne samples to determine quantitative information for the targeted allergens. The full mass range data acquisition also provided for nontargeted characterization and comparisons to better understand the aroma profile of each sample. The reported method reduced analysis time for allergen screening while simultaneously increasing the acquired information about the PCP samples.
Perfumes and other personal care products (PCPs) often contain fragrance compounds that can be contact allergens for some consumers. Various regulations relating to these analytes exist, including the European Cosmetics Directive that requires certain allergen compounds to be listed on packaging materials when present above specified levels (10 ppm for a leave-on product like perfume and 100 ppm for a rinse-off product like shampoo) (1). Gas chromatography (GC) is an excellent tool for separating these target allergens and it is often paired with mass spectrometry (MS) for detection. Separation times of 20–50 min are common to achieve this type of screening and selected ion monitoring (SIM) detection is often recommended in many of these methods (2). This type of analytical method can be sufficient for routine screening, but there are drawbacks associated with targeted acquisition. Collecting full mass range data instead, with time-of-flight MS (TOF-MS), can alleviate some of these concerns by providing complete nontargeted data on the sample even when the focus is specific target analysis. This type of data gives the ability to handle unanticipated coelutions that may interfere with the targets while also providing the ability to retrospectively analyze data for analytes that were unknown at the time of data acquisition that may also be of interest and become new targets. Along with more complete information from the full mass range data, deconvolution also becomes possible for providing additional mathematical separation to chromatographic coelutions. The ability to accommodate some chromatographic coelution allows for faster separations and higher throughput. A 5-min GC–TOF-MS method was developed and used here to collect and compile calibration data for 25 regulated analytes. These calibrations were applied to a variety of commercially available perfume and cologne samples to demonstrate rapid product screening. In addition to facilitating the targeted analysis, numerous other nontargeted analytes were determined, with deconvolution providing key benefits.
Experimental
A set of calibration standards was prepared from a fragrance allergen standard (Restek) spanning concentrations of 100 ppb to 100 ppm. The standards were analyzed using LECO’s Pegasus BT with instrument conditions listed in Table I. Eight perfume and cologne samples were diluted 10x, to fit within the calibration range, and analyzed with the same conditions. All standards and samples were analyzed with the conditions listed in Table I.


Results and Discussion
A rapid GC–TOF-MS method was developed to separate and detect a target set of contact allergens in approximately 5 min. This method used a short (10 m) and narrow (0.18 mm) Rxi-17Sil MS column, a fast temperature ramp (40 °C/min), and ChromaTOF software for automated deconvolution to chromatographically and mathematically separate the target analytes in the standard. Automated peak finding identified all of the target analytes, indicated with vertical line peak markers in Figure 1, with an average similarity of 920.

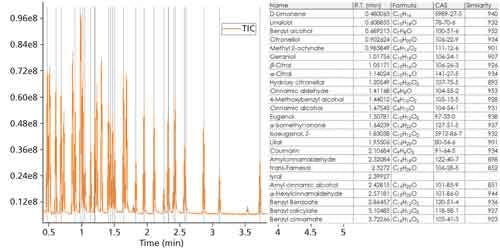
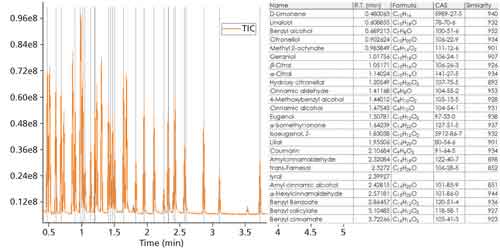
Figure 1: GC–TOF-MS data were collected for an allergen standard, containing 25 regulated analytes. Allergens are indicated in the standard with vertical line peak markers. Peak metric information is provided in the associated table.
CLICK TO ENLARGE
A set of calibration standards from 100 ppb to 100 ppm was prepared and subsequently analyzed (with a 100:1 split) by GC–TOF-MS. Calibration equations were determined for each target allergen with automated data processing, resulting in a set of equations with an average r value for all standards of 0.99918 ± 0.00098. Representative peak profile, mass spectral information, and calibration data for three of the target allergens are compiled in Figure 2. The calibration range extended below the required reporting threshold (10 ppm) accommodating dilutions, if needed.

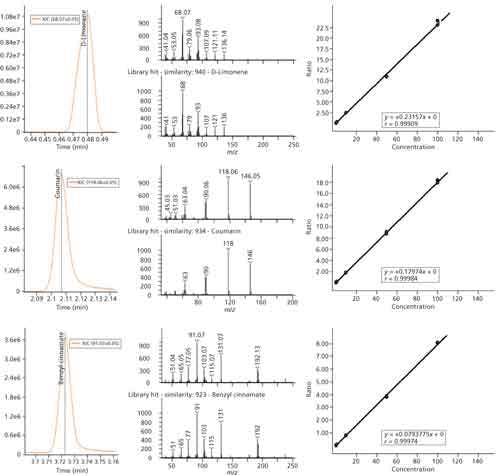
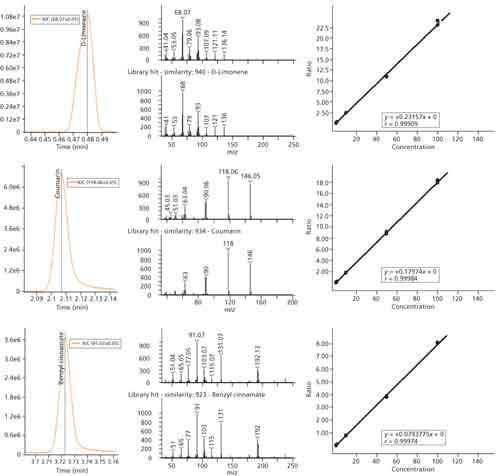
Figure 2: The peak profile, mass spectral information, and calibration data for three targets are compiled as representative examples.
CLICK FIGURE TO ENLARGE
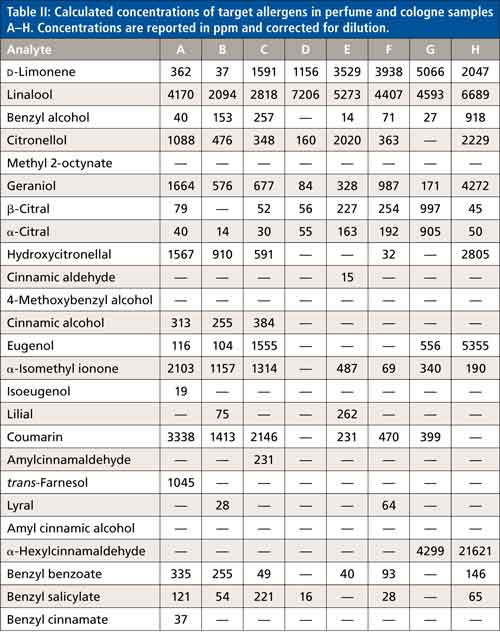
These calibrations were applied with automated processing to eight commercially available perfume and cologne samples, with results compiled in Figure 3. The total ion chromatograms (TICs) for each sample are shown with vertical line peak markers displayed for any target allergen present above the 10 ppm reporting threshold. The concentrations are also tabulated in Table II, with concentration values reported in parts per million and corrected for dilution. This method provided rapid screening for the regulated target allergens to quickly determine what analytes would need to be listed on the packaging material. When packaging labels were available, there was good agreement between the reported analytes and those observed with this method.

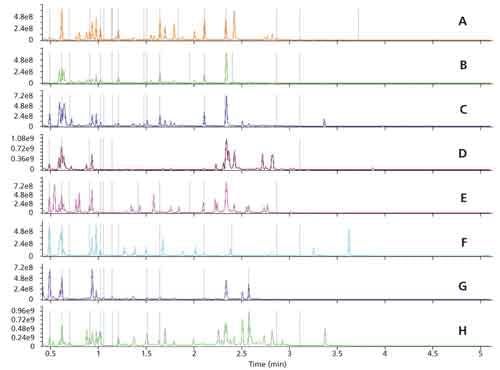

Figure 3: The calibration equations were applied to eight perfume and cologne samples using automated data processing. Vertical line peak markers are displayed on target allergens, which are above the 10 ppm reporting threshold.


In addition to the target allergens, the data also provide characterization information for nontargeted analytes from the same injection. These can be observed in Figure 3, where there are many peaks without peak markers. Automated data processing provided peak area information and tentative identifications of each peak through library searching of the spectral data. These can be explored to uncover more information about the samples and the data can be retrospectively analyzed if new analytes of interest are determined. Several examples of nontargeted analytes present in the perfume and cologne samples are shown in Figure 4. In each of these cases, a nontarget analyte from the matrix was coeluted with one of the target allergens. Deconvolution provided information on the target analyte free from the matrix interference and also provided information on the nontarget analyte that aids in general characterization and better understanding of the samples. The nontarget analytes were tentatively identified through spectral matching to library databases. In perfume A, the target analyte eugenol with spicy odor properties was mathematically separated from citronellyl butyrate with floral odor properties. In perfume E, the target analyte coumarin with tonka odor properties was mathematically separated from cedrol with woody odor properties. And, in perfume F, the target analyte citronellol with floral odor properties was mathematically separated from α-terpineol with piney odor properties. There are hundreds of additional analytes observed within the data that can provide a better understanding of the aroma properties of the perfumes and colognes on top of the required allergen screening.

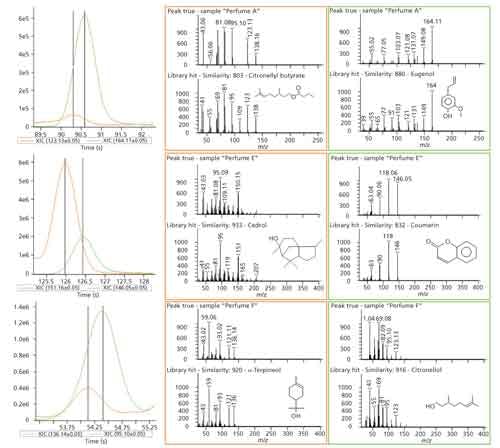
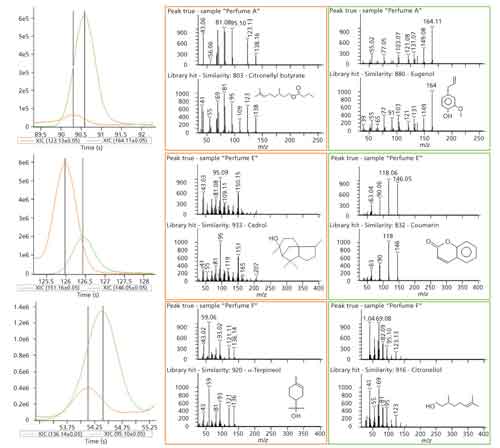
Figure 4: Three examples of nontargeted characterization that were provided through automated data processing and deconvolution.
CLICK FIGURE TO ENLARGE
Conclusion
This study demonstrates the benefits of GC–TOF-MS to provide targeted screening for contact allergens and nontargeted characterization of general aroma analytes within complex perfume and cologne samples. Calibration data for regulated analytes were determined and applied to eight different perfume and cologne samples. The GC–TOF-MS method provides a rapid quantitative screening analysis with run times of roughly 5 min. Numerous other nontargeted analytes were also observed in the same injection with deconvolution providing key benefits in instances of chromatographic coelution.
References
- The Scientific Committee of Cosmetic Products and Non-Food Products Intended for Consumers, Fragrance Allergy in Consumers (1999).
- A. Chaintreau, D. Joulain, C. Marin, C.O. Schmidt, and M. Vey, J. Agric. Food Chem.51, 6398–6403 (2003).
Elizabeth Humston-Fulmer is with LECO Corporation in Saint Joseph, Michigan. Direct correspondence to: info@leco.com


Synthesizing Synthetic Oligonucleotides: An Interview with the CEO of Oligo Factory
February 6th 2024LCGC and Spectroscopy Editor Patrick Lavery spoke with Oligo Factory CEO Chris Boggess about the company’s recently attained compliance with Good Manufacturing Practice (GMP) International Conference on Harmonisation of Technical Requirements for Registration of Pharmaceuticals for Human Use (ICH) Expert Working Group (Q7) guidance and its distinction from Research Use Only (RUO) and International Organization for Standardization (ISO) 13485 designations.


