FT-IR and Raman: A Synergism, Not Competing Technologies
Columnist Fran Adar discusses applications for Raman and FT-IR spectroscopy.


Vibrational spectra are of interest to analytical and materials scientists because of their potential to yield nondestructively detailed information on materials. This is because the vibrations quite sensitively reflect interatomic bonding. There are several spectroscopies in which vibrational transitions can be detected. The simplest is infrared (IR) absorption. In this case, when a molecule is irradiated with photons whose energy corresponds to the energy of one of its vibrations (which is in the mid- and far-IR part of the electromagnetic spectrum), those photons will be absorbed. If an instrument is built to monitor the transmission of IR light, there will be a dip in the transmission at the energy corresponding to the vibration. In the near IR (NIR) region, there are similar processes that correspond to absorption of overtones (multiples of a vibration) and combinations of vibrations. Absorption in the MIR detects vibrational "fundamentals" and some higher-order transitions, whereas the NIR detects second or higher-order processes in direct absorption. It is also possible to "scatter" off of a molecule. When a photon in the visible part of the electromagnetic spectrum is used to initiate a scattering event, it is called Raman scattering. By its nature, Raman is a second-order process — there are two photons, the incident laser photon, and the scattered photon. Second-order processes in general have much lower quantum yields than first-order processes. So even though it is easier to build spectrographs and detectors for the visible part of the spectrum, IR spectroscopy developed more rapidly during the middle and latter part of the last century. As a consequence of the physical origin of IR absorption and Raman scattering, the spectra appear quite different. What is intense in the IR is weak in the Raman, and vice versa, and when there is a center of symmetry in the molecule or crystal under study, no vibrational band will appear in both spectra. Consequently, the ability to detect both types of spectra produces a lot of information on a sample, with the potential to be more informative than either by itself, or, indeed, the sum of the two. As an example, we will discuss here some of what can be done with two simple polymers — polyethylene (PE) and polypropylene (PP).


Fran Adar
In polyatomic systems, each pair of bonded atoms has three degrees of freedom to vibrate, but the atomic motion of one pair of atoms is mixed together with adjacent atoms. Not only are there stretches, but there are bending, rocking, and torsional motions as well. If you can imagine a stretching motion between two atoms in a complicated system, you can see quickly that those two atoms will pull and twist other surrounding atoms. The final result is that there are "normal modes" of motion; that is, the entire polyatomic system will exhibit vibrations where many atoms will move in concert, but each normal mode will be independent and will not mix with other normal modes.
If a molecule is systematically modified, for example, by replacing a proton with a methyl group, the vibrations will change. In this case, there will be new methyl group vibrations, but, in addition, the added mass attached to the modified carbon will tug more on that carbon, which will in turn affect its normal vibrations.
Over the years, it has been shown that it is possible to use this type of analysis to characterize regions of spectra. Functional groups such as >C=C<, >C=O<, CH (methine, methylene, methyl), SH, NH, and OH vibrate with frequencies that are well-separated from anything else (and each other) so their bands are easily recognizable in the spectra (1,2). Below 1500 cm–1 is the "fingerprint" region, where the observed vibrations represent mixed motions of multiple atoms tugging at each other.
Raman and IR Spectra of Polyethylene and Polypropylene
In this column, we will survey the spectra of two common, simple polymers. Figure 1 shows the IR and Raman spectra of PE and PP. PE is a polymer with the backbone composed of two carbon atoms per repeat unit, with two protons attached to each carbon. PP is a similar polymer, but with every other carbon atom on the backbone substituted with a methyl group. Depending on how the methyls are substituted, polymers of different "tacticity" can be formed. Isotactic polypropylene (i-PP) has all the methyl groups on the same side of the backbone; syndiotactic has the methyl groups alternating; and atactic PP has the methyls randomized. One can imagine how these different placements can affect the atomic motions in the different forms.

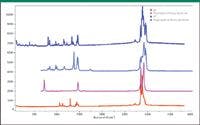
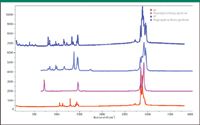
Figure 1: Raman and FT-IR spectra of PE (bottom) and i-PP (top). The FT-IR spectra start at 650 cmâ1, and the Raman spectra start at 100 cmâ1. (Thanks to Pauline Leary of Smiths Detection for the IR spectra of these polymers.)
In addition to effects of chemical conformation and configuration, there are also effects of crystalline packing. Solid PE is highly crystalline; the more common orthorhombic form occurs with two chains in the centrosymmetric unit cell that exist in the all-trans, planar zigzag conformation. However, many industrial polyethylenes are not "pure"; that is, some of the protons are randomly substituted with methyl groups or longer chains in order to engineer-in important physical properties such as strength and impact resistance. As might be imagined, this will interfere with long-range packing, and features of the "amorphous" phase can be seen in the spectra. It is inferred that gauche linkages in the noncrystalline regions can be identified in the vibrational spectra. In PP, tacticity determines the possibilities for crystalline packing. One crystalline form of i-PP forms a 31 helix (three monomeric units in one rotation) in the solid state with four chains in the unit cell. On the other hand, syndiotactic polypropylene (s-PP) can exist in either a helical or planar zigzag form, with very different spectra. Clearly, the analyst needs to be aware of all the potential influences on the spectra of his materials so that he can decouple the influences of tacticity, conformation, and crystallinity, including multiple crystalline phases. Until recently, it would have been overwhelming for him to start using these spectra to their fullest because this information had been scattered throughout the literature. However, a recently published text makes entry into this field quite accessible (3).
So now let's take a look at the spectra of these polymers and see what they can tell us. In the CH region of the IR and Raman spectra of PE (2700–3000 cm–1), there are the two prominent vibrations of the >CH2 methylene group — the asymmetric and symmetric stretches (two protons attached to each of the two C atoms in each repeat unit). However, because PE solidifies with high crystalline content in a centrosymmetric unit cell containing two molecular chains, the motion of the protons will interact and the vibrational energies will split, with bands appearing in either the IR or the Raman spectra. There is an additional complication in that there are interactions between the CH bands and overtones and combinations of the >CH2 deformations (1410–1480 cm–1). So, in this case, without going to the literature for a full analysis of the spectra, it is not possible to assign all of the bands in the spectra (4).
In PP, the pendant –CH3 methyl group will have its own CH stretches. Because isolated asymmetric and symmetric methyl stretches occur near 2870 and 2960 cm–1, it is possible to separately identify the contributions from the methyl and methylene groups in its spectrum. In Figure 2, the arrows identify the extra bands due to the –CH3 group.

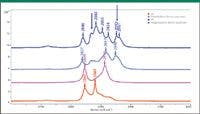
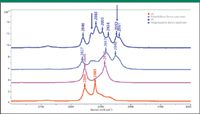
Figure 2: Vibrational spectra in the CH stretching region illustrating additional bands in i-PP assignable to the âCH3 methyl groups.
In the fingerprint region there are C-C stretches, >CH2 and –CH3 deformations, and backbone vibrations as well as rocks and wags and twists. In PE, the backbone vibrational twist occurs near 1300 cm–1 and is observed only in the Raman spectrum. It is sharp in the crystalline form and significantly broader in the amorphous phase. The >C-C< stretch splits into two bands at 1061 and 1127 cm–1 and also appears only in the Raman spectrum. The >CH2 deformation splits into a triplet in the Raman spectrum, again because of the crystalline phase, and two bands in the IR, with little overlap because of the center of symmetry. The IR spectrum also shows a prominent doublet centered at 725 cm–1, which has been assigned to the >CH2 rock (bending motion in a plane perpendicular to the molecular chain), which is again split by intermolecular interactions in the crystal unit cell. This splitting, in fact, has been correlated with the degree of interaction between the chains (3), which reflects the composition of the polymer. The Raman and IR spectra of PE have a weak band near 1375 cm–1 (inset in Figure 3) that is assigned to the umbrella mode of methyl endgroups (in high density PE) or branches (in low density PE), either of which would be expected to be present in very small quantities. This feature can be important in cases where the endgroup is know to control key properties of the material. In contrast, the IR spectrum of PP shows prominent bands at 1360 and 1376 cm–1, as expected due to the presence of the pendant methyl groups in the molecular structure.
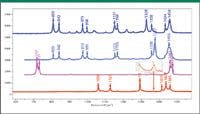
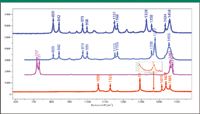
Figure 3: Vibrational spectra of PE (bottom) and PP (top) in the fingerprint region.
Sometimes it is possible to monitor the presence of olefinic groups. In the Raman spectrum, there will be a band near 1650 cm–1 (>C=C<). In the IR, there will be a band between 850 and 1000 cm–1 assignable to an out-of-plane deformation of olefinic hydrogen atoms. In fact, in both the Raman and the IR spectra, it is possible to differentiate between vinyl (–CH=CH2), vinylidene (>C=CH2), and the in-chain (–CH=CH–) group.
In PP, in addition to the backbone C-C stretches, there are also C-C stretches between the backbone C and the pendant methyl group C that mix in with the backbone stretches. Inspection of the spectra in this region (Figure 3) indicates the much higher complexity in this region due to the additional motions and their mixing.
IR Versus Raman Spectroscopy of Polymers
Certainly this short column installment cannot summarize everything that vibrational spectroscopy can be used for in the characterization of polymers. What we have tried to do is show a novice how an examination of the spectra can enable the extraction of relevant information. In general, IR has been used more extensively to study chemical changes (such as oxygenation, surface treatments, and epoxy cure). Attenuated total reflection (ATR) sampling has been found to be especially useful. While Raman sampling also can be done using an ATR geometry (5), it has not yet been fully exploited. Raman has been found to be useful to follow addition reaction polymerization by monitoring the intensity of the >C=C< band near 1650 cm–1. It is also the technique of choice for studying graphitic species and strain. Graphitic species may be found in polymer composites, in the form of graphite fibers or even carbon nanotubes. Strain can be frozen into polymers because of shape, interface with included fibers, or extrusion. In total, it is seen that vibrational spectroscopy can answer many questions regarding the physical and chemical state of polymers. It will be interesting to examine the vibrational spectra of other classes of material in the future.
Fran Adar is the Worldwide Raman Applications Manager for Horiba Jobin Yvon (Edison, NJ). She can be reached by email at: fran.adar@horiba.com
References
(1) G. Socrates, Infrared and Raman Characteristic Group Frequencies 3rd Edition (John Wiley and Sons, Chichester 2001).
(2) D.W. Mayo, F.A. Miller, and R.W. Hannah, Course Notes on the Interpretation of Infrared and Raman Spectra (Wiley-Interscience, Hoboken, 2004).
(3) Vibrational Spectroscopy of Polymers: Principles and Practice, N.J. Everall, J.M. Chalmers, and P.R. Griffiths, Eds. (Wiley, Chichester, 2007).
(4) R.G. Snyder, S.L. Hsu, and S. Krimm, Spectrochim. Acta Part A 34, 395 (1977).
(5) C.G. Zimba, V.M. Hallmark, S. Turrell, J.D. Swalen, and J.F. Rabolt, J. Phys. Chem. 94, 939–943 (1990).


Nanometer-Scale Studies Using Tip Enhanced Raman Spectroscopy
February 8th 2013Volker Deckert, the winner of the 2013 Charles Mann Award, is advancing the use of tip enhanced Raman spectroscopy (TERS) to push the lateral resolution of vibrational spectroscopy well below the Abbe limit, to achieve single-molecule sensitivity. Because the tip can be moved with sub-nanometer precision, structural information with unmatched spatial resolution can be achieved without the need of specific labels.


