How to Properly Compare Spectra, and Determining Alkane Chain Length From Infrared Spectra
Identity testing is used in the pharmaceutical, food, and dietary supplement industries (amongst others) to ensure raw materials and final products have the correct chemical composition by answering the spectral question: Are these two samples the same? The first part of this installment instructs readers on the correct way to perform identity testing. The interpretation portion of the installment wraps up our discussion of straight chain alkanes by discussing how to determine chain length from infrared spectra. We also go over the answer to the problem from the last installment.
Page 40–45
When comparing spectra to ensure product quality and safety, one must determine if two spectra are the same. In part one, we show you how. In part two, we conclude our discussion of the spectra of straight-chain alkanes by answering the following question: Can infrared spectra be used to determine alkane chain length?
Now that this column is fully up to speed, each installment will consist of the answer to the most recent problem spectrum, a furthering of our discussion on interpretation theory, introduction to the spectra of one or more functional groups, and the posing of the next spectral interpretation problem. In this fourth installment, the theory section discusses how to properly compare spectra to each other. In a process called
identity testing, spectral comparisons are used to ensure product quality and safety, particularly in the pharmaceutical, dietary supplement, and cosmetic industries. The interpretation section concludes our discussion of the spectra of straight-chain alkanes by answering the following question: Can infrared spectra be used to determine alkane chain length?
Solution to Last Column’s Problem Spectrum
Going forward, each problem spectrum will have peaks labeled on the spectrum, a description of the state of the sample, and the sampling technique used because these things affect spectral appearance. Each problem will also include a table listing the peaks labeled for easier interpreting. Be aware, however, that inclusion of a peak in this table does not necessarily mean that peak will be useful in solving the problem.
The problem from the July 2015 installment (1) is seen in Figure 1.

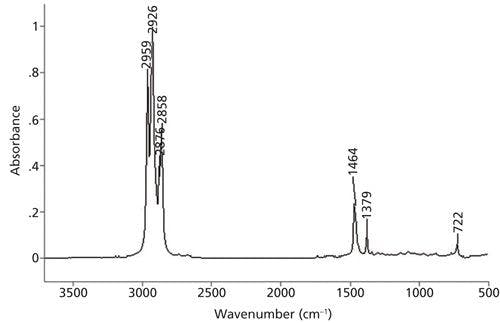

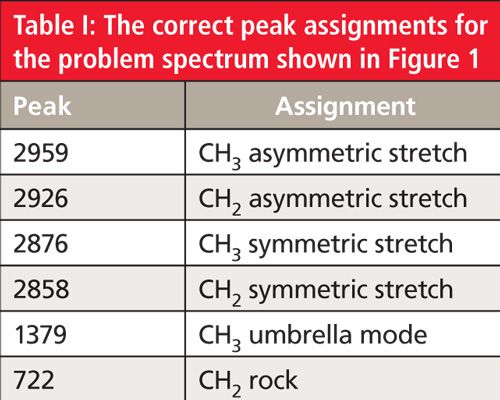
I read spectra from left to right like reading a sentence in a book. The first features encountered in Figure 1 are a set of four peaks between 3000 and 2850 cm-1. As stated in a previous column (2), these are C-H stretching peaks, and the presence of four peaks in this region means there are both methyl (CH3) and methylene (CH2) groups present in the sample (2). In this spectrum, the methyl group asymmetric and symmetric stretches fall at 2959 and 2876 cm-1, and the asymmetric and symmetric CH2 stretching peaks are seen at 2926 and 2858 cm-1.
In addition to C-H stretching peaks, methyl groups exhibit what is called an umbrella mode C-H bend at 1375 ±10 cm-1 (2,3). This peak is clearly seen in Figure 1 at 1379 cm-1 and, along with the two CH3 stretching peaks, confirms the presence of methyl groups in this sample. Methylene groups have a CH2 rocking vibration that falls at 720 ± 10 cm-1 but only if there are alkyl chains present with four or more CH2 groups in a row. Since the problem spectrum clearly has a peak at 722 cm-1 this means there are alkyl chains present with at least four methylenes in a row.
The only major peak left unassigned is at 1464 cm-1. Recall that both methyl and methylene groups have C-H bending vibrations near 1460 cm-1, and that these two peaks often overlap to form one peak (2). That is what has happened in Figure 1. Since this peak has multiple meanings it should be ignored.
We know that the sample contains methyl groups, methylene groups, and chains with at least four CH2 peaks in a row. In theory, at this point in the interpretation process you could use the IR spectrum to more definitively determine the alkyl chain length-except we haven’t covered that yet (this discussion appears later in this column). Despite this, in any situation where you have reached a dead end during an interpretation you can compare the unknown spectrum to known reference spectra. The spectrum of pure hexane has appeared in the last two installments (1,2). Comparison of its spectrum to the problem spectrum shows that the two are similar but not identical. Hexane has exactly four methylenes in a row, and hence is the shortest alkane to exhibit the CH2 rocking peak. Since the problem spectrum also has a CH2 rocking peak, and it is not hexane, its alkyl chain must be longer than that of hexane’s. But given the similarities between the two spectra the answer must be an alkane slightly longer than hexane, perhaps with seven, eight, or nine carbons in it. At this point it would be easy enough to confirm the answer by looking up reference spectra of heptane, octane, and nonane, or performing a library search. The correct answer is octane, whose chemical structure is shown in Figure 2, and whose correct peak assignments are listed in Table I.


Spectral Comparisons and Identity Testing
One of the questions that IR spectroscopy can be used to answer is: Are these two samples the same? This can be done by taking the spectrum of an unknown and comparing it to a known or reference spectrum. This process takes advantage of IR spectroscopy’s powerful fingerprinting capabilities.
For anything that goes onto or into a human being, properly identifying the chemicals that make up these products is an important part of ensuring the product’s quality and safety. Thus, in the pharmaceutical, food, cosmetic, and nutraceutical industries IR spectra of incoming raw materials are compared to references to confirm the identity of these materials. In these industries, this spectral comparison process is called identity testing, and the importance of performing these tests properly in these industries cannot be overestimated. Going forward I will use the terms identity testing and spectral comparison interchangeably.
An important thing to do when performing spectral comparisons is to control your variables. The only way to draw chemically legitimate conclusions from an identity test is to make sure the sample and reference are run under identical experimental conditions, so that any differences observed can be attributed to the samples and not a change in the experiment.
It is vital that these four things be controlled when performing a spectral comparison: scanning parameters, sample preparation technique, the FT-IR used, and the FT-IR operator. These four variables are discussed in more detail below.
Scanning Parameters
The scanning parameters that should be reproduced when comparing spectra include the number of scans, instrumental resolution, and apodization function. All of these parameters effect what a spectrum looks like, so they need to be controlled. The effect of instrumental resolution on spectral appearance is particularly pronounced as can be seen in Figure 3.

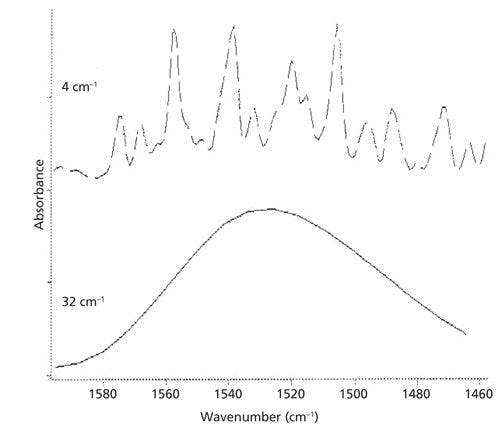

The top of Figure 3 shows a portion of the IR spectrum of water vapor measured at 4 cm-1 instrumental resolution. Note the series of well-resolved peaks. The bottom of the figure shows the same portion of the IR spectrum of water vapor but measured at 32 cm-1 instrumental resolution. This spectrum is a big fat blob with no resolved peaks. If you didn’t know any better you would think these are spectra of different materials when in fact they are spectra of the same thing. The large impact instrumental resolution has on spectral appearance is why it is so vital to always control the instrumental resolution when comparing spectra.
Sample Preparation Technique
A second important parameter to control when comparing spectra is the sample preparation technique, because different techniques can cause spectra to look different as seen in Figure 4.

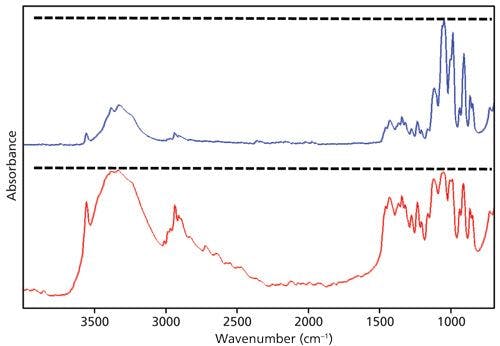

The top spectrum in blue in Figure 4 is of sucrose measured using a diamond attenuated total reflection (ATR) accessory. The dotted line illustrates how the peaks around 1000 and 3200 cm-1 are different sizes. This occurs because in ATR depth of penetration goes down as wavenumber increases (4), resulting in the reduction in peak intensities at higher wavenumber as seen in Figure 4.
The bottom spectrum in red in Figure 4 is also of sucrose, but measured using a non-ATR technique where depth of penetration does not depend on wavenumber. The dotted line here illustrates how the peaks near 1000 and 3200 cm-1 are about the same size. Again, if you didn’t know better you might think these are spectra of different materials, when in fact they are spectra of the same thing. This is why the sample preparation technique should always be controlled when performing spectral comparisons.
The Instrument Used
A third variable to control when performing spectral comparisons is the instrument that the sample and reference spectra are measured on. In theory, if you run the same sample on two different instruments you should get the same spectrum. However, each instrument adds noise and artifacts to sample spectra that are unique to each instrument, despite the best efforts of instrumentation designers and engineers to eliminate this problem. Now, if the two instruments in question are in proper working order this difference should be small, but may be noticeable. To solve this problem, the spectra of the sample and reference materials should be run on the same instrument. However, if you don’t have access to the reference material it’s OK to use a reference spectrum from a spectral library or the literature, but keep in mind that some of the subtle differences observed may be caused by the two different instruments involved.
The Operator
Another variable to control when performing spectral comparisons is the operator. In theory, if you and I take the spectrum of the same sample on the same instrument we should get the same results. However, no two people do things exactly the same way, which is particularly true of manually intensive sample preparation techniques. For example, I have observed much operator variability in the preparation of KBr pellets with concomitant variability in the spectra measured. So, in a perfect world the same person should prepare and measure the spectra of the sample and reference materials. I realize that it might not be practical to have the same person prepare and measure all the reference spectra that a laboratory might need. However, you will probably get better analytical results if you control the user variable. At a minimum, if multiple people are measuring sample and reference spectra in your laboratory, make sure these people have been properly trained and follow a clearly written standard operating procedure.
To summarize, we have discussed four variables to control when performing spectral comparisons: scanning parameters, sample preparation, instrument, and operator. In an ideal world, all of these variables should be controlled for the measurement of a given set of sample and reference spectra. However, time and money may dictate that this is not always possible. In which case, it is an absolute necessity to control the scanning parameters between sample and reference measurements, it is vital to control the sampling technique, it is helpful to control the instrument used, and it is nice to employ the same operator. If you follow these important guidelines for comparing spectra, you will have better success and accuracy in your analytical conclusions.
Determining Alkane Chain Length from Infrared Spectra
In previous columns (1,2) we discovered that methyl (CH3) and methylene (CH2) groups have unique C-H stretching and bending peaks that allow them to be identified and distinguished from each other. We also found that the number of C-H stretching peaks between 3000 and 2850 cm-1 can be used to determine whether a sample contains methyl groups, methylene groups, or both (2).
A distinguishing feature of straight chain alkanes is their chain length, which is determined by the number of methylene groups between the terminal methyl groups. The question then arises: Can you determine alkyl chain length from an IR spectrum? The answer is: it depends. We have already learned that the methylene CH2 rocking peak at 720 ±10 cm-1 only appears if there are alkyl chains present with four or more methylenes in a row (1). So, the presence or absence of this peak provides a crude measure of the general length of alkyl chains in a sample. However, a clearer picture of alkane chain length is needed.
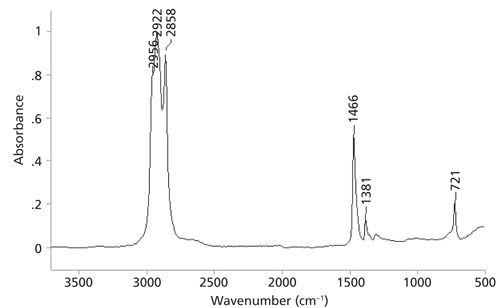
We have already seen the spectrum of the straight-chain alkane hexane (1,2) where the CH2/CH3 ratio is 2, and the methyl and methylene asymmetric stretching peaks are about the same size. For octane the CH2/CH3 ratio is 3 and the methylene asymmetric stretching peak at 2926 cm-1 is bigger than the methyl peak at 2959 cm-1 as illustrated in Figure 1. The spectrum of petroleum jelly, for which the CH2/CH3 ratio is at least 16, is shown in Figure 5.


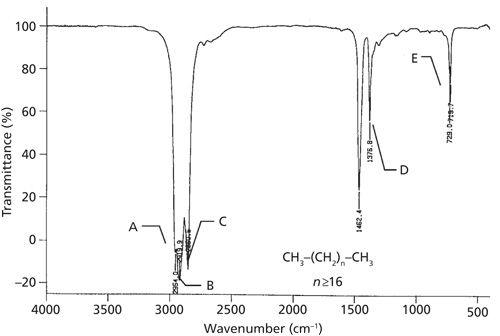
Note here that there are only three C-H stretching peaks between 3000 and 2850 cm-1 instead of the four seen in previous examples. In this sample, the CH2 stretching peaks are so intense that they mask the CH3 symmetric stretching peak. Additionally, note how the methyl asymmetric stretching peak is just a small shoulder at 2954 cm-1. This type of C-H stretching envelope is typical of longer alkanes. Also note in Figure 5 that the CH2 rocking peak is split in two with features at 729 and 720 cm-1. This peak splitting is typical of solid, long-chain alkanes (3) for reasons that will be discussed in a later installment. To summarize then, the presence or absence of the methylene rocking peak at 720 cm-1, whether this peak is split, and the number of C-H stretches between 3000 and 2850 cm-1 can be used to give a general idea of alkyl chain length.
As illustrated by the spectra of hexane, octane, and petroleum jelly, the peak intensities in an IR spectrum are determined, among other things, by the number of a given functional group in a molecule. This means that as the number of CH2 peaks in an alkane goes up, the intensities of the methylene IR peaks will go up as well. The beauty of straight-chain alkanes is that the number of methyl groups is fixed at two, which means the intensity of these peaks can be used as in internal standard. Thus the ratio of CH2/CH3 peak intensities correlates to the methylene to methyl ratio for a sample.
Methods exist in the literature where IR spectra of straight chain alkanes of known length are measured, the intensities of the CH2 and CH3 asymmetric stretches are determined, and this peak intensity ratio is plotted versus CH2/CH3 ratio (4). If done properly a straight line is obtained, correlating IR peak intensities to straight-chain alkane length. Going forward, the appropriate peak intensity ratio in an unknown spectrum can be determined, and the calibration applied to determine CH2/CH3 ratio for a sample.
The problem with this technique is that not all laboratories have access to this calibration, or have the ability to generate it. In the absence of this calibration, the relative heights of the methyl and methylene peaks can be used to give a general idea of overall alkyl chain length as illustrated in Figure 6.

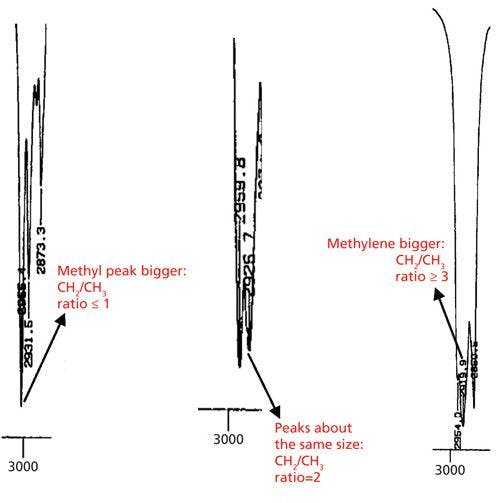
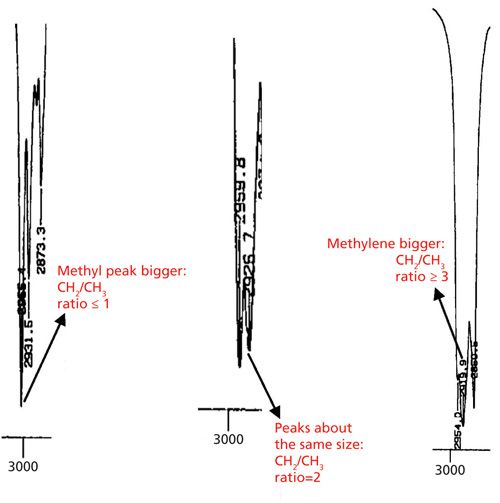
The leftmost spectrum in Figure 6 shows the asymmetric methyl and methylene stretching peaks for an ethyl group. In this case the CH2/CH3 ratio is one and note that the methyl peak is bigger than the methylene peak. The middle spectrum in Figure 6 shows the asymmetric C-H stretches for a sample where the CH2/CH3 ratio is 2 (and is in fact from the spectrum of hexane). Note the two peaks are about the same size. This is typical of samples where the CH2/CH3 ratio is 2. The rightmost spectrum in Figure 6 shows the asymmetric C-H stretches for petroleum jelly, with a minimum CH2/CH3 ratio of 16. Note how the methylene peak is much bigger here.
Please realize that these rules were formulated for pure molecules. In a sample containing a mixture of alkyl chains of different length these rules should hold, but the resulting CH2/CH3 ratio applies to the sample as a whole rather than to a specific molecule. Also, as previously stated (2) there are no absolute rules in IR spectral interpretation, and every rule has an exception, including the CH2/CH3 ratio rules discussed here.


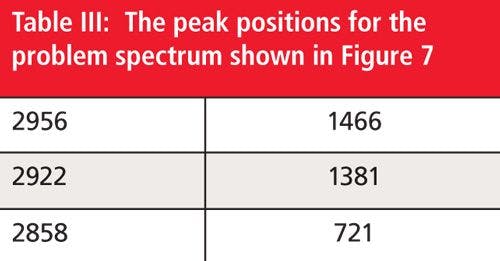
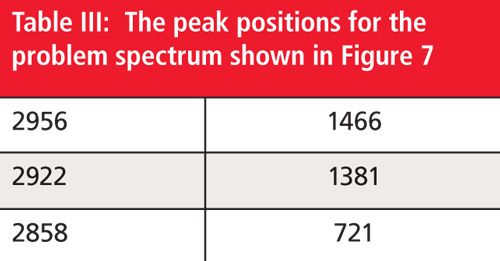
Problem Spectrum Number Two
Using the peak positions shown in Figure 7 and Table III, do your best to assign all the peaks to determine the functional groups present. Then, put the functional groups together to come up with a proposed chemical structure. Feel free to make use of reference spectra already published in these columns. Once again, one reader selected at random from all who submit correct responses will receive a signed copy of my book on IR spectral interpretation. To take the quiz please visit: www.spectroscopyonline.com/ir-spectral-interpretation-workshop-0. Good luck and happy interpreting!
References
(1) B.C. Smith, Spectroscopy30(7), 26–31, 48 (2015).
(2) B.C. Smith, Spectroscopy30(4), 18–23 (2015).
(3) B.C. Smith, Infrared Spectral Interpretation: A Systematic Approach (CRC Press, Boca Raton, Florida, 1999).
(4) B.C. Smith, Fundamentals of Fourier Transform Infrared Spectroscopy 2nd Edition (CRC Press, Boca Raton, Florida, 2011).


Brian C. Smith, PhD, is a Senior Infrared Product Specialist for PerkinElmer, based in San Jose, California. Before joining PerkinElmer, he ran his own FT-IR training and consulting business for more than 20 years, and taught thousands of people around the world how to improve their FT-IR analyses and interpret infrared spectra. Dr. Smith has written three books on infrared spectroscopy: Fundamentals of FTIR and Infrared Spectral Interpretation, both published by CRC Press, and Quantitative Spectroscopy: Theory and Practice published by Academic Press. He has published a number of papers in peer-reviewed journals and is a co-inventor on a patent for an FT-IR method to monitor dust exposure in coal mines.
.


Measurement of Ammonia Leakage by TDLAS in Mid-Infrared Combined with an EMD-SG Filter Method
April 9th 2024In this article, tunable diode laser absorption spectroscopy (TDLAS) is used to measure ammonia leakage, where a new denoising method combining empirical mode decomposition with the Savitzky-Golay smoothing algorithm (EMD-SG) is proposed to improve the signal-to-noise ratio (SNR) of absorbance signals.


