Hybrid Mass Spectrometers
Analyses performed with hybrid mass spectrometers yield large volumes of complex data at high speeds and resolution.


Hybrid automobiles combine both electric- and combustion-based systems to achieve better performance in terms of mileage. How their mileage should be measured has become a matter of some debate, but better performance drives their sales success. Hybrid mass spectrometers combine several mass-analyzer components in a similar quest to achieve higher performance and similarly have been a sales success. Performance for hybrid mass spectrometers can be measured as higher sensitivity (and lower limits of detection), higher resolving power, or even other metrics such as speed of data production or data-set richness. A marketing approach used for hybrid automobiles is that "they drive just like a regular car," touting the seamless transition between propulsion modes. For hybrid mass spectrometers, they too can be "driven" just like regular mass spectrometers, and because of their high throughput, they add millions of mass spectra daily to the database. This column takes a two-stage tour, reviewing first some of the earlier ventures into hybrid mass spectrometers, and second, discussing the new metric of data-set production rate and richness for hybrid mass spectrometers.
Hybrid mass spectrometers are instruments constructed with at least two component "mass" analyzers (selectors) of different types arranged in sequence from ion source to ion detector. Table I lists the common acronyms used to describe components used in hybrid mass spectrometry (MS) systems. The difference between "q" and "Q" is important. The "q" component acts as an ion containment or focusing device; a "Q" component is a quadrupole mass filter that performs a mass analysis. The listed sequence of acronyms reflects the instrumental sequence of the physical components of the mass spectrometer, reading from ion source to the ion detector, and reflecting the flight path of ions through the instrument. Therefore, an EB/qQ and a Q/TOF are both hybrid instruments comprising the components in the sequence shown, with "q" acting as the ion activation component in the first instrument and "Q" acting as a mass-analyzing component in the second. The solidus (/) emphasizes an interface (accomplishing processes of ion activation, ion focus, and ion transport) between instrument components of different types that must be designed to accommodate substantial differences in beam shapes, fluxes, or energies, and may also need to mold a continuous ion beam into discrete packets ("packetize" the ions). Many hybrid mass spectrometers are used for MS-MS. An MS-MS analysis is predicated on at least one, and possibly several, sequential changes in an ion's mass, charge, or reactivity. A hybrid mass spectrometer must therefore perform three basic functions: it must complete an analysis of ions (one mass, a selection of masses, or all masses with the selected mass range) before the change, it must complete an analysis of ions (same suite of options) after the change, and it must provide a means to cause the change in ion mass, charge, or reactivity. Hybrid mass spectrometers can be composed of beam components (an ion beam moves through the component) or trap components (a packet of ions resides within the component). The details of these components and how they are joined in a single instrument is a focus of a forthcoming overview (1). Hybrid mass spectrometers have also been the subject of two earlier reviews (2,3).

Table I: Acronyms that describe generic hybrid mass spectrometers
Three metrics (sensitivity, resolving power, and production rate and richness of the data set) can be used to sketch out performance for modern hybrid mass spectrometers. When introducing these metrics, consider that the modern hybrid automobile provides a mileage gain of 2–3 times the usual vehicle (and not even a hypermile champion can eke out any greater performance). But mass spectrometry sometimes advances on a much grander scale. As noted in reference 1, "The practical attainable sensitivity (expressed as a limit of detection) progressed from micrograms to nanograms from 1950 to 1960, from nanograms to picograms by 1970, to femtograms by 1980, to attograms now. The past twenty years evidenced a factor of 1000 increase in performance associated with sensitivity." In the same period of time, practical attainable resolving power has similarly advanced from 102–103 in 1950–1960 to 105–106 today. For the classical performance metrics of sensitivity and resolving power, there are ample applications for hybrid mass spectrometers, and the first-generation hybrid instruments provided modest but consequential increases in performance.
Other than specialized instruments, the first commercial hybrid mass spectrometers (the EB/qQ and the BE/qQ) were the result of a combination of the double-focusing sector-based instruments and two-thirds of the triple-quadrupole instrument (QqQ), then in its first generation on the market. The double-focusing instruments were combined with two-thirds of the triple-quad instrument. How did such instruments impact sensitivity or resolving power in the MS-MS analyses that formed their typical applications? Clearly, a predictable performance attribute is the attainable resolving power in parent ion selection in a product ion scan (4). Otherwise isobaric ions could be mass-separated, separately selected, and one or the other passed through the qQ section for MS-MS. A few examples of such isobaric overlap and selection of one parent ion or the other appeared in the early research and sales literature of the time. Figure 1 (reproduced from reference 1), represents an example derived from the then-current sales literature for a commercial EB/qQ instrument. The left side of Figure 1 represents data measured at a resolving power of about 4000 for ions at m/z 177 and m/z 178, with the sample derived from a perfume mixture. Two of the precursor ions at m/z 178 selected with higher resolving power to yield product ions indicative of a dialkyl phthalate (right top) and methyl eugenol (right bottom).

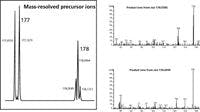

Figure 1: A mixture of perfume sample components in the ionization source provides overlapped mass spectra. Data on the left represent ion signals measured at a resolving power of about 4000 for ions at m/z 177 and m/z 178. Two of the precursor ions at m/z 178 selected with higher resolving power to yield product ions indicative of a dialkyl phthalate (right top) and methyl eugenol (right bottom). (Reproduced from reference 1.)
With increased mass-resolving power, confidence in the analytical results was enhanced concomitantly, because interfering compounds could be discerned and mixtures could be more accurately deconvoluted. In some instances, limits of detection also could be lowered despite the lowered flux of ions transported through a physically larger hybrid instrument. Remember that at about the same time as these first-generation hybrid mass spectrometers became available, a number of novel ionization methods were also being introduced, including fast atom bombardment (FAB), liquid secondary ion mass spectrometry (LSIMS), and matrix-assisted laser desorption ionization (MALDI). These ionization methods were inherently "noisy," in that they often provided some level of signal at every integral ion mass, and this background level could constrain the lower limit of detection. Even a modest increase in resolving power for the parent ion could separate the true analytical signal from the noise. It is significant to remember also that these new ionization methods shifted our ability to create molecular ions into a higher mass range, first into the 1000–5000 Da range, and later even higher. The sector-based components of a hybrid instrument deal with ions moving at higher kinetic energies than the quadrupole-based components. Transmission losses are relatively lower at higher kinetic energies, so the higher flux of higher-mass ions through these components supported better overall instrument sensitivity. However, instrument refinements that led to better sensitivity paled in comparison as electrospray ionization was developed and was shown to provide higher performance through a far more efficient ionization process. The ultimate sensitivity of a mass spectrometer is of course related to both initial ion flux into the mass spectrometer and ion transmission through the components and the performance of the detector. The most consequential ion loss occurs in sample introduction (often outside of our direct control), sample ionization, the extraction of ions from the source, and the manipulation of the ion beam for the very first stage of mass analysis. The benefits derived from the optimization of electrospray ionization far outweighed the other more iterative developments.
The third performance metric for hybrid mass spectrometers is the production rate and richness of the data set. A related term used by Glish and Burinsky in their 2008 review (3) is the duty cycle. Duty cycle relates to the speed at which a hybrid mass spectrometer can produce MS-MS data. For instance, with a TOF component in a hybrid mass spectrometer, a complete mass spectrum is recorded with each pulse of the ionization source and cycle of the timing sequence (start, record, terminate, clear, repeat). In early stand-alone instruments, hundreds or thousands of individual mass spectra were summed to produce a genuinely useful mass spectrum, because of the low output flux ionization sources in use. More recently, optimized miniaturized ion sources with higher specific ion flux outputs more closely approach the ideal "one pulse, one spectrum." How fast can this happen? The time for transit and subsequent mass analysis of even high-mass ions through a TOF instrument is on the order of microseconds. In contrast, for beam- or trap-based hybrid instruments, analysts design a sequence of ion processing and transport for each different experiment (simple or complex) to be completed. By definition, the length of each total sequence became the length of one duty cycle, and the duty cycle can therefore be shorter or longer depending on the complexity of the desired experimental sequence. Almost always, however, the total lengths of these sequences are in the millisecond range. A TOF-hybrid mass spectrometer usually can be seen to have an inherent advantage in the production rate of data.
The instrumental duty cycle for either a TOF-based or other hybrid mass spectrometer does not usually include the time required postmeasurement to assemble or interpret the data. The total duty cycle can, however, include decisions made in software "on-the-fly" to change instrument operation. An example of this is the decision to acquire a product ion MS-MS spectrum for any precursor ion found to exceed some preset relative abundance in the mass spectrum recorded by the first-stage component. Time is a malleable parameter in a hybrid mass spectrometer because ions can be transferred between hybrid instrument components in discrete packages and independent processes can occur in independent components. In a trap/trap hybrid instrument, for example, the final trap can be processing a population of product ions by mass-selection or ion activation, or proving an accurate mass measurement, while the initial trap can be processing single-stage mass spectral data, or even completing a lower resolution MS-MS analysis in its own right. Independent information can therefore flow from the instrument in two or more distinct channels. More than a duty cycle is needed to describe the operation of such an instrument. Rather, a more general parameter that describes the speed at which useful information can be obtained for an experiment that can change in real time is needed. In computer terminology, flops is the term that describes the speed of a computer central processing unit — with flops as a shorthand for floating point operation per second. Because the central information processing goal in MS analysis is the determination or selection of ion mass (or charge), specifically the ion mass before and after an activation step, a new term mass-flops has been suggested (1).
As has always been the case, post-measurement data interpretation requires far more time than data acquisition. As data sets have become larger and larger, the time required for interpretation has similarly increased and grown to include sophisticated data mining methods (4–6). Data mining is profitable because of the richness of the data set produced. The conscious design of the method is to measure as much data as practicable, rather than only that subset of data thought to lead directly to the analytical result. In fact, it may not be clear from the outset where the answer is to be found. Pattern recognition techniques of increasing sophistication are used to search for meaningful differentiating characteristics of the complex data set. For instance, a very recent example showed that discriminant analysis could be applied to the mass spectra generated through desorption MS for volatiles in vodka distilled from rye, corn, or potatoes. Individual compounds were not identified, but the source of the spirit could be reliably identified within the 7-min analysis time (7).
A very practical problem encountered in analyses with hybrid mass spectrometers is not only the speed with which data can be produced, but its related volume. Simply put, data acquisition rates have exceeded abilities to store and manage the data. Shah and colleagues (8) describe a comparison of different data formats for storing mass spectral data used for proteomics analyses. These researchers introduce the cleverly named YAFMS (yet another format for mass spectrometry) format for mass spectral data to address the data file size issue. Basically, the size of the data file has to be reduced so that data mining software can draw the entire data set into memory at once and access various parts of the dataset quickly and efficiently. Data set size depends on the number of scans and the complexity of the sample, but for a common data format, the size of the data file ranges from about 120 Mbytes to slightly over 1200 Mbytes. As data in such files have to be swapped into and out of CPU memory, the processing of the file slows. The 25–60% file size reduction shown in this paper represents a significant advancement. However, the pace of instrumental innovation is such that a factor of 2–5 in increased performance, easily forecast in the next generation of hybrid instruments, will bring us again to the brink. McDonnel and colleagues (9) describe an automated feature identification and extraction method for imaging MALDI data in which the total size of data sets for a set of imaged tissues peaked as high as 400 Gbytes. The challenges in storage, processing, and archiving of such data sets are (no pun overly intended) enormous.
But answers to complex analytical problems can be distilled with finesse from such massive data sets. The successes are not hypothetical, but are current, forcing a confrontation with the information bottleneck. For example, Lee and colleagues (10) review how massive data sets inform metabolomics, and how the data can be used both for clinical diagnosis and the discovery of unexpected metabolic pathways. Similar successes are found throughout the application area of bioanalytical MS. In the past, analysts have seen cleanup and simplification of the sample matrix as a key step in sample preparation and the accuracy of answers. But we have seen that sample cleanup sometimes can be minimized in direct analysis and rapid production of complex data sets from hybrid mass spectrometers and use of sophisticated data mining methods to pull out relevant features. The intrinsic value of hybrid mass spectrometers lies in the unique information they produce and the speed with which these instruments provide that information. Once our data handling capabilities rise to match the instrumental performance, imagine the discoveries that await when we analyze samples drawn a bit more coarsely and more broadly from the environment.


Kenneth L. Busch
Kenneth L. Busch is personally unable to discern the grain source for his vodka through a taste test, despite repeated attempts. He is, however, able to distinguish a very fine barrel bourbon at a 10-m distance. When a scientist purchases hard liquor for analysis on a mass spectrometer, is it classified as solvent or lab sample? This column is solely the responsibility of the author, who can be reached at WyvernAssoc@yahoo.com.
References
(1) K.L. Busch, Encyclopedia of Mass Spectrometry: the m/z Analyzer 7, Elsevier, in press 2011.
(2) J.D. Ciupek, S. Verma, A.E. Schoen, and R.G. Cooks, Spectra 9(4), 7–12 (1999).
(3) G.L. Glish and D.J. Burinsky, J. Am. Soc. Mass Spectrom. 19(2), 161–172 (2008).
(4) A. Barla, G. Jurman, S. Riccadonna, S. Merler, M. Chienci, and C. Furlanello, Brief. Bioinform. 9(2), 199–128 (2008).
(5) M. Hilario, A. Kalousis, J. Prados, and P.A. Binz, Drug Discovery Today Biosilico 2(5), 214–222 (2004).
(6) R.G. Sadykov, D. Cociorva, and J.R. Yates III, Nature Methods 1, 195–202 (2004).
(7) H.H. Jeleñ, A. Ziolkowska, and A. Kaczmarek, J. Agric. Food Chem. 58, 12585–12591 (2010).
(8) A.R. Shah, J. Davidson, M.E. Monroe, A.M. Mayampurath, W.F. Danielson, Y. Shi, A.C. Robinson, B.H. Clowers, M.E. Belov, G.A. Anderson, and R.D. Smith, J. Amer. Soc. Mass Spectrom. 21, 1784–1788 (2010).
(9) L.A. McDonnel, A. von Remoortere, N. de Velde, R.J.M. van Zeijl, and A.M. Deelder, J. Amer. Soc. Mass Spectrom. 21, 1969–1078 (2010).
(10) D.Y. Lee, B.P. Bowen, and T.R. Northen, Biotechniques 48, 557–565 (2010).


Synthesizing Synthetic Oligonucleotides: An Interview with the CEO of Oligo Factory
February 6th 2024LCGC and Spectroscopy Editor Patrick Lavery spoke with Oligo Factory CEO Chris Boggess about the company’s recently attained compliance with Good Manufacturing Practice (GMP) International Conference on Harmonisation of Technical Requirements for Registration of Pharmaceuticals for Human Use (ICH) Expert Working Group (Q7) guidance and its distinction from Research Use Only (RUO) and International Organization for Standardization (ISO) 13485 designations.


