ICP Emission Spectrometry: Arsenic at 228 nm — Interferent or Analyte?
This article compares several performance criteria such as full width at half maximum, background equivalent concentrations, limits of detection, purge requirements, and results for some substances for the "traditional" As lines at 188.979, 193.696, and 197.197 nm for the "new" line at 228.812 nm.
This article compares several performance criteria such as full width at half maximum, background equivalent concentrations, limits of detection, purge requirements, and results for some substances for the "traditional" As lines at 188.979, 193.696, and 197.197 nm for the "new" line at 228.812 nm.
The elements arsenic (As) and cadmium (Cd) are regarded as two of the most toxic elements to living organisms. Consequently, these elements must be monitored to make sure they do not become harmful to the environment. For example, tolerable or permissible levels in drinking water are 10 μg/L for As and 3 μg/L (by the European Union [EU] and World Health Organization [WHO]) (1,2) or 5 μg/L (by the United States] (3) for Cd. In foods they range from 0.05 to 0.2 mg/kg for Cd (4). Daily intakes by pharmaceutical products must not exceed 1.5 μg of inorganic As or 25 μg of Cd (5).
Since very low concentrations are involved, the determination of As has been a challenge for atomic spectrometry techniques. While atomic absorption (AA), with its subtechniques graphite furnace and hydride generation, is generally considered the best choice, both subtechniques have long analysis times, either during the measurement cycle itself, as is the case with graphite furnace AA, or tedious sample preparation, which is necessary for the hydride technique.
During the last few decades, inductively coupled plasma–optical emission spectrometry (ICP-OES) has taken the major load in the modern analytical laboratory, partly because of its speed advantage. Also, with its extremely high excitation temperatures, a lot of interferences known in AA vanished. At the same time, because of the high temperatures in the plasma, ICP spectra are more line rich and prone to spectral interferences. These have been a major concern with respect to accuracy since the introduction of ICP-OES. As a consequence, improving the spectral resolution has been a driving force in the development of optics for ICP instruments.
When the first commercial ICP spectrometers were introduced in the 1970s, the typical resolution of the instruments was of the order of 50 pm, at that time still quoted as 0.05 nm. Although these numbers have significance to experienced users, the information on the separating power of the optics was often conveyed using spectra to show the degree of overlap of two adjacent lines. The line pair of Cd at 228.802 nm and As at 228.812 nm was commonly chosen to demonstrate the practical spectral resolution. The degree of overlap and, thus, the freedom from erroneous results were shown for Cd as an analyte and As as an interferent.
This case has a practical background because Cd only has three lines that are sensitive enough for trace determinations, two of which are interfered by the common matrix element Fe, and the third line shows some overlap by As, as displayed in Figure 1. Thus, As has always been regarded as the problem element in this situation.

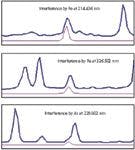
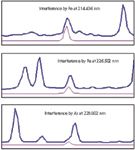
Figure 1: Examples of the interferences of the three most sensitive Cd lines in a contaminated soil sample. The blue line shows a spectrum of the sample that includes matrix elements, and the red line displays a single-element spectrum of Cd. The spectra were taken with a spectrometer of medium resolution.
Typically, three lines below 200 nm (at 188, 193, and 197 nm) are used for the determination of As by ICP-OES. These are affected by absorption because of oxygen, which is seriously aggravated in the wavelength region below 190 nm, where the absorption coefficient of oxygen increases dramatically. Dealing with this absorption adds to the complexity of the analysis. Typically, a prepurge time is needed to get rid of oxygen in the transfer and dispersing optics. Neglecting this prepurge step will give rise to drift in the analytical results (6).
Thus, the analytical problem in ICP-OES for these elements is twofold: an interference-free determination of Cd and a straightforward determination of As.
Instrumentation and Sample Preparation
The instrument used was a PlasmaQuant 9000 (Analytik Jena AG). The spectrometer consists of a prism monochromator followed by an echelle grating monochromator. The latter uses a grating ruled at 75 lines/mm and blazed at approximately 76°. The reciprocal linear dispersion is 0.055 nm/mm at 190 nm in the 135th order. In the prism monochromator, a variable slit and a 60° quartz prism are used to selectively transmit only the grating order of interest for each measurement wavelength. Thus, an unambiguous, highly dispersed spectrum is obtained in every case. The radiation in the region of each spectral line used in an analysis is detected by means of a backside illuminated charge-coupled device (CCD) (Hamamatsu Photonics KK). The effective pixel dimensions are 18 μm × 2016 μm. Typically, 200 pixels are used for the measurement, corresponding to wavelength ranges between circa 0.2–1.0 nm.

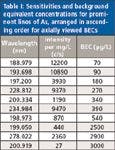
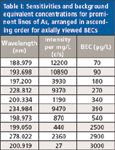
Table I: Sensitivities and background equivalent concentrations for prominent lines of As, arranged in ascending order for axially viewed BECs
The plasma orientation is vertical with the option of both viewing directions: radial and axial. Since traces need to be determined, the choice for plasma viewing was set to axial because with this viewing direction, lower concentrations can be measured. Standard operating conditions (RF power: 1200 W, nebulizer gas flow 0.6 L/min, plasma gas flow: 12 L/min, auxiliary gas flow: 0.5 L/min) were used for all measurements. The instrument was equipped with a concentric nebulizer and cyclonic nebulizer chamber (Conikal nebulizer and Tracey nebulizer chamber, Glass Expansion). The pump rate was set to 1 mL/min. Three replicates were read for standards and samples and 11 replicates for detection limit measurements. The measurement time was 10 s. All peaks were processed in three pixel area modes. Automatic background correction was employed using a linear fit.


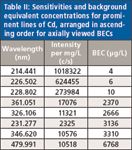
Table II: Sensitivities and background equivalent concentrations for prominent lines of Cd, arranged in ascending order for axially viewed BECs
Standard and blank solutions were acidified to a concentration of 2% nitric acid (30 mL nitric acid, 65%, suprapur, Merck, in 1 L of 18-MΩ water). Stock solutions (Merck) containing 1 g/L were diluted accordingly with micropipettes.

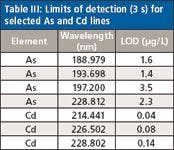
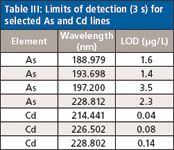
Table III: Limits of detection (3 s) for selected As and Cd lines
Solid materials were digested with microwave-oven assistance (Topwave, Analytik Jena AG). Approximately 0.2–0.5 g of sample was treated with 2 mL of nitric acid (65%, suprapur, Merck) and 1 mL of hydrochloric acid (35%, suprapur, Fluka-Sigma-Aldrich) using a five-step heating program with a maximum temperature of 200 °C. The solutions were filled to 25 mL directly into 50-mL autosampler containers (Greiner GmbH) to avoid contamination.


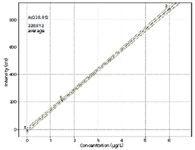
Figure 2: Calibration plot for As at 228 nm.
Results and Discussion
For the goal of trace analysis, low limits of detection (LODs) are necessary. Good signal-to-background ratios are a prerequisite for low LODs. In ICP-OES, an inverse of the signal-to-background ratio is normalized to concentration units; the background equivalent concentration (BEC) is used to quantify this analytical figure of merit. If the background is very low, then using the BEC for optimization may not generate the best results. In this case, the sensitivity may be another important figure of merit to take into consideration. For evaluation, the sensitivity and BECs for the most sensitive lines were measured. The data are compiled in Tables I and II. The least sensitive lines were then excluded while the more sensitive lines were used to measure the 3σ detection limits using the blank method. The results are shown in Table III. It should be noted that there is no great difference between the detection limits for the As lines, the range being within a factor of 2 for the three wavelengths normally selected for As, while the LOD for the As line at 228 nm is in between the other LODs.

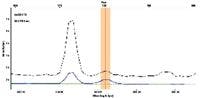
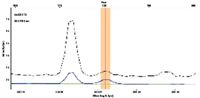
Figure 3: Spectrum of the line pair Cd and As at 228.8 nm of the water sample (blue line, NIST 1643e) and aqua regia digest of sludge sample (black line, BCR144). The cursor is positioned on the As peak, while the Cd peak is to the left of the analyte line. The light green line shows the automatically calculated background used for correction of the water sample.
For the determination of As and Cd in a selection of samples, the instrument was calibrated with standard solutions. Figure 2 shows an example of a calibration function. The calibration function is linear throughout the anticipated concentration range in the samples. Using these calibration functions, a variety of samples were analyzed. Figure 3 displays the spectrum of a sludge sample, which contains As and Cd. The peaks are clearly resolved, so the results for each element are not influenced by the other. The data are presented in Table IV. Four kinds of pharmaceuticals (aspirin [Bayer], Grippostad [Stada], Ibuflam [Zentiva], and Nisylen [Deutsche Homöopatische Union]) were also analyzed and As or Cd could not be detected in any of the samples, which means that the concentrations are below the permissible values. Although there are small deviations between the measured and the certified values, an excellent agreement is found between the individual results for different wavelengths of the same element.

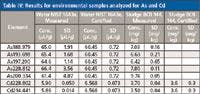
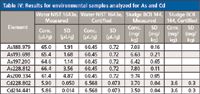
Table IV: Results for environmental samples analyzed for As and Cd
Conclusion
When using an instrument with a spectral resolution of about 3.5 pm (and thus complete resolution of the line pair Cd-As at 228 nm), both lines, As and Cd, can be used at this wavelength, without the need to deal with potential interferences of one on the other.
An additional benefit of improved resolution is the increased power of detection, which lowers the detection limits for these elements to a range that makes it attractive for use in a number of applications.
Since the wavelength at 228 nm is not affected by absorption because of ambient oxygen, the analysis is greatly simplified; there are no purge requirements like there are for the other As lines below 200 nm.
Therefore, it is time for a paradigm change: Instead of continuing to regard As as an interferent at 228 nm, one can consider this line as useful for the quantification of As. Thus, both elements can be successfully determined at the 228 nm wavelength.
Joachim Nölte is with AnalytikSupport in Stein am Rhein, Switzerland. Bernhard Radziuk is with Analytik Jena in Überlingen, Germany. Direct correspondence to: joachim.noelte@analytiksupport.de
References
(1) European Community, Council Directive 98/83/EC of 3 November 1998 on the quality of water intended for human consumption.
(2) World Health Organisation (WHO), Guidelines for Drinking-Water Quality, 4rt Ed., (Geneva, Switzerland, 2011).
(3) Environmental Protection Agency (EPA), National Primary Drinking Water Regulations, (EPA 816-F-09-004, 2009).
(4) Europäische Union, Verordnung (EG) Nr. 1881/2006 der Kommission vom 19. Dezember 2006 zur Festsetzung der Höchstgehalte für bestimmte Kontaminanten in Lebensmitteln.
(5) United States Pharmacopeia General Chapter <232> "Elemental Impurities—Limits" (United States Pharmacopeial Convention, Rockville, Maryland). Available at: http://www.usp.org/usp-nf/key-issues/elemental-impurities.
(6) J. Nölte, Fehlerfrei durch die ICP Emissionsspektrometrie (Wiley-VCH, Weinheim, Germany, 2012), p. 156.


Inside the Laboratory – The Petrochronology Group at University of California, Santa Barbara
January 29th 2024In this edition of “Inside the Laboratory,” John Cottle, PhD, a professor of geology at the University of California, Santa Barbara, and a member of Spectroscopy’s Editorial Advisory Board, discusses his group’s most recent work using “laser ablation split steam” analysis to measure elemental concentrations and isotopic ratios in rocks and minerals.


