Improvement of the Limits of Detection for P, S, and Ca Nanoparticle Size in the Absence of Dissolved Analyte Using a Mixed-Gas Plasma in Single-Particle Inductively Coupled Plasma–Mass Spectrometry
Spectroscopy
This study shows, for the first time, that limits of detection (LOD) can be improved for P, S and Ca nanoparticles by the addition of N2 to the plasma flow for single-particle inductively coupled plasma–mass spectrometry (spICP-MS). The work also examined the relative LOD differences using Ar-N2 and Ar-N2-H2 mixed-gas plasmas.
Addition of nitrogen (N2) to the plasma (outer) flow increases the power density of the plasma, which reduces matrix effects and may aid in the atomization and ionization of nanoparticles (NPs). For the first time, this work reports the limits of detection of NP diameter (LoDsize) for 37 elements in the absence of dissolved analyte using single particle inductively coupled plasma–mass spectrometry (spICP–MS) with argon (Ar) plasma as well as Ar-N2 and Ar-N2-H2 mixed-gas plasmas. For each plasma, the selected operating conditions provided a compromise in sensitivity for multielemental analysis. Despite this compromise, the Ar plasma provides significantly lower LoDsize than previously reported using a different instrument brand. The Ar plasma also provides significantly lower LoDsize than the mixed-gas plasmas, except for 33S, 31P, and 44Ca, where oxygen scavenging by N2 within the Ar-N2 plasma significantly improved LoDsize. With the Ar-N2-H2 plasma, an accompanying loss of sensitivity largely negated the LoDsize improvement from oxygen scavenging. Further improvement of LoDsize for S, P, and Ca can be expected from optimizing the Ar-N2 mixed-gas plasma for the individual determination of each element.
Engineered nanomaterials have diverse uses in textiles, medicine, fuel production, and storage (1). The potential applications of nanoparticles (NPs) depend heavily on properties such as size, shape, and elemental composition; their preparation is thus aimed at minimizing the variability in these characteristics (2). The release of these materials into the environment has raised concerns about their potential toxicity (3,4). Attempts at characterization and risk assessment of nanomaterials has brought to the forefront a need for reliable quantitative methods for their characterization, especially in complex environmental matrices (3). The extremely low concentration of NPs in realistic environmental conditions, effects of complex environmental matrices on sensitivity, and interfering species in the environment samples make in situ measurement difficult (5).
Single particle inductively coupled plasma–mass spectrometry (spICP-MS) is a useful analytical tool for the characterization of NPs in aqueous suspension, due to its extremely high sensitivity and isotopic specificity (6). These features enable spICP-MS to surmount the challenges of in situ NP characterization (namely, low analyte concentration in complex matrices), which preclude other techniques, such as transmission electron microscopy, nanoparticle tracking analysis, and X-ray diffraction (7). At a sufficiently low NP concentration, each droplet of the polydisperse sample aerosol resulting from nebulization will contain one NP at the most, which can be individually atomized and ionized in the plasma. If measurements are made sufficiently frequently so as to observe single droplets in isolation, the resulting ion flux at the detector is proportional to the mass of each single NP. Sample dilution, dwell time, and other experimental parameters must be optimized to ensure these conditions are met. Assuming a spherical shape and density equal to that of the bulk material allows for the conversion of NP mass to diameter (8–12). Assuming no dissolved analyte in solution with the NP suspension, the limit of detection (LoD) for mass flux can be converted to the LoD for NP mass (LoDmass) or diameter (LoDsize) (13).
So far, an Ar plasma has been used for all spICP-MS work. Yet, the addition of N2 to the Ar plasma gas flow creates a more robust ionization source, which suppresses or enhances analyte sensitivity compared to that with an Ar plasma, depending on the analyte (14). The concurrent use of hydrogen (H2) sheath gas may slightly increase sensitivity versus that with an Ar plasma (14), which would be advantageous for spICP-MS. Hence, for the first time, this study aims to determine LoDsize and LoDmass in the absence of dissolved analyte for NPs of each of 37 elements by spICP-MS using Ar-N2 and Ar-N2-H2 mixed-gas plasmas, and compare them to those obtained with a conventional Ar plasma. Results from this study provide an updated data set for NP LoDsize in the absence of dissolved analyte using a more sensitive spICP-MS instrument with Ar and mixed-gas plasmas, and a comparison to the data set published previously by Lee and associates (13).
Experimental
Chemicals
Five aqueous standard solutions containing 37 elements (Ag, Al, Co, Cr, Cu, Eu, Fe, In, Ni, Sr, and Zn; Mo, P, S, Se, Ti, and Zr; As, Be, Bi, Ca, Cd, Ce, Ga, Ge, Li, Mg, Pb, Sb, Sc, Th, Tl, V, and Y; Pd and Pt; and Au) were prepared from 1000−10000 mg/L monoelemental standard solutions (SCP Science) in doubly deionized water (DDW; 18 MΩ cm resistivity, Arium Pro UV|DI water purification system, Sartorius Stedim Biotech). The elemental combinations were selected to reduce spectroscopic and isobaric interferences. A suspension of monodisperse 49.9 ± 2.2 nm PEG carboxyl-coated Au NPs in 2 mM citrate (4.2 x 10¹⁰ particles/mL; 99.99% Au purity; nanoComposix) was used to determine transport efficiency and for method optimization. A suspension of monodisperse 45 ± 5 nm Pt NPs in 2 mM citrate (4.8 x 10¹⁰ particles/mL; 99.99% Pt purity; nanoComposix) was used for method optimization.
Working stocks of the multielemental aqueous standard solutions at a concentration of 1 mg/L were diluted to 0.5, 1, 3, 5, and 10 µg/L in DDW in polypropylene vials on the day of analysis. The Au NPs and Pt NPs stock solutions were diluted serially in DDW to 10500 NPs/mL to be used in the determination of transport efficiency and for method optimization. The Au NPs and Pt NPs working solutions were prepared in DDW in polypropylene vials on the day of analysis.
Instrumentation
A Varian 820MS (Varian Inc., now produced by Analytik Jena AG) quadrupole-based ICP-MS instrument was used for this research, including Ni sampler and skimmer cones (0.9 and 0.4 mm orifices, respectively). The collision reaction interface was not employed. Aqueous sample introduction was achieved using a T2100 nebulizer (Burgener Research, Inc.) fitted to a Scott double-pass spray chamber (SCP Science) maintained at 0 °C via a computer-controlled Peltier cooling system. Ultrahigh purity N2 (99.999%) was introduced to the plasma gas flow through an additional gas inlet. Ultrahigh purity H2 (99.999%) was introduced into the central gas channel through the sheathing device located between the spray chamber and torch injector.
Data acquisition was carried out in steady-state analysis mode with 10 replicates of 25 scans each. Torch alignment was optimized daily for maximum sensitivity and minimum oxide and doubly-charged ion levels using a tuning solution containing 5 µg/L Ba, Be, Ce, Co, In, P, Mg, and Th in 1% v/v HNO3 (SCP Science).
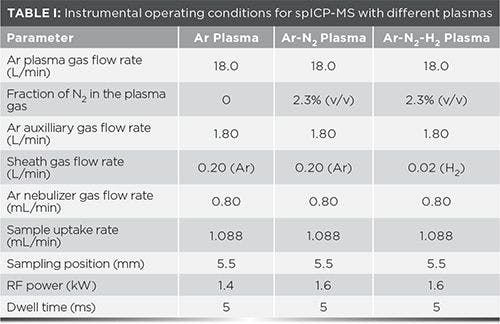
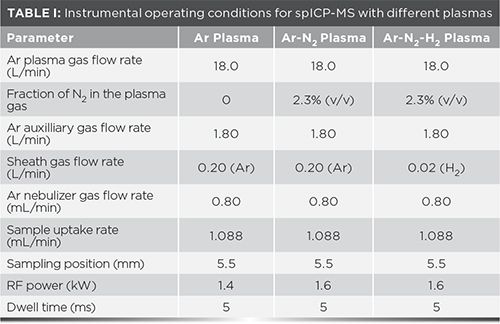
The parameters for the Ar and mixed-gas plasmas were optimized for maximum sensitivity and robustness with 10500 particles/mL Au NPs and Pt NPs solutions. Robustness was quantified as the relative NPs concentration and accuracy in observed NP diameter measured in NP solutions with and without the addition of 0.1 M Na. Operating parameters are summarized in Table I. For each element, 1−4 isotopes were monitored.

Measurement of Sample Uptake Rate and Transport Efficiency
The change in mass of a vial containing DDW following 1 min of continuous DDW aspiration, measured in triplicate on the day of analysis, yielded the sample uptake rate. Transport efficiency was determined as the ratio of observed Au NPs concentration (expressed as number of NPs/mL) to the expected concentration over a 1-min time-resolved analysis period. Transport efficiency was corrected for a 27-ms settling time (varying over the course of data acquisition) to obtain the corrected transport efficiency, ηn´, using:


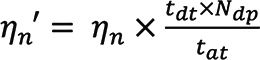
[1]
where ηn´ is the uncorrected transport efficiency, tdt is the dwell time (5 ms), tat is the total acquisition time, and Ndp is the number of data points during the analysis time (15). Transport efficiency measurements were taken in triplicate with three Au NPs working solutions. The observed number concentration was calculated as the number of Au NPs distinct from the background (based on three times the standard deviation of the background) divided by the volume of sample analyzed.
Data Processing
For each monitored isotope, the signal intensity was plotted against elemental mass flux for each standard solution to construct a calibration curve. The LoD obtained using this aqueous standard calibration curve corresponds to the smallest NP mass detectable with spICP-MS (LoDmass), in the absence of the element in solution (7–13). With the assumption that the NP is perfectly spherical and its density is the same as the bulk elemental density, a LoD for NP diameter (LoDsize) is calculated as:


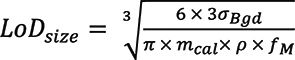
[2]
where σBgd is the standard deviation of the signal from the DDW blank solution, mcal is the slope of the aqueous standard calibration curve, ρ is the bulk elemental density, and fM is the elemental mass fraction in the NP (in this work, monoelemental NPs were assumed, so fM = 1).
Results and Discussion
Comparison of Ar and Mixed-Gas Plasmas
Figure 1 shows the LoDsize for spICP-MS with Ar and mixed-gas plasmas. Overall, the Ar plasma provides significantly better LoDsize than both the Ar-N2 and Ar-N2-H2 plasmas (p < 0.001 by paired Student’s t test for each). However, the LoDsize with the Ar-N2 plasma is lower than with the Ar-N2-H2 plasma (p < 0.001 by paired Student’s t test).

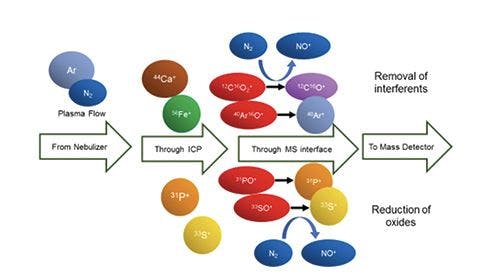
Figure 1: Calculated LoDsize in the absence of dissolved analyte for NPs of each of various elements by spICP-MS with Ar and mixed-gas Ar-N2 and Ar-N2-H2 plasmas, compared with those determined by Lee et al. (13).

The largest difference in LoDsize between the Ar plasma and the mixed-gas plasmas occurs for heavier metallic elements such as Pt and Pd. For example, when monitoring 195Pt+, LoDsize increases from 5.6 nm with Ar to 20 nm with Ar-N2 and 21 nm with Ar-N2-H2. With 106Pd+, LoDsize increases from 7.7 nm with Ar to 28 nm with Ar-N2 and 86 nm with Ar-N2-H2.
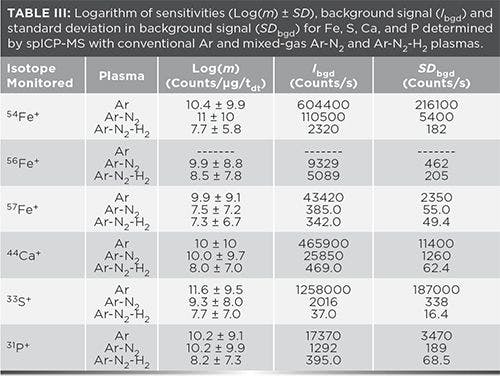
In fact, LoDsize is smaller with an Ar plasma than with the Ar-N2 plasma for 63 of 67 isotopes and the Ar-N2-H2 plasma for 64 of 67 isotopes. However, for 54,56Fe, 31P, 33S and 44Ca, LoDsize is better with the mixed-gas Ar-N2 plasma (Table II), due to a reduction in background signal and noise (Table III), as well as in interfering oxide formation. Previous studies have shown that the addition of N2 to the Ar plasma flow reduces the formation of analyte oxide and interfering oxide species, such as ArO+ and ArOH+ (16). Decomposition of oxides may be promoted in the higher-temperature mixed-gas plasma (17). The added N2 can also scavenge oxygen from the plasma to form nitrogen oxide species such as NO+. Unfortunately, the concomitant loss of sensitivity that resulted with the Ar-N2-H2 plasma largely negated this beneficial effect. Thus, the remainder of this discussion will focus on the Ar-N2 plasma.

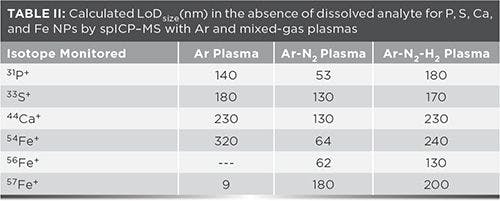
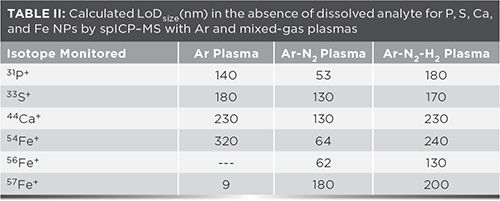

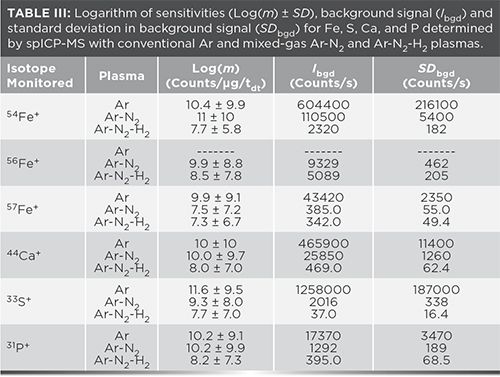
No LoDsize could be calculated for 56Fe+ in an Ar plasma because the 40Ar16O+ background signal systematically caused detector saturation, including with the blank. Because of the oxygen-scavenging effect of N2 in the mixed-gas plasmas, little 40Ar16O+ was detected, leading to an improved LoDsize. Nonetheless, the lowest LoDsize for Fe was obtained with 57Fe+ in an Ar plasma.
With the Ar-N2 plasma, the background intensity on 31P+ (from 13C18O+ and NO+), 33S+ (from O2+), and 44Ca+ (from 12C16O2+ as a result of dissolved CO2, as well as contamination of Ar and entrained air into the plasma) decreased by over an order of magnitude while sensitivity remained similar to that in an Ar plasma (Table III), resulting in improved LoDsize for P, S and Ca. The oxygen-scavenging effect of N2 also reduced the formation of sulfur oxide, phosphorus oxide, and calcium oxide species, thereby increasing the pool of detectable 31P+, 33S+ and 44Ca+ . Because of the important 16O2+ interference on 32S+, the latter was not monitored. Given that these improvements in LoDsize with the Ar-N2 plasma were achieved under compromise operating conditions for multielemental analysis, even lower LoDsize could be reached if operating conditions were optimized for each element. Indeed, depending on the element, better LoDsize was observed under different mixed-gas plasma conditions. For example, the LoDsize for 195Pt+ using an Ar-N2-H2 mixed-gas plasma with 10 mL/min H2 (instead of 20 mL/min in Table I) was 11 nm (instead of 21 nm under the conditions for multielemental analysis).
Comparison of LoDsize Using Ar ICP with Literature
Figure 1 also includes the LoDsize for the isotopes reported by Lee and associates (13), which are significantly higher than those obtained in this work with the Ar plasma (p = 0.028 by paired Student’s t test). In fact, lower LoDsize was obtained for 29 of the 33 isotopes in common with Lee and associates. The greatest improvements in LoDsize were observed for metallic elements, with little improvement or an increase in LoDsize for metalloids and nonmetals.
LoDsize was only degraded for four isotopes compared to that calculated by Lee and associates (Table IV). In the case of 64Zn+ and 66Zn+, the background signal was on the order of 105 counts/s whereas most monitored isotopes had blank signals one to four orders of magnitude lower. This issue was resolved when monitoring 68Zn+, whose lesser background signal resulted in LoDsize of 48 nm. Both 27Al+ and 24Mg+ had considerable background noise, with signal-to-noise ratios of 48% and 25%, respectively.

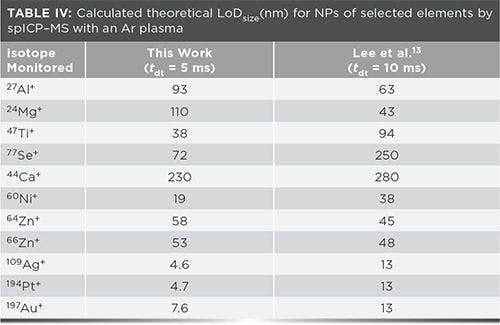
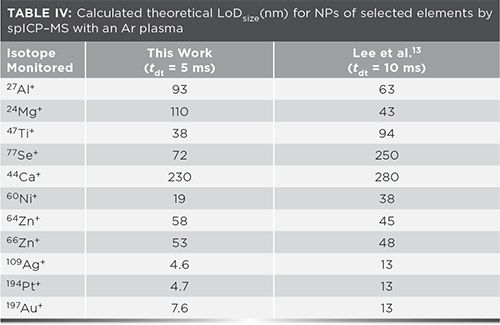
The greatest improvements were observed for Ti, Se, and Ca (Table IV). Altogether, LoDsize decreased by 32% on average from the values reported by Lee and associates (13). Other improvements of note are those involving the noble metals and nickel. These improvements are doubly interesting due to the smaller dwell time used in the current work (5 ms instead of 10 ms by Lee and associates), which would be expected to decrease sensitivity and increase LoD (18). The benefit of using a 5-ms dwell time for spICP-MS instead of 10 ms, which decreases the proportion of coincident particles while minimizing the decrease in sensitivity, was reported previously (19).
Conclusions
This study represents the first application of Ar-N2 and Ar-N2-H2 mixed-gas plasmas to spICP-MS, revealing that, even under conditions providing a compromise sensitivity for multielemental analysis, the Ar-N2 mixed-gas plasma improves the LoDsize for NPs containing S, P, and Ca due to the scavenging of oxygen by nitrogen. For other elements investigated, however, an Ar plasma provides the lowest LoDsize. In fact, despite the dwell time being halved (5 ms instead of 10 ms), the LoDsize reported in this work, under conditions providing a compromise sensitivity for multielemental analysis with an Ar plasma, are significantly improved for most of the elements compared to previously reported values. The multielement aqueous standard provides a model system suitable for the investigation of matrix-induced suppression and method robustness for the determination of NP LoDsize for a range of elements.
As the limits of detection in this study were calculated in the absence of dissolved analyte, future work will use NPs in liquid matrices with and without known dissolved metal concentrations to determine their effect on real LoDsize. The use of bimetallic NPs may also provide information on the effect of concomitant and potentially interfering species on LoDsize. The mixed-gas plasma should also be optimized for each element, to see the lowest LoDsize that can be achieved under robust conditions.
Acknowledgments
This research was conducted as part of the Engineered Nickel Catalysts for Electrochemical Clean Energy project administered from Queen’s University and supported by Grant No. RGPNM 477963-2015 under the Natural Sciences and Engineering Research Council of Canada (NSERC) Discovery Frontiers Program. Joshua Kofsky thanks NSERC for an Undergraduate Student Research Award, Andrew Williams for his assistance in conducting the experiments, and Ram Lamsal for his guidance and expertise.
References
- A. Nel, T. Xia, L. Mädler, and N. Li, Science 311, 622–627 (2006).
- A. López-Serrano, R.M. Olivas, J.S. Landaluze, and C. Cámara, Anal. Meth. 6, 38–56 (2014).
- M.R. Wiesner, G.V. Lowry, P. Alvarez, D. Dionysiou, and P. Biswas, Environ. Sci. Technol. 40, 4336–4345 (2006).
- S.F. Hansen, A. Maynard, A. Baun, and J.A. Tickner, Nat. Nanotech. 3, 444–447 (2008).
- M. Hassellöv, J.W. Readman, J.F. Ranville, and K. Tiede, Ecotoxicol. 17, 344–361 (2008).
- F. Laborda, E. Bolea, and J. Jiménez-Lamana, Anal. Chem. 86, 2270–2278 (2014).
- H.E. Pace, N.J. Rogers, C. Jarolimek, V.A. Coleman, E.P. Gray, C.P. Higgins, and J.F. Ranville, Environ. Sci. Technol. 46, 12272–12280 (2012).
- C. Degueldre, P.Y. Favarger, Coll. and Surf. A 217, 137–142 (2003).
- C. Degueldre and P.Y. Favarger, Talanta 62, 1051–1054 (2004).
- C. Degueldre, P.Y. Favarger, and S. Wold, Anal. Chim. Acta 555, 263–268 (2006).
- C. Degueldre, P.Y. Favarger, and C. Bitea, Anal. Chim. Acta 518, 137–142 (2004).
- C. Degueldre, P.Y. Favarger, R. Rossé, and S. Wold, Talanta 68, 623–628 (2006).
- S. Lee, X. Bi, R.B. Reed, J.F. Ranville, P. Herckes, and P. Westerhoff, Environ. Sci. Technol. 48, 10291–10300 (2014).
- Y. Makonnen and D. Beauchemin, Spectrochim. Acta B 99, 87–93 (2014).
- R.P. Lamsal, G. Jerkiewicz, and D. Beauchemin, Microchem. J. 137, 485–489 (2018).
- J.W.H. Lam and G. Horlick, Spectrochim. Acta B 45, 1313–1325 (1990).
- I. Ishii, D.W. Golightly, and A. Montaser, J. Anal. At. Spectrom.3, 965–968 (1988).
- J. Tuoriniemi, G. Cornelis, and M. Hasselöv, J. Anal. At. Spectrom. 29, 743–752 (2014).
- I. Abad-Álvaro, E. Peña-Vázquez, E. Bolea, P. Bermejo-Barrera, J. Castillo, and F. Laborda, Anal. Bioanal. Chem. 408, 5089–5097 (2016).
Joshua Kofsky and Diane Beauchemin are with the Department of Chemistry at Queen’s University in Kingston, Ontario, Canada. Direct correspondence to: diane.beauchemin@queensu.ca


Measurement of Ammonia Leakage by TDLAS in Mid-Infrared Combined with an EMD-SG Filter Method
April 9th 2024In this article, tunable diode laser absorption spectroscopy (TDLAS) is used to measure ammonia leakage, where a new denoising method combining empirical mode decomposition with the Savitzky-Golay smoothing algorithm (EMD-SG) is proposed to improve the signal-to-noise ratio (SNR) of absorbance signals.


