Increasing the Enhancement of SERS with Dielectric Microsphere Resonators
Spectroscopy
Surface-enhanced Raman spectroscopy (SERS) is a widely studied technique capable of adding single-molecule detection capability to the rich information provided by Raman spectroscopy. in this aricle, the authors show an additional system gain of more than two orders of magnitude to SERS by using a dielectric microsphere resonator to capture and excite the target system.


Biosensing technologies are one of the many hot research topics that are drawing upon optical technologies for applications in the life sciences. Today, fluorescence detection is the most popular optical mechanism used in biosensing, although label-free detection is an up-and-coming research area that might eliminate the complex labeling process in some applications. Label-free sensors typically use either optical or mechanical resonances in the detection of target analytes (1–3). Another relatively new alternative to fluorescence detection in the biosensing research field is the use of silicon nanowires or carbon nanotubes as field-effect transistors (4). These sensors report the presence of target molecules by a conductance change due to electrochemical interactions with the analytes.
All of these sensing technologies are important research areas that will likely have a significant impact on biomolecular detection. However, none provide the rich information that Raman spectroscopy can deliver, including structural and compositional information, as well as excellent specificity. Unfortunately, the Raman scattering signal is incredibly weak, making it a much less sensitive technique than other detection mechanisms. In fact, the Raman scattering cross section for molecules of interest is typically around 14 orders of magnitude smaller than the fluorescence cross section.
Nonetheless, the Raman scattering effect was made relevant to trace molecule sensing by the discovery and development of surface-enhanced Raman spectroscopy (SERS). This technique consists of locating the target analytes within nanometer range of roughened metal surfaces or metal nanoparticles, typically made of gold or silver. The presence of the metal surface or nanoparticles provides a tremendous enhancement to the resulting Raman signal through an electromagnetic enhancement of both the excitation light and Stokes-shifted light, as well as through electrochemical interactions between the analyte and the metal. Often, this measured enhancement is considered a modification to the effective Raman scattering cross section. Enhancements to the effective Raman scattering cross section of up to 14 orders of magnitude have been demonstrated (5,6).
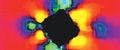
Surface enhanced Raman scattering was first identified simultaneously by Jeanmaire and Van Duyne (7) and Albrecht and Creighton (8) in 1977. Researchers previously had observed extremely strong Raman signals for analytes adsorbed to roughened metal surfaces, but the enhancement was not correctly identified as an electromagnetic and chemical phenomenon until this time. The electromagnetic enhancement was analyzed and presented by Kerker and colleagues in 1980 (9). In short, the optical excitation wave excites the surface plasmons of noble metal structures, which then act as a dipole, generating an electromagnetic wave at the dipole frequency much larger than the incoming excitation wave. The wave generated by the plasmon dipole excites a Raman signal from the target analyte, located near the metal surface or nanoparticle, as illustrated in Figure 1. This Raman signal is much stronger than a Raman signal under typical conditions because of the enhanced excitation light. The Raman signal is likely to be at or near resonance for the metal surface or nanoparticle (because it is relatively close to the excitation light frequency), and thus it will also excite the surface plasmons. As a result, the Raman signal undergoes nearly the same enhancement due to the dipole that the excitation light experienced. All in all, this electromagnetic interaction leads to an enhancement of the Raman signal by about six orders of magnitude.


Figure 1: An incoming electric field creates a resonating dipole in a silver nanoparticle, resulting in a highly enhanced electric field radiating near the particle.
More recently, researchers have achieved effective Raman cross-section enhancements as high as 14 orders of magnitude. Such huge enhancements are possible by taking advantage of clustering geometries of nanoparticles. In the simplest case, a target analyte can adsorb onto a dimer and receive enhancement from each of the individual particles in the small cluster. Using clusters of silver nanoparticles, Nie and Emory (5) and Kneipp and colleagues (6) both demonstrated estimated Raman cross-section enhancements of 14 orders of magnitude. In each case, evidence of single molecule detection was observed. Similar orders of magnitude of enhancement were also observed by Michaels and colleagues (10). In that work, a significant part of the Raman enhancement is believed to be due to electrochemical interactions between the silver and the target analyte, as opposed to the electromagnetic enhancement.
Despite the achievement of single molecule detection with SERS, further enhancement is desirable. The demonstrations of single molecule detection utilize a high power laser for the Raman pump and require complex setups. Additional enhancement can make this extremely sensitive detection technique more practical.
In the research reported here, we have used a dielectric microsphere resonator in combination with SERS to achieve an even higher enhancement as compared to typical Raman spectroscopy. The microsphere resonator effectively increases the number of excitation photons that interact with the SERS target system. This, in turn, increases the Raman signal generated by the target analytes. As shown later, microsphere resonators are simple to work with and quite inexpensive, and thus are excellent candidates for not only boosting the Raman signal, but also for increasing the practicality of SERS systems.
Optical Microsphere Resonators
Optical microspheres are dielectric objects with a radius on the order of a few to hundreds of micrometers. These devices have been researched for several applications, including label-free biological and environmental sensors, telecommunications devices, and cavity quantum electrodynamics (11,12). A microsphere resonator is conceptually illustrated in Figure 2. When light couples into the dielectric sphere, it can become trapped and propagate continuously around the sphere at the inside surface through total internal reflection. This surface mode is referred to as the whispering gallery mode, a term that was originally coined while Lord Rayleigh was studying the acoustic wave propagation along the wall of the circular St. Paul's Cathedral in London.


Figure 2: The optical field repeatedly circulates at the surface of the microsphere. An evanescent field exists beyond the outer surface of the sphere.
An important parameter in any resonator is the quality factor, or Q-factor. In the case of silica microspheres, a Q-factor of up to 109 has been demonstrated (13), which indicates extremely strong confinement of light within the spherical cavity. Such a Q-factor implies that a photon on average circulates the microsphere surface many thousands of times. This results in a highly enhanced field circulating the surface of the sphere as compared to the optical signal originally coupled into the sphere.
As the whispering gallery mode is a surface mode, an evanescent field protrudes beyond the sphere surface, as illustrated in Figure 2. Thus, the whispering gallery mode interacts with matter near the outer surface of the microsphere. In our design, the target analytes are adsorbed to silver nanoparticles, which subsequently adsorb to the surface of a silica microsphere. In this way, the SERS system is exposed to the evanescent field at the microsphere surface. The tremendous advantage of using the microsphere instead of simply illuminating the system with a laser is the resonating nature of the microsphere. Typically, an excitation photon has one opportunity to interact with the target analyte. In the microsphere system, a photon circumnavigates the sphere surface many thousands of times, and thus each photon has a higher probability of generating Raman photons.
The combined use of whispering gallery modes and SERS was reported previously by Kim and colleagues in 1996 (14). However, the work presented here takes advantage of the much higher Q-factor and smaller size of silica microspheres as compared to the cylindrical quartz tubing of the prior work. Additionally, much lower concentrations of analytes are used in this work than the previously reported experiments.
With the composite effects of the microsphere resonator and SERS, we show an additional system gain of around 300. The average enhancement for target molecules in these experiments is well over 108. The peak enhancement is expected to be at least a few orders of magnitude higher than this because only a small fraction of the target molecules are located on a silver nanoparticle, and even fewer are situated in so-called "hot spots," where conditions create much higher enhancements (5).
Demonstration of an Enhanced Sensing System
To demonstrate the advantage of the composite system of the microsphere and silver nanoparticles, Raman measurements of three configurations are taken: a base configuration, a SERS configuration with silver nanoparticles, and finally, a SERS configuration with the silica microsphere as well. In the first two configurations, light from a 690-nm tunable diode laser illuminates the sample while a large-area (diameter = 400 μm) fiber-optic probe collects scattered photons from the target volume and directs them to a spectrometer (Jobin Yvon, Edison, New Jersey). The configuration is illustrated in Figure 3. In the base measurement, a 10-3 M solution of Rhodamine 6G (R6G) is used, whereas in the SERS configuration, R6G is added to a silver nanoparticle solution to a concentration of 10-9 M. The silver nanoparticles used in these experiments are prepared similarly to the popular method of Lee and Meisel (15).


Figure 3: A fiber cable introduces laser light to the solution. A large-area fiber-optic cable collects Raman scattered photons and directs them toward the spectrometer.
The Raman signals generated by each configuration are similar in magnitude, despite the six orders of magnitude difference in the R6G concentration. To calculate the gain provided by the silver nanoparticles, we normalize the measured Raman signal according to the intensity of the excitation light and the number of analytes. Thus, given that the measured Raman signals are very similar and the excitation is similar, the gain is approximately 106, the ratio of the two concentrations used (103 and 109 ). This is a typical value for average effective Raman cross section enhancement for a SERS system.
A silica microsphere is then introduced into the same solution of silver nanoparticles and 10-9 M R6G. Figure 4 shows an SEM photograph taken of a microsphere that was dipped into a solution of clustered silver nanoparticles and then dried. As the photo shows, the silver clusters adsorb to the silica surface. The setup is designed to enable the whispering gallery mode of the microsphere to interact with the surface-bound silver nanoclusters and the R6G molecules adsorbed to the clusters.


Figure 4: SEM image of silver nanoparticles clustered on the surface of a microsphere. Individual particles are slightly under 100 nm across. Clusters appear to be spaced apart by several microns.
The experimental configuration is presented in Figure 5. The microspheres are created by melting the tip of a fiber-optic cable with a CO2 laser — the surface tension of the melted silica forms a nearly perfect sphere. The sphere is submerged in the solution and placed in contact with an optical fiber taper, which is about 3 μm in diameter. Because the taper is so thin, an evanescent field will protrude from it, enabling laser light to be coupled into the sphere (16).


Figure 5: Laser light is coupled into the microsphere with a tapered fiber-optic cable. A large-area fiber-optic cable collects Raman scattered photons and directs them toward the spectrometer.
The light generated by a 690-nm tunable laser diode is scanned repeatedly a few picometers across a whispering gallery mode resonance, which has a subpicometer spectral linewidth. The whispering gallery mode can be identified by watching the output power of the taper. When the resonant condition occurs between the laser and the whispering gallery mode, a dip in the taper output power appears at the location of the whispering gallery mode, because the light is trapped in the sphere. When light at the whispering gallery mode wavelength couples into the sphere, this light circulates along the surface and excites the silver nanoparticles, which results in surface-enhanced Raman scattering. However, as opposed to the basic SERS experiment, photons in the whispering gallery mode circulate hundreds to thousands of times, and have an opportunity to create a SERS response at every revolution.
The measured Raman spectra at around 1510 cm-1 in counts per minute is shown in Figure 6 and compared with the Raman spectrum of the base configuration. The background is subtracted from both signals for comparison purposes. To compute the gain provided by the composite system, we compare the detected Raman counts for each system per input excitation intensity and per analyte concentration. For the base Raman measurement, the power at the output of the fiber cable is 800 μW, while in the microsphere case, the intensity passing through the fiber taper is 80 μW (note that this is the intensity that is available to couple into the microsphere; however, only the light that couples into the evanescent field of the whispering gallery mode actually generates the Raman signal). As for the concentration of analytes, the solution used in the base Raman case is 106 times greater than that used in the microsphere case.

Figure 6: Raman spectra of the base configuration and the configuration with a microsphere and silver nanoparticles.
Comparing the Raman counts per minute in the 1310 cm-1, 1360 cm-1, and 1510 cm-1 Raman lines (the dominant lines for R6G), the system with the microsphere and silver nanoclusters produced 30 times as many counts. Normalizing this ratio by the concentration difference and input intensity difference yields a system advantage of 3 X 10⁸, which is about 300 times more than the silver nanoparticles alone. This value represents the advantage of the system that is actually received by the user. Alternatively, the advantage in terms of effective Raman cross-section enhancement is presented in (17). The actual gain for an R6G molecule on a silver nanocluster is orders of magnitude higher than this average value of 3 X 10⁸. In reality, only a small percentage of R6G molecules are located in a silver cluster, which effectively reduces the concentration of active target analytes. Furthermore, only a small percentage of these active molecules are located in hot spots. Regardless, the benefit of utilizing the microsphere is validated by the additional two orders of magnitude of detected Raman signal as compared to the typical SERS experiment.
Improvements can be made to the microsphere-based system to generate an even larger detected Raman signal. First, a wavelength locking system can be utilized to keep the tunable laser locked to the peak of the whispering gallery mode. Second, the collection optics can be improved to collect more of the Raman-scattered photons. These two improvements could increase the measured Raman signal by a factor of 10 or 20. Furthermore, we believe that the use of the optical microsphere enables the possibility to leverage stimulated Raman scattering to dramatically increase the Raman signal. It is possible that some Stokes-scattered photons might couple into a whispering gallery mode, and thus will circulate the sphere many thousands of times, interacting with many R6G particles on each revolution. In fact, Kwok and Chang (18) demonstrated stimulated Raman scattering at whispering gallery mode frequencies in spherical droplets. Achieving this with our composite SERS–microsphere system could lead to a tremendous gain in the measured Raman signal.
It appears that the design reported here might lead to practical SERS-based biomedical sensing systems for which the detection of trace quantities of molecules or even a single molecule is required. The additional gain compared to a basic SERS system reduces the extreme requirements on high optical pump power, Raman integration time, and receiver sensitivity. This enhanced practicality might help to advance SERS-based single molecule detection systems from amazing lab achievements to common lab devices.
Acknowledgments
This work was sponsored by the 3M Non-Tenured Faculty Award, the University of Missouri Research Board Award (RB 05-013), and the University of Missouri Life Sciences Center.
I. M. White is supported by the MU Life Sciences Fellowship Program. The authors are thankful for support from the University of Missouri Electron Microscopy Core.
References
(1) M. Alvarez, L.G. Carrasocosa, M. Moreno, A. Calle, A. Zaballos, L.M. Lechuga, C. Martinez-A, and J. Tamayo, Langmuir 20, 9663–9668 (2004).
(2) J. Homola, S.S. Yee, and G. Gauglitz, Sens. Actuators, B 54, 3–15 (1999).
(3) F. Vollmer, D. Braun, A. Libchaber, M. Khoshsima, I. Teraoka, and S. Arnold, Appl. Phys. Lett. 80, 4057–4059 (2002).
(4) G. Zheng, F. Patolsky, Y. Cui, W.U. Wang, and C. M. Lieber, Nature Biotechnol. 23, 1294–1301 (2005).
(5) S. Nie and S.R. Emory, Science 275, 1102–1106 (1997).
(6) K. Kneipp, H. Kneipp, I. Itzkan, R.R. Dasari, and M.S. Feld, Chem. Rev. 99, 2957–2975 (1999).
(7) D.L. Jeanmaire and R.P. Van Duyne, J. Electroanal. Chem. 84, 1–20 (1977).
(8) M.G. Albrecht and J.A. Creighton, J. Am. Chem. Soc. 99, 5215–5217 (1977).
(9) M. Kerker, D-S. Wang, and H. Chew, Appl. Opt. 19, 4159–4174 (1980).
(10)A.M. Michaels, M. Nirmal, and L.E. Brus, J. Am. Chem. Soc. 121, 9932–9939 (1999).
(11) "Biophotonics/Optical Interconnects and VLSI Photonics/WBM Microcavities," 2004 Dig. LEOS Summer Topical Meeting (IEEE, Piscataway, New Jersey, 2004).
(12) R.K. Chang and A.J. Campillo, Eds., Optical Processes in Microcavities (World Scientific, Singapore, 1996).
(13) M.L. Gorodetsky, A.A. Savchenkov, and V.S. Ilchenko, Opt. Lett. 21, 453–455 (1996).
(14) W. Kim, V.P. Safonov, V.M. Shalaev, and R.L. Armstrong, Phys. Rev. Lett. 82, 4811–4814 (1999).
(15) P.C. Lee and D. Meisel, J. Phys. Chem. 86, 3391–3395 (1982).
(16) M. Cai and K. Vahala, Opt. Lett. 25, 260–262 (2000).
(17) I. M. White and X. Fan, Chemical and Biological Sensing for Industrial and Environmental Security, A.J. Sedlacek, ed., Proc. SPIE 5994, 59940G-1-59940G-10, 2005.
(18) A. S. Kwok and R. K. Chang, Opt. Lett. 18, 1703–1705 (1993).
Ian M. White, Hesam Oveys, and Xudong Fan are with the Biological Engineering Department, University of Missouri-Columbia, Columbia, Missouri. Please direct correspondence to fanxud@missouri.edu


Nanometer-Scale Studies Using Tip Enhanced Raman Spectroscopy
February 8th 2013Volker Deckert, the winner of the 2013 Charles Mann Award, is advancing the use of tip enhanced Raman spectroscopy (TERS) to push the lateral resolution of vibrational spectroscopy well below the Abbe limit, to achieve single-molecule sensitivity. Because the tip can be moved with sub-nanometer precision, structural information with unmatched spatial resolution can be achieved without the need of specific labels.


