Infrared Analysis for the Busy Crime Laboratory — Getting the Most Out of Illicit Drug Analysis Using FT-IR and GC–MS
According to the Scientific Working Group for the Analysis of Seized Drugs (SWGDRUG), techniques with the highest discriminating power should preferentially be used for forensic identification of seized drugs.
Mike Garry, Thermo Fisher Scientific
According to the Scientific Working Group for the Analysis of Seized Drugs (SWGDRUG), techniques with the highest discriminating power should preferentially be used for forensic identification of seized drugs. Table I shows the analytical technique categories listed in order of decreasing discriminating power from A to C. SWGDRUG recommends at minimum that when a Category A technique is used, at least one other technique of any category must also be used. In practice, many drug labs choose GC–MS since this addresses the recommendation and they get credit for the two techniques — MS (Category A) & GC (Category B). However, this recommendation is a minimum and many labs are finding that GC–MS is not always the best choice for the particular sample they are analyzing.

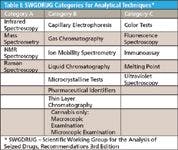
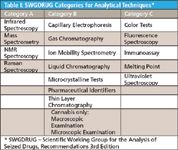
Table I: SWGDRUG Categories for Analytical Techniques
Infrared spectroscopy can do things GC–MS can't, such as analyzing drugs in salt form and uniquely identifying certain stereoisomers. It is also an excellent rapid-screening tool. In fact, in most federal labs, infrared analysis is a requirement.
Modern high-sensitivity FT-IR spectrometers with easy to use sampling techniques can provide useful confirmation of a drugs identity quickly, using a minimal amount of sample. An innovative new search algorithm offered by Thermo Fisher can identify mixtures in a single step without data manipulation and without the need for a high degree of operator expertise.
The combination of GC–MS with modern FT-IR spectrometers, sample handling techniques, and mixture identification software provides a powerful set of tools for illicit drug identification. It allows today's forensic scientist to analyze, identify, and confidently support their findings where it matters most — testifying in court — to help get convictions.
Case Study — Analysis of Confiscated Date-Rape Tablets
The following example will be used to demonstrate the power of combining GC–MS and FT-IR to obtain more compelling results. In an actual case, drug tablets were confiscated from a patron outside a nightclub. Figure 1 shows what look like homemade tablets that were taken as evidence during the arrest.


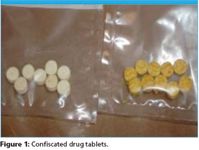
Figure 1
Back in the chemistry lab, a quick screening was done using the Thermo Scientific Nicolet iS10 FT-IR spectrometer equipped with an attenuated total reflectance accessory with diamond crystal as shown in Figure 2. This allowed rapid analysis of the evidence using only a milligram of sample followed by spectral searching against reference spectra of common illicit drugs. This yielded the results for sample 2A as shown in Figure 3. This result was obtained using a single search with the OMNIC Specta software's Multi-Component Search routine with four components selected and no additional processing. The total time for this analysis from sample placement to result was about 5 min.


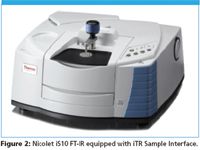
Figure 2
This "screening" gave the analyst a good starting point for their additional testing. Since methamphetamine was seen as a major component the samples were prepared for injection and analysis on the Thermo Scientific DSQ GC–MS system using the pre-programmed Amphetamine method in the Xcalibur software.

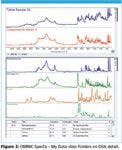
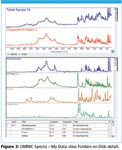
Figure 3
Table II shows a comparison of the test results for the analysis by GC–MS and FT-IR for one of the confiscated tablets. The components are listed in order of relative retention time on the GC, not in order of relative abundance. With one exception all of the components were identified in the FT-IR search result. The MDMA was not identified by the FT-IR. Its peak was barely visible on the GC–MS chromatogram trace, thus was below the detection limit for the FT-IR. Notwithstanding this discrepancy, these results make a very compelling story for presentation as evidence in a court of law.

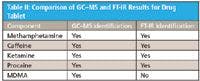
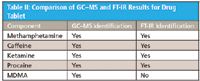
Table II: Comparison of GCâMS and FT-IR Results for Drug Tablet
Summary
For those familiar with the use of FT-IR analysis, the analysis results presented in the case study are quite amazing. The ability to analyze mixtures by FT-IR has long been one of the biggest barriers to its use. Without the mixture searching capability found in the OMNIC Specta software, this type of analysis requires a relatively high level of operator expertise using multiple data processing steps, and has a high degree of uncertainty. In this case, the only requirement is to have the appropriate reference spectra to complete the search.
With this new found searching capability the forensic scientist is able to build a better case and support it with very little extra effort using an independent Category A technique. This allows them to exceed to minimum SWGDRUG recommendation and have more solid ground to stand on when they testify.


Thermo Fisher Scientific
Madison, WI
tel. (800) 532-4752
Website: www.thermo.com


Accurate Microplastics Analysis in Minutes, Not Hours
April 10th 2024The automated Agilent 8700 LDIR chemical imaging system lets you obtain high-quality images and spectral data faster than ever before. So, you can perform confident large-scale microplastics studies and monitoring activities.

