Infrared Analysis of Self Assembled Monolayers
Self-assembled monolayers (SAMs) can be applied in a variety of technical areas. Infrared characterization of these materials is a challenge because of the low concentrations on the surfaces. This article reviews the sampling methods for characterization and presents data comparing the different approaches.
Self-assembled monolayers (SAMs) can be applied in a variety of technical areas. Infrared characterization of these materials is a challenge because of the low concentrations on the surfaces. This article reviews the sampling methods for characterization and presents data comparing the different approaches.
Self-assembled monolayers (SAMs) have been used to produce ultrathin, ordered films in a number of technical areas. Initial work on SAMs was published in 1946 (1), but the field has grown tremendously over the past 25 years. SAMs are used in a variety of applications. A quick search on Google Scholar shows applications in material science, biology and biochemistry, sensors, electrochemistry, and nanotechnology.
SAMs are typically assembled on metal or metal oxide surfaces. Other substrates such as glass are also used depending on the application. Characterization of these ultrathin films can take many forms. Scanning probe microscopy techniques provide morphological information. Electrochemical characterization is also used. Infrared (IR) and Raman spectroscopies are used routinely to characterize these supramolecular systems.
Methods of Infrared Characterization
Three methods are available to probe the chemistries of these materials in the infrared, each with their own advantages and disadvantages. In some cases, the techniques provide similar results and the choice can be made based on simplicity and cost. In other cases, the choice is not as simple.
Infrared Reflection Absorption Spectroscopy (IRRAS)
Very thin coatings on metal surfaces can be examined by reflection of the IR radiation from the substrate to the detector in a specular reflectance mode.
Specular reflectance is an external reflection method in which light is reflected from a smooth solid surface where the angle of incidence on the sample is exactly equal to the angle of reflection. Specular reflection spectroscopy comprises two distinct types of examinations. The first consists of a metal (a highly reflecting substrate) on which a material has been deposited (for example, films or contaminants). This would be the type of examination applicable to SAMs. The second type of reflection examination involves the reflection from the front surface of a sample (similar to a reflection from a mirror surface).
In the situation of a coating on a reflective surface, the IR beam that is reflected from the metal surface interacts with the coating (sample). As the metal is generally noninteracting, the resulting spectrum is actually an absorption spectrum of the coating material (that is, a reflection-absorption spectrum).
In the infrared reflection absorption spectroscopy (IRRAS) experiment, as the angles of incidence and therefore reflection change from near normal to near grazing, the pathlength increases providing more sample to interact with the IR radiation.
Films that are thinner than the wavelength of light do not give rise to a spectrum when the light is perpendicular to the surface since the standing wave has a node at the surface. There is no interaction with the sample. Parallel (p or 90°) polarized radiation on the other hand was shown by Greenler (2) to have a significant enhancement in the intensity for an absorbing species at close to grazing angle. This effect has been exploited in studying SAMs.
Most sampling accessories have been designed so that the sample is placed face down on a horizontal supporting stage. A high polished substrate (for example, shiny aluminum or a silver or gold mirror) is used for the collection of the reference background for ratioing. The amount of light reflected from a sample is usually quite low, only a few percent, so longer scan times are typical to obtain good signal-to-noise ratios. Experiments such as this have been performed on monolayers with thicknesses of approximately 1 nm.
Figure 1 shows a schematic of a commonly available specular reflectance accessory (Pike 80Spec). With a sample in this accessory, a polarizer is placed in the beam before the sample. Typically, a mercury-cadmium-telluride (MCT) detector and thousands of scans are necessary to obtain good spectra.

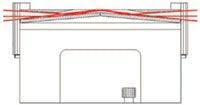
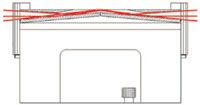
Figure 1: The optical layout of a fixed-angle specular reflectance accessory (Pike 80Spec).
A number of accessories are available to collect this type of data. Some have fixed angles, as with the one shown in Figure 1, and some offer more flexibility and allow multiple angles of incidence.
This technique has three major disadvantages. The first is that one needs to have a clean sample to use as a background. Some of the substrates used (gold, in particular) will react with air and you never have a "pure, clean" surface. An even worse problem is that because the sample itself is so thin, the absorbances are very low. Minor changes in water vapor may show up in the spectrum and may actually be larger than the analytical bands of interest. The third problem is one of dynamic range. In the IRRAS experiment, the sample signal is very low compared to the total energy reaching the detector, especially at the centerburst. Placing a polarizer in the beam will help this situation, but the dynamic range problem can still exist.
Attenuated Total Reflection Spectroscopy
Attenuated total reflection (ATR) spectroscopy has been applied to spectroscopic analysis in many areas. The most common application is the analysis of a sample that cannot be interrogated any other way. Samples such as plastic parts, powders, and gels can all be analyzed by ATR.
This technique relies on total internal reflection. The sample is brought into direct contact with a prism that has a refractive index much higher than the sample. When the angle of incidence of the light into the crystal exceeds the critical angle, total internal reflection takes place. When this total internal reflection occurs, the light penetrates slightly into the sample and produces an absorbance-like spectrum.
The depth of penetration into the sample is governed by two factors: the angle of incidence of the light and the refractive index of the crystal used as the ATR element. At steeper angles, the penetration depth is greater, and with higher refractive indices, the penetration depth is smaller. Using various combinations of these two parameters has led to the ability to profile into a sample over depths of approximately 0.5–45 µm.
A variation on this technique, grazing-angle attenuated total reflection, was first described by Harrick (3) but was not applied extensively until fairly recently. Commercial accessories, using a Ge prism at a 65° angle of incidence and a polarizer with p-polarization have been used to collect spectra of monolayers on surfaces with enhanced sensitivity as described by Harrick.
Polarization Modulation Infrared Reflection Absorption Spectroscopy
Dowery and Marcott (4) published a method in 1982 to address the dynamic range issue and provide better spectra. Capitalizing on work done by Nafie and Vidrine (5) on polarization modulation to measure vibrational circular dichroism spectra, the authors inserted a photoelastic modulator into the beam and modulated the polarization between s and p. This polarization modulation infrared reflection absorption spectroscopy (PM-IRRAS) experiment, implemented in the continuous scan mode, requires a lock-in amplifier (LIA) to demodulate the signal that is then sent to the analog-to-digital converter.
This method uses a set of electronic filters and an LIA along two parallel signal paths (Figure 2). The top path, as shown in Figure 2, after a high pass filter, demodulates for polarization modulation. The output of the LIA provides the dichroic difference spectrum between s- and p-polarized light, often called the AC spectrum.

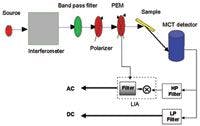

Figure 2: Layout of the polarization modulation infrared reflection absorption spectroscopy (PM-IRRAS) experiment using lock-in amplifiers (LIAs).
Because the electric field of s-polarized light has a node at the surface of a metallic substrate, the dichroic difference, Rp – Rs , is the only polarization-sensitive component in the optical path. The upper signal path is sensitive only to the thin film on the substrate, allowing the surface signal to be digitized with high dynamic range, thereby enhancing the sensitivity for analysis of such samples. In the lower path, the detector is low-pass filtered to eliminate the high frequency photoelastic modulator (PEM) component, providing the single beam spectrum of the substrate and the environment in the sample compartment.
The final step of data processing is to ratio the AC to the DC spectrum to obtain the surface spectrum with high sensitivity and free from atmospheric contamination and other artifacts.
The experiment described above requires LIAs in addition to the polarizer and a PEM. It was substantially improved on by Curbelo (6) when he applied digital signal processing to eliminate the added hardware on a step-scan instrument. This experiment capitalized on the fact that there are multiple modulations from the interferometer and modulator. These modulations are separated in time and can be "deconvolved" using the mathematical algorithms as outlined in the Curbelo patent. In the diagram shown in Figure 3, the added hardware is replaced by a software algorithm, considerably simplifying the experiment.


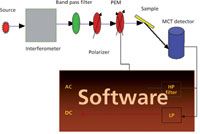
Figure 3: Layout of the PM-IRRAS experiment with software demodulation. Note the elimination of the lock-in amplifiers.
This software algorithm replaces the lock in amplifiers and electronics in the red box in Figure 3. More information on the algorithm and its implementation can be found in work done by Drapcho (7).
This technique eliminates the need for additional hardware and has the advantage of a "reference-less" experiment to minimize the water vapor. This approach does suffer from a financial standpoint, because the experiment requires a more complicated Fourier transform infrared (FT-IR) instrument capable of step-scan data acquisition.
Experimental Data
In light of all the choices for the analysis of monolayers, how does a scientist decide what is the appropriate analysis method? Part of this decision depends on the substrate and part depends on the monolayer material.
For example, IRRAS is best done on metallic substrates because absorbing substrates contribute to distorted spectra. So if the sample is on a substrate that absorbs, the better choice is to use a grazing-angle ATR experiment.
Similarly, if the sample of interest has a feature that can be obscured by water vapor, a polarization modulation approach might be better — the contribution from water vapor is eliminated because the background is collected at the same time, from the same substrate. This strategy also works well if the substrate is reactive and a clean representative material is difficult to obtain.
As described above, all of these techniques require that the input IR radiation is polarized and the substrate must be reflective.
Figure 4 shows the spectrum obtained from the specular reflection experiment using a fixed-angle specular reflection accessory (Pike 80Spec). This spectrum was collected using a linearized MCT detector and a scan time of approximately 10 min. This experiment usually requires more time to clear the water vapor from the sample compartment than it does to collect the spectrum.

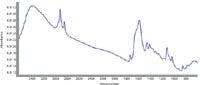
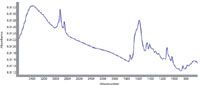
Figure 4: Spectrum of a thin film on gold substrate obtained using a fixed-angle specular reflectance accessory (Pike 80Spec).
As the spectrum indicates, absorbances are very low because of the low concentration on the surface as well as the single reflection that was used.
Another accessory that can be used to collect grazing-angle data is a variable-angle specular reflectance accessory. This is more flexible because the angle of incidence can be varied allowing for the analysis of many types of samples. Figure 5 shows data of another type of monolayer material taken using an accessory that allows the angle of incidence to be varied (Pike VeeMax).

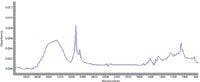
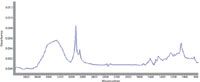
Figure 5: Spectrum of a monolayer obtained using a variable-angle specular reflectance accessory (Pike VeeMax).
Figure 6 shows the results from a proprietary monolayer sample using grazing-angle ATR with p-polarization and a linearized MCT detector. Here, the absorbances and the spectral quality are both higher. Again, this method suffers from the effect of water vapor, and the spectrum presented has the water vapor subtracted out of it.

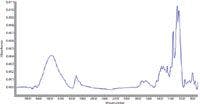
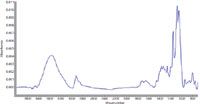
Figure 6: A spectrum of a monolayer using a grazing-angle ATR accessory with p-polarization.
Figure 7 shows a spectrum resulting from the PM-IRRAS experiment on another type of monolayer sample. Once again a linearized MCT detector was used, but as described above, the polarization is modulated. Here, the benefit of the reference-less approach is apparent. Water vapor is not present in this spectrum even considering the low level of the bands. The OH at approximately 3500 cm-1 is not masked by water vapor and the amide carbonyl is so clean that a derivative spectrum could easily be calculated to determine secondary structure if necessary.

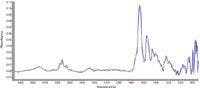
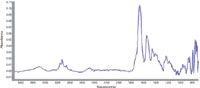
Figure 7: A spectrum obtained from the PM-IRRAS experiment using the method described by Curbelo.
Conclusions
Self-assembled monolayers are studied extensively by FT-IR. Many sampling techniques exist to collect those data. Each has benefits and drawbacks. In general, as the quality of the data improves the complexity of the experiment goes up. But the higher quality data allows scientists to examine samples in layers that are thinner or are composed of moieties with weaker absorption coefficients.
Acknowledgments
Thanks to Jenni Briggs for the spectra collected using the Pike 80Spec and the VeeMax.
Ellen V. Miseo is a Senior FT-IR Spectroscopist at Analytical Answers, Inc., in Woburn, Massachusetts. Direct correspondence to: marketing@analyticalanswersinc.com.
References
(1) C.C. Bigelow, D.L. Pickett, and W.A. Zisman, J. Colloid Interface Sci. 1, 513 (1946).
(2) R.G. Greenler, J. Chem. Phys. 44, 10 (1966).
(3) N.J. Harrick and F.K. DuPre, Appl. Opt. 5, 1739 (1966).
(4) A.E. Dowery and C. Marcott, Appl Spec. 34, 4 (1982).
(5) L.A. Nafie and D.W. Vidrine, in Fourier Transform Infrared Spectroscopy, Application to Chemical Systems, J.R. Ferraro and L.J. Basile, Eds. (Academic Press, New York, New York, 1981), Vol. 3.
(6) R. Curbelo, US patent #6025913, (2000).
(7) D. Drapcho, J. Wilson, R. Crocombe, and M. Boerger, "Digital Signal Processing in Infra-Red Polarization Modulation Experiments II: Infrared Reflection Absorption Measurements of Self-Assembled Monolayers", presented at The First International Conference on Advanced Vibrational Spectroscopy (ICAVS-1), Turku, Finland, 2001.


Measurement of Ammonia Leakage by TDLAS in Mid-Infrared Combined with an EMD-SG Filter Method
April 9th 2024In this article, tunable diode laser absorption spectroscopy (TDLAS) is used to measure ammonia leakage, where a new denoising method combining empirical mode decomposition with the Savitzky-Golay smoothing algorithm (EMD-SG) is proposed to improve the signal-to-noise ratio (SNR) of absorbance signals.


