Infrared Spectroscopy: New Frontiers Both Near and Far
Spectroscopy
This article illustrates experience with some new developments in IR spectroscopy, with examples of how this traditional field continues to explode into new territory, enabling rapid acquisition of huge data sets on the one hand, while permitting exploration of chemical composition of targets with nanometer-scale spatial resolution on the other.
Until very recently, the conventional optical resolution limits for far-field infrared (IR) imaging were ~5–10 µm, given the 2–25 µm wavelengths and the typical optics of mid-IR microscopes. In 2011, the diffraction limit for far-field IR was achieved with synchrotron source light, high numerical aperture (NA) optics, and a focal plane array detector. Comparable capability for thermal-source IR microscopes is now commercially available. Single-wavelength scanning, with quantum cascade lasers, and fast, full spectrum imaging, with focal plane array detectors, permit collection of infrared images on samples with dimensions on the order of centimeters, within minutes. Near-field IR techniques embody a conceptual paradigm shift, preserving the analytical power of IR spectroscopy, while breaking the diffraction limit constraints for a 100-fold improvement in spatial resolution. Exploration of the chemistry of materials at micrometer and nanometer scales leads to a better macroscopic perspective, as illustrated here with examples from our ongoing research in materials, environmental, and biomedical applications.
Infrared (IR) spectroscopy has been a reliable workhorse in research, industry, and education for many decades. The basic principles are well understood (1), and are embedded in various ways through commercial and in-house designed instruments. Whether acquired in transmission or transflection, attenuated total internal reflection, diffuse reflectance, or grazing angle incidence, in bulk, or through an infrared microscope, the strengths and weaknesses have been well defined for decades. Recently, several transformative conceptual breakthroughs and innovations that work beyond the traditional instrumental designs have opened up exciting new avenues for application.
In far-field IR spectromicroscopy, imaging and even oversampling relative to the diffraction limit was only achieved in 2011 (2). Despite these advances, all IR spectromicroscopy has been subject to the fundamental physical limitations of diffraction; to be specific, the inescapable fact that the size and separation of resolvable features is directly proportional to the IR wavelengths, at best ~1 µm for the OH, NH stretch region, and 3–5 µm for the fingerprint region. The transformative breakthrough of near-field IR is based on coupling the nanoscale focus of atomic force microscopy with infrared illumination. In my laboratory, we have applied some of these new techniques to imaging of heterogeneous materials, at length scales that range from several centimeters down to nanometers. This article illustrates our experiences with a few of these new developments, with some examples of how this traditional field continues to explode into new territory, enabling rapid acquisition of huge data sets on the one hand, while permitting exploration of chemical composition of targets with nanometer-scale spatial resolution on the other.
Methods
Targets
Samples for high spatial resolution, and for large-scale, rapid imaging, are taken from our studies on biological targets. Sample acquisition and tissue preparation are described elsewhere for snap-frozen mouse brain tissue (3) and rat heart (4). Healthy rat heart was cryosectioned at 7 µm from a frozen block that had been embedded in optimal cutting temperature medium (TissueTek OCT, Sakura). Normal mouse brain (C57BL/6) was similarly embedded and cryosectioned onto low-e reflective slides (MirrIR, Kevley Technologies). Near-field IR spectra and images have been used to assess yeast cell walls (Saccharomyces cerivisiae). Cells were grown in standard agar medium overnight; a few drops of purified (MilliQ) water were placed onto the new growth, removed, and deposited onto either a gold-coated silicon wafer or a BaF2 window. A purified water rinse was used to remove traces of medium.
High Spatial Resolution Imaging
Experiments for high spatial resolution imaging on a conventional Fourier transform infared (FT-IR) microscope with high numerical aperture (NA) optics and focal plane array (FPA) detection were performed on a commercial FT-IR microscope (Agilent Cary 620, with either 64x64 or 128x128 FPA, located in our lab at the University of Manitoba and the Advanced Light Source, Lawrence Berkeley National Laboratory, respectively). With 25x objectives (NA= 0.81) and a 128×128 FPA detector, image pixels have a nominal geometric spatial resolution of 3.3 µm. Optionally, additional magnification in front of the detector reduces this resolution value to a nominal 0.7 µm/pixel. Spectral acquisition and data processing were accomplished with the ResolutionsPro FT-IR spectroscopy software.
Rapid Imaging of Large Tissue Sections
Experiments for rapid imaging of entire tissue sections were conducted with a prototype rapid scan instrument (Agilent Laser Direct Infrared [LDIR] Imaging Analyzer), equipped with a tunable quantum cascade laser (QCL), rapid scanning optics, and a single-point thermoelectrically cooled detector, and with conventional far-field IR microscopes, as described above.
sSNOM-Style Near-Field IR Nanospectroscopy
NFIR spectra and images have been acquired with the in-house designed or built synchrotron infrared nanospectroscopy (SINS) end station and a commercial scattering scanning near-field optical microscopy (sSNOM) instrument (Neaspec, GmbH), located at the Advanced Light Source, Lawrence Berkeley National Laboratory. Both instruments are illuminated by broad-band synchrotron radiation.
Results
High Spatial Resolution Imaging
We have been testing the detail that can be achieved to distinguish physically distinct entities; in this case, that would be skeins of collagenous webbing that hold cardiomyocytes in heart muscle. For the normal magnification, far-field conventional microscope images (25x, 3.3 µm) example, healthy rat heart was cryosectioned at 7 µm and mounted on a BaF2 window. The structure of the heart is designed for optimal torque as the cardiomyocytes contract and release, pumping blood through the vessels. The myocytes are arranged on a thin collagenous matrix (6,7).
The spectral signature of collagen Type I is well known, and is readily distinguished from normal muscle, given the differences in the amide bands, as well as the absence of lipid bilayer membranes in the collagen (Figure 1a). The cardiomyocytes were characterized by the symmetric CH2 stretching band at 2852 cm-1, and the collagen by the unique profile of the amide III region, with peaks at 1204, 1240, 1284, and 1337 cm-1. The structure–function relationship is evident in the white light photomontage of the left ventricle (Figure 1b), where the arc of muscle cells indicates the direction of torsional action. The black box outlines the region imaged at 25x, normal magnification; the mosaic has been processed on the 1204 cm-1 collagen band. Although the heart muscle cells are thick and their infrared signature is easily discerned, it is much more difficult to detect the slender collagenous webbing that defines the heart structure. The white light image shows regions that might be collagen but the 25x objective with 3.3-µm pixels is required to isolate this faint tracery (red boxes 1 and 2, Figures 1c and 1d). Structural collagen holds blood vessels to the muscle cells (1, blue spectrum); the collagen matrix supports and defines the overall structure (2, black spectrum) (Figure 1d). Note: we found that the pixels with the 15x objective (5.5 µm) were too large, because collagen signal was lost within the adjacent cardiomyocytes, whereas use of the higher magnification optics (1.1 µm at 15x, or 0.7 µm at 25x) had a poorer signal-to-noise ratio, and again the collagen was hard to discern. These results illustrate some of the tradeoffs and choices required for such imaging, including considerations of key features in heterogeneous targets.


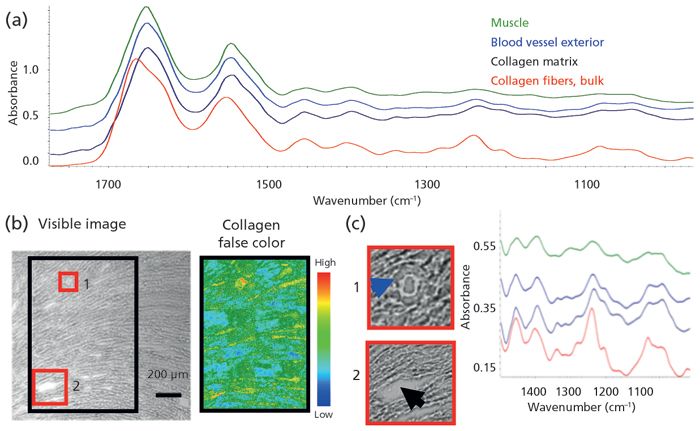
Figure 1: High spatial resolution imaging of cardiac section from rat heart reveals collagen anchoring blood vessels and binding myocytes to establish structure-function relationship.
Rapid Imaging of Large Tissue Sections
A saggital section of mouse brain is several millimeters in length and width, a sample size that is common to numerous types of tissue section, whether heart, brain, or biopsy, and that size has presented significant challenges for infrared imaging. By binning multiple pixels, or imaging at preset large pixel sizes (20-50 µm), it is possible to cover the entire section, but depending on the setup, acquisition can still take several hours and the image pixilation becomes increasingly crude, so that critical information is lost. Two different solutions are shown here.
QCL, Single-Wavelength Contrast Imaging
A section mounted on a low-e glass slide (Figure 2a), imaged with the processed QCL image (Figure 2b), shows the gray matter and white matter contrast obtained from the intensity recorded at 1735 cm-1 (fatty acid ester carbonyl) relative to intensity at two baseline points. Pixel size is close to the diffraction limit for this wavelength, at 5 µm. The imaged area, 6.420 mm × 15.070 mm, consists of 3.87 x 106 pixels, and the elapsed time to acquire the image was only 10 min. In this simple contrast image, the darker pixels correspond to low lipid content, typical of cell bodies, and the white regions correspond to high lipid content, typical of white matter. The detail achievable is further highlighted in the expanded, higher resolution image of the cerebellum, with data collected as a sum of three scans, a nominal pixel dimension of 3 µm, and a total scan time of 7.3 min (Figure 2c). This approach, and other instruments based on QCL (7), allow for tissue imaging in effectively real time. Different implementations of this approach can result in scattering artifacts, but these can be addressed either with a focused beam, rapid scan instrument such as the one used here, or with post-processing of the specular scatter that arises from nonfocused QCL beams. Operation in transflectance mode introduces other scatter anomalies. However, whether in transmission or transflection, some scatter persists. Mathematical analyses and physical models to address these issues are being developed in tandem, but are beyond the scope of this article.

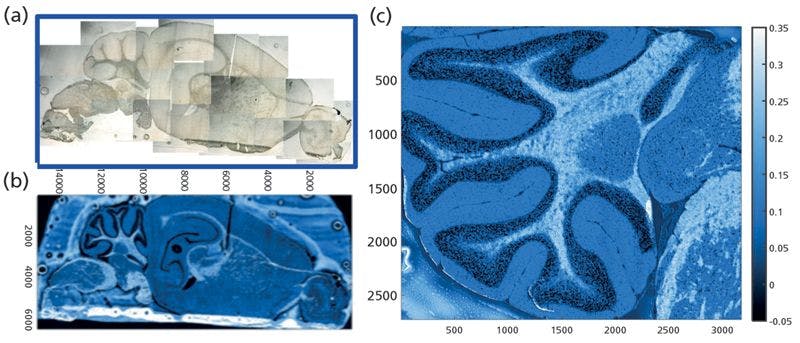

Figure 2: Single-wavelength contrast image of mouse brain section obtained with QCL tuned to lipid carbonyl at 1735 cm-1 against two baseline points. Pixel size: 5 µm; total pixels: 3.87M; total time: 10 min.
Far-Field, Full-Spectrum FT-IR Imaging with Conventional IR Microscope and Focal Plane Array
Similar images, in transflectance or transmission mode, can be obtained nearly as rapidly with a conventional FT-IR instrument and a large-area FPA detector.
The mosaic in Figure 3a was acquired at a nominal 5-µm pixel resolution, and consists of 130 tiles, or ~ 2.1 x 10⁶ spectra. The false color image shows distribution of gray and white matter with the usual rainbow false-color processing from high (red) to low (blue), based on the lipid CH stretch band. By choosing a shorter wavelength, the sample image has been oversampled. Smaller pixels are still feasible, and fewer scans can still provide desired information. Spectra recorded at 8 cm-1 from this image are shown in Figure 3b, and a close-up of the cerebellum is shown in Figure 3c (visible image) and Figure 3d (processed on the integrated intensity of the same band). Although this image took about 50 min to acquire, the advantage here is that the entire spectrum (4000-900 cm-1) is obtained at each pixel, allowing assessment of possible scattering and background issues, and the images are obtained in far less time than would be required if full spectra were sought with the QCL approach. The latter approach is most useful when speed of acquisition is critical and potential variations in the targets are well-characterized.

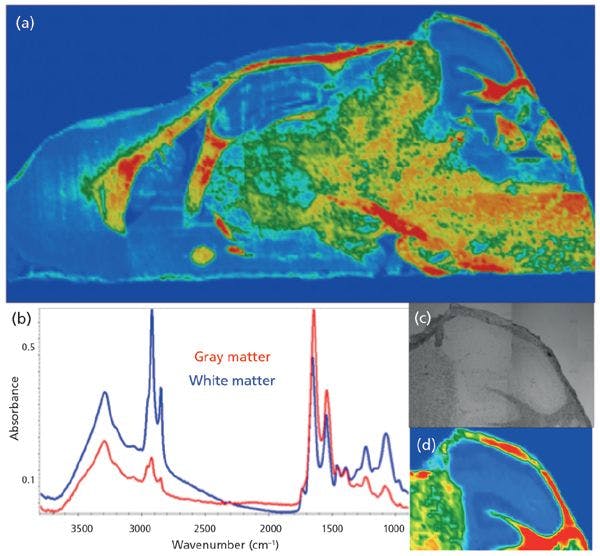

Figure 3: Conventional FT-IR mosaic image of mouse brain section mounted on low-e slide; processed on the integrated intensity of the symmetric CH stretch band at 2852 cm-1.
sSNOM-Style Near-Field IR Nanospectroscopy
Near-field IR techniques couple infrared light (synchrotron source or laser) to the tip of an atomic force microscope for spatially resolved IR spectroscopy, and imaging well beyond the diffraction limit (8,9). Several implementations are now possible; we have used the sSNOM approach to achieve what appears to be the maximum resolution to date, with a probe voxel edge on the order of 20 nm (10).
A typical spectrum of the S. cerevisiae cell wall, extracted from the far-field FT-IR image, shows the expected protein amide bands and contributions from sugars, phosphates, and other cell content (Figure 4a, spectrum 1, blue), taken from the region inside the blue box in Figure 4b. In contrast, two near-field IR spectra acquired with the sSNOM SINS set up at Advanced Light Source are dominated by the polysaccharide wall composition (red and black spectra, Figure 4a) recorded at the budding tips (locations 2 and 3, Figure 4c). The ovoid shape of these cells made it difficult to obtain good spectra; however, these are the first such spectra obtained by sSNOM and improvements can be envisioned.

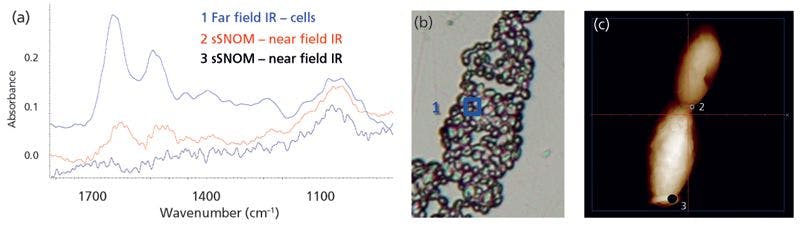

Figure 4: Far-field and near-field spectra from a cell of the common yeast Saccharomyces cerevisiae. Far-field IR spectra of cells were obtained in transmission for cells on a BaF2 window and sSNOM-SINS spectra were acquired at the Advanced Light Source.
Conclusion
Rapid, detailed imaging of relatively large targets with far-field IR generates massive amounts of data. Near-field IR is still in its infancy, but is evolving quickly. Developments in both areas are creating excellent opportunities for new exploration at micrometer and nanometer length scales, ultimately for better macroscopic understanding.
Acknowledgments
Data collection and figure preparation were conducted by several members of my group: Negar Atefi, Tanvi Vakil, Zahra Abyat, Sarvesh Ramlochun, and Gorkem Bakir. Heart tissue was generously donated by Professor Ian Dixon, University of Manitoba; brain tissue was donated by Professor Benedict Albensi, University of Manitoba. Thanks to Dr. Hans Bechtel (ALS, LBNL, Berkeley) for assistance in the collection of near-field IR data and images; this research used resources of the Advanced Light Source, which is a DOE Office of Science User Facility under contract no. DE-AC02-05CH11231. Thanks are also extended to Dr. Chris Moon and Dr. Matthew Kole, Agilent Technologies. ZA and GB are supported by University of Manitoba GETS scholarships; NA and TV have received University of Manitoba Faculty of Science Undergraduate Research Awards. This work is funded by NSERC Canada and CIHR.
References
(1) P.R. Griffiths and J.A. de Haseth, Fourier Transform Infrared Spectrometry (John Wiley & Sons, New York, New York, 2006).
(2) M.J. Nasse, M.J. Walsh, E.C. Mattson, R. Reininger, A. Kajdacsy-Balla, V. Macias, R. Bhargava, and C.J. Hirschmugl, Nat. Methods 8(5), 413–416 (2011).
(3) C.R. Findlay, R. Wiens, M. Rak, J. Sedlmair, C.J. Hirschmugl, J. Morrison, M. Kansiz, and K.M. Gough, Analyst 140, 2493–2503 (2015).
(4) K.M. Gough, D. Zielinski, R. Wiens, M. Rak, and I.M.C. Dixon, Analytical Biochem. 316, 232–242 (2003).
(5) H.C. Ott, T.S. Matthiesen, S.K. Goh, L.D. Black, S.M. Kren, T.I. Netoff, and D.A. Taylor, Nat. Medicine14(2), 213–221 (2008).
(6) K.T. Weber, J. Am. Coll. Cardiol.13(7), 1637–1652 (1989).
(7) C. Kuepper, A. Kallenbach-Thieltges, H. Juette, A. Tannapfel, F. Großerueschkamp, and K. Gerwert, Sci. Rep. 8, 7717 (2018).
(8) H.A. Bechtel, E.A. Muller, R.L. Olmon, M.C. Martin, and M.B. Raschke, PNAS 111(20), 7191–7196 (2014).
(9) F. Huth, A. Govyadinov, S. Amarie, W. Nuansing, F. Keilman, and R. Hillenbrand, Nano Lett. 12, 3973-3978 (2012).
(10) R. Wiens,C. R. Findlay, S. G. Baldwin, L. Kreplak, J. M. Lee, S. P. Veres and K. M. Gough, Farad. Discuss. 187, 555–573 (2016).
Kathleen Gough is a professor with the Department of Chemistry, and the Biomedical Engineering Program, at The University of Manitoba, Winnipeg, MB, Canada. Direct correspondence to: kathleen.gough@umanitoba.ca. Tanya E.S. Dahms is a professor at the Department of Chemistry and Biochemistry, University of Regina, Regina, SK, Canada. Benedict C. Albensi is a professor, and Manitoba Dementia Research Chair, at The University of Manitoba, Winnipeg, MB, Canada. Ian M.C. Dixon is a Principal Investigator Molecular Cardiology, Institute of Cardiovascular Sciences and Professor, Department of Physiology and Pathophysiology, at the University of Manitoba, Winnipeg. MB, Canada. Negar Atefi, Tanvi Vakil, Zahra Abyat, Sarvesh K. Ramlochun, and Gorkem Bakir are students with the Department of Chemistry, and the Biomedical Engineering Program, at The University of Manitoba, Winnipeg, MB, Canada.


Getting accurate IR spectra on monolayer of molecules
April 18th 2024Creating uniform and repeatable monolayers is incredibly important for both scientific pursuits as well as the manufacturing of products in semiconductor, biotechnology, and. other industries. However, measuring monolayers and functionalized surfaces directly is. difficult, and many rely on a variety of characterization techniques that when used together can provide some degree of confidence. By combining non-contact atomic force microscopy (AFM) and IR spectroscopy, IR PiFM provides sensitive and accurate analysis of sub-monolayer of molecules without the concern of tip-sample cross contamination. Dr. Sung Park, Molecular Vista, joined Spectroscopy to provide insights on how IR PiFM can acquire IR signature of monolayer films due to its unique implementation.


Achieving Accurate IR Spectra On Monolayer of Molecules
April 18th 2024Creating uniform and repeatable monolayers is incredibly important for both scientific pursuits as well as the manufacturing of products in semiconductor, biotechnology, and. other industries. However, measuring monolayers and functionalized surfaces directly is. difficult, and many rely on a variety of characterization techniques that when used together can provide some degree of confidence. By combining non-contact atomic force microscopy (AFM) and IR spectroscopy, IR PiFM provides sensitive and accurate analysis of sub-monolayer of molecules without the concern of tip-sample cross contamination. Dr. Sung Park, Molecular Vista, joined Spectroscopy to provide insights on how IR PiFM can acquire IR signature of monolayer films due to its unique implementation.

