Investigating Crystallinity Using Low-Frequency Raman Spectroscopy: Applications in Pharmaceutical Analysis
Application Notebook
Crystallinity is an important factor when producing pharmaceuticals because it directly affects the bioavailability of the drug. Low-frequency Raman spectroscopy offers some advantages to the detection and analysis of crystallinity in pharmaceutical samples. Here the experimental requirements for low-frequency Raman measurements are described. The application of the technique to the study of crystallinity with a number of examples is discussed and the advantages and limitations are highlighted and compared with other techniques.
Raman spectroscopy is typically a nondestructive technique that uses lasers to probe for information about intra- and intermolecular bond vibrations. It involves irradiating the sample with monochromatic light to excite molecules within the sample to a virtually excited state. The molecules then relax to a higher (Stokes scattering) or lower (anti-Stokes scattering) vibrational level-resulting in the scattered light being lower or higher in frequency than the irradiating photons, respectively. Raman scattering is produced when this inelastic scattering occurs, and can be used to deduce information about the nature of the sample. Relative to the incident light, Raman scattering is a rare phenomenon, occurring in only 10-6 of the irradiated molecules (1). What occurs more commonly is elastic scattering, Rayleigh scattering, where the light emitted from the sample has the same energy as the incident light. The intensity of Raman scattering is determined by whether the vibrational mode of the molecule has a change in polarizability along its normal coordinate-similar to how infrared (IR) spectroscopy requires a changing dipole moment (1). For example, H2O has vibrational modes that have large dipole moment changes along the normal coordinate and as such it has strong IR bands. However, as H2O is an σ-bonded compound, the electrons have low polarizability and the change in polarizability with vibration is also low, hence the Raman scattering is weak. Conversely, the active pharmaceutical ingredients (APIs) in many drugs are generally π-bonded and easily polarizable, thus producing strong features in Raman spectra (2). This is one of the reasons why Raman spectroscopy is actively used in pharmaceutical studies.
Crystallinity and Why It Is Important for Pharmaceuticals
The term crystalline is used to describe solids in which the atoms or molecules are arranged in an ordered manner. For many pharmaceuticals, the crystalline form is more kinetically stable than the amorphous form, which typically results in crystalline solids being less soluble, and therefore less bioavailable than their amorphous counterparts. The influence that crystallinity has over the solubility of a solid is what makes this an important factor when manufacturing pharmaceuticals, as those which are supposed to be fast-acting should be readily soluble in the body, while slow-acting drugs should dissolve relatively slowly. This has been shown to be the case in previous studies of bioavailability of APIs in the literature (3–5). Because of this, it is important to be able to control the crystallinity of a drug and monitor it. However, the crystallinity of a sample cannot be assumed to be simply either 100% ordered or 100% amorphous. Instead, the literature has indicated that disorder occurs along a continuous scale where a sample can gradually become more or less crystalline before becoming fully ordered or disordered (6). Crystallinity can be controlled in a number of different ways. One such method involves creating a fully crystalline pharmaceutical product and introducing disorder into the structure mechanically by milling the sample (4,5). Previous studies have also shown that amorphous pharmaceuticals can be produced through different drying methods (7,8). Even accidental adjustment of properties such as moisture level can lead to a change in crystallinity (9,10). Methods to monitor the crystallinity of a sample are therefore useful.
Established methods for monitoring crystallinity include calorimetry and X-ray diffraction (XRD) (6). Terahertz spectroscopy is arguably a more recently implemented method of analysis of crystallinity and is the only one of these three techniques described in any detail here. The first terahertz technique described is terahertz absorption spectroscopy or far-IR spectroscopy. The terahertz radiation has a wavelength that is between that of IR and microwaves (0.1–1 mm or 10–100 cm-1) and has the ability to allow observation of various low energy vibrations within the sample (11–13). Vibrations can essentially be divided into two categories when studying crystalline samples: external and internal vibrational modes. Internal vibrations can be considered the local vibrations that occur within each molecule (that is, intramolecular bond vibrations). External vibrations can be considered the vibrations involving the overall lattice of the crystal, such as phonon modes or torsional vibrations (14,15). Terahertz spectroscopy tends to focus on the external vibrations. The technique has been known for more than 100 years, and two experimental challenges have inhibited its widespread use. The first of these is the presence of strong water absorption above 60 cm-1, which has complicated analysis of wet samples (16) and the second is the presence of ambient terahertz radiation that compromises spectral detection (17). The second of these issues has been solved in large part with the advent of terahertz time-domain spectroscopy, also known as terahertz pulsed spectroscopy (TPS), which generates terahertz radiation using femtosecond laser pulses, using a laser wavelength of around 780 nm. For more in-depth detail about terahertz spectroscopy, refer to references 11–13. Despite its relative underutilization, this technique has been found to be an effective method for observing and even quantifying crystallinity in various papers in the literature. Model compounds such as cellulose and gelatin–amino acid mixtures have been used previously to determine the efficacy of the technique when compared to XRD (18) or to determine whether it would be an efficient method for in-line and off-line analysis of pharmaceutical crystallinity (19). In particular, the use of terahertz spectroscopy with a multivariate analysis technique-partial least squares (PLS)-permitted the quantification of the crystallinity index (CI) of cellulose (18). However, not only has the crystallinity of model systems been analyzed using the technique, drugs such as indomethacin, ketoprofen, carbamazepine, enalapril maleate, fenoprofin, irbesartan, and diclofenac acid have also been studied (11,19–23). The use of PLS also proved effective when working with pharmaceutical products, allowing not only real formulations to be distinguished from one another, but also the different crystalline forms to be distinguished. These forms were indicated by Strachan and colleagues to include polymorphic, liquid crystalline, and amorphous states (11,24). Therefore, terahertz spectroscopy has seen growing interest based on its success with the study of pharmaceuticals. Other reviews have also come to compare terahertz spectroscopy with other forms of vibrational spectroscopy for pharmaceutical analysis (25,26).
Low-Frequency Raman
Raman spectroscopy has been used for decades to analyze and characterize polymorphs (27,28); however, like terahertz spectroscopy, low-frequency Raman spectra have been used more recently (29–31). Mid-frequency and high-frequency regions of Raman spectra are typically used to analyze the intramolecular bonding of molecules within a sample (internal vibrations). However, low-frequency Raman spectroscopy involves the analysis of the low-frequency regions of Raman spectra, which tend to contain features attributable to external vibrations of the crystalline lattice (14). Frequencies in the same region as those observed with terahertz spectroscopy can be observed using standard continuous wave lasers. Because Raman scattering is such a rare process compared to Rayleigh scattering, the Rayleigh signal must be removed before recording spectra. Many ways of doing this have been developed. Until the 1990s it was most commonly performed by the use of a triple-grating spectrograph in conjunction with a photomultiplier tube (32,33). This method is reliable but because of the many mirrors and diffraction gratings necessary, the ultimate efficiency or throughput of the system is inevitably low. To compensate for this, high laser powers and long acquisition times are needed (30). A less commonly used method involves the stabilization of iodine gas at specific temperatures to allow for the absorption of the unwanted laser signal (34). However, these methods are cumbersome and it later became more common to use holographic notch or edge filters that reject light with a specific wavelength. These filters can be designed to reject nearly any wavelength of light to match that of the laser used while allowing the rest of the spectrum to pass through. This method allows for the use of more efficient single grating spectrographs. In conjunction with array detectors or charge coupled devices (CCDs) an entire Raman spectrum can be acquired simultaneously. However, the filters also block a portion of the Raman scattering signal in addition to the Rayleigh line. In most cases, the spectra can only be collected above about 100 cm-1 (35).
Over the past decade new filtering technologies have been developed that allow for the acquisition of Raman spectra reaching very close to the laser frequency (35) while using standard dispersive Raman systems with all of their advantages. These filters are typically based on holographic reflective volume Bragg gratings (VBGs) and can achieve frequencies as low as 5 cm-1 (34).
In most cases low-frequency Raman is measured using near-IR (NIR) diode laser sources for excitation. This is because the selectivity of VBGs decreases as wavelength decreases. Therefore, it is easier to acquire low-frequency Raman data with longer-wavelength lasers (34).
An issue that arises when performing low-frequency Raman measurements are artifacts caused by the laser itself (34). These may not be apparent when standard holographic filters are used because they appear so close to the laser line and would normally be blocked. These artifacts arise from laser instability, temperature fluctuations, amplified spontaneous emission, and plasma lines. VBG filters are therefore also used to clean up the laser line before it is focused onto the sample. In some optical designs a single VBG is used for both purposes simultaneously (34,35).
The resulting spectrum then allows detection of crystalline or amorphous forms, as the low-frequency Raman bands are associated with the low energy bond vibrations, hydrogen bonds, and phonon modes. Therefore, the overall environment and arrangement of the molecules will have a considerable effect on these vibrations. If the sample is crystalline, then the molecules will be highly ordered, and the low energy bond vibrations will show up in the spectrum as sharp peaks because the bonds will have a very similar environment. Conversely, if the sample is amorphous, there will be very little order and there will be a wide variety of molecular environments which, in turn, will typically produce only one broad band, known as the boson peak, and no other low-frequency features (36). Illustrations of crystalline and amorphous spectra are provided later in this article. This distinct difference between crystalline and amorphous materials is what suggests that low-frequency Raman spectroscopy could prove to be extremely useful in the study of pharmaceuticals.
Analysis
Overview of the Setup of a Low-Frequency Raman System
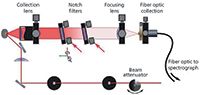
The exemplar data presented in this article were collected using two different low-frequency Raman systems, the first of which (Figure 1) is a home-built system based on a wavelength-stabilized 80-mW, 785-nm laser module (Ondax, Inc). The laser line is initially filtered by use of two BragGrate reflective VBGs (OptiGrate Corp.) to remove amplified spontaneous emission. The sample is arranged in a 135° backscattering geometry relative to a collection lens (f/2.3). The collected light is passed through a pair of VBGs (OptiGrate Corp. BragGrate 785 nm, OD3). The collimated, filtered light is then focused by a second f/2.3 lens onto a fiber-optic cable. The cable is coupled to an LS 785 spectrograph (Princeton Instruments). A third VBG is used to further filter light imaged onto the entrance slit of the spectrograph. Detection is achieved using a CCD (Princeton Instruments thermoelectrically cooled PIXIS 100 BR CCD). A typical spectral range for this experiment is about 2400 cm-1. Both the Stokes and anti-Stokes region of the spectrum can be seen in addition to a small remaining laser line signal. Raman standards such as sulfur and 1,4-bis(2-methylstyryl)benzene (BMB) are used to calibrate the spectrometer (37).


The second system is based on a pre-built SureBlock XLF-CLM THz-Raman system from Ondax Inc. The laser (830 nm, 200 mW), cleanup filters, and laser line filters are all self-contained inside of the instrument but operate on the same principles as the 785-nm system. The sample is arranged in a 180° backscattering geometry relative to a 10× microscope lens. This system is then coupled via a fiber-optic cable to a Princeton Instruments SP2150i spectrograph and PIXIS 100 CCD camera. The 0.15-m spectrograph is used in conjunction with either a 1200- or 1800-groove/mm blazed diffraction grating to adjust the resolution and spectral range.

Crystalline Versus Amorphous Samples
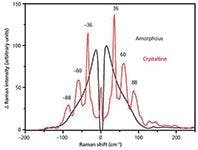
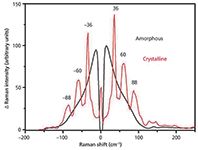
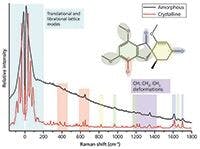
The Raman spectrum of crystalline and amorphous solids differ greatly in the low-frequency region (see Figure 2) because of the highly ordered and highly disordered molecular environments of the respective solids. However, the mid-frequency region can also be noticeably altered by the changing environment (Figure 3).


Ensuring Accuracy
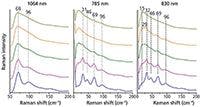
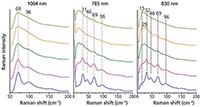
A potential issue is optical artifacts, and these may be identified by the analysis of both Stokes and anti-Stokes spectra. One advantage of the experimental setups described is that signal from the sample may be measured within minutes and it is nondestructive, thus allowing Raman spectra to be collected from a single sample using both techniques at virtually the same time. This approach permits the examination of low-frequency Raman data with 785-nm and 830-nm excitation and allows comparison with Fourier transform (FT)-Raman spectra, in which it is possible to collect meaningful data down to a Raman shift of 50 cm-1. The benefits are demonstrated in Figure 4. In this data, each technique produces consistent bands with similar Raman shifts and relative intensities. While Raman data were not collected below 50 cm-1 using the 1064-nm system, the bands at 69 and 96 cm-1 are consistent with the 785- and 830-nm data. Furthermore, the latter two methods show consistency with bands appearing around 32 and 46 cm-1 for both techniques.

Case Studies
So far there have been few studies to utilize low-frequency Raman spectroscopy in the analysis of pharmaceutical crystallinity. Despite this, the literature does contain articles that demonstrate the promising applicability of the technique.
Mah and colleagues (38) studied the level of crystallinity of griseofulvin using low-frequency Raman spectroscopy with PLS analysis. In this study a batch of amorphous griseofulvin (which was checked using X-ray powder diffractometry) was prepared by melting the griseofulvin and rapidly cooling it again using liquid nitrogen. Condensed water was removed by placing the sample over phosphorus pentoxide and the glassy sample was then ground using mortar and pestle. Calibrated samples of 2%, 4%, 6%, 8%, and 10% crystallinity were then created though geometric mixing of the amorphous and crystalline samples; following this mixing, the samples were then pressed into tablets. Many tablets were then stored in differing temperatures (30 °C, 35 °C, and 40°C) at 0% humidity. Low-frequency 785-nm, mid-frequency 785-nm, and FT-Raman spectroscopies were performed simultaneously on each sample. After PLS analysis, limits of detection (LOD) and limits of quantification (LOQ) were calculated. The results of this research showed that each of these three techniques were capable of quantifying crystallinity. It also showed that FT-Raman and low-frequency Raman techniques were able to both detect and quantify crystallinity earlier than the mid-frequency 785 nm Raman technique. The respective LOD and LOQ values for FT-Raman, low-frequency Raman, and mid-frequency Raman are as follows: LOD values: 0.6%, 1.1%, and 1.5%; LOQ values: 1.8%, 3.4%, and 4.6%. The root mean squared errors of prediction (RMSEP) were also calculated and, like the LOD and LOQ values, indicated that the FT-Raman data had the lowest error, followed by the low-frequency Raman, and mid-frequency Raman had the largest errors of the three techniques. The recrystallization tests that were performed indicated that higher temperatures showed a distinct increase in the rate of recrystallization and that each technique provided similar results (within experimental error). It is also important to note that each technique gave similar spectra (where applicable), which provides supporting evidence that the data is meaningful. Overall, the conclusions of this research were that low-frequency predictions of crystallinity are at least as accurate as the predictions made using mid-frequency Raman techniques. It is arguable that low-frequency Raman is better because of the presence of stronger spectral features and because they are intrinsically linked with crystallinity.
Hédoux and colleagues (36) investigated the crystallinity of indomethacin using low-frequency Raman spectroscopy and compared the results with high frequency data. The ranges of interest were indicated to be 5–250 cm-1 and 1500–1750 cm-1 regions. Samples of indomethacin were milled using a cryogenic mill to avoid mechanical heating of the sample, with full amorphous samples being obtained after 25 min of milling. Methods used in this study include Raman spectroscopy, isothermal differential scanning calorimetry (DSC), and X-ray diffractometry as well as the milling technique. The primary objective of this research was to use all of these techniques to monitor the crystallization of amorphous indomethacin to the more stable γ-state while the sample was at room temperature-well below the glass transition temperature, Tg = 43 °C. The results of this research did in fact show that low-frequency Raman spectroscopy is a very sensitive technique for identifying very small amounts of crystallinity within mostly amorphous samples. The data was supported by the well-established methods for monitoring crystallinity: XRD and DSC. This paper particularly noted the benefit of low acquisition times associated with low-frequency Raman spectroscopy compared with the other techniques used.
Low-frequency Raman spectroscopy was also used to monitor two polymorphic forms of caffeine after grinding and pressurization of the samples (39). Pressurization was performed hydrostatically using a gasketed membrane diamond anvil cell (MDAC), while ball milling was used as the method of grinding the sample. Analysis methods used were low-frequency Raman and X-ray diffraction. Low-frequency Raman spectra revealed that, upon slight pressurization, caffeine form I transforms into a metastable state slightly different from that of form II and that a disordered (amorphous) state is achieved in both forms when pressurized above 2 GPa. In contrast, it is concluded that grinding results in the transformation of each form into the other with precise grinding times, thus also generating an intermediate form, which was found to only be observable using low-frequency Raman spectroscopy. The caffeine data, as well as the low-frequency data obtained for indomethacin (40), were further discussed by Hédoux and colleagues (40).
Larkin and colleagues (41) used low-frequency Raman in conjunction with other techniques to characterize several different APIs and their various forms. The other techniques include FT-Raman spectroscopy, X-ray powder diffraction (XRPD), and single-crystal X-ray diffractometry. The APIs studied include carbamazepine, apixaban diacid co-crystals, theophylline, and caffeine and were prepared in various ways that are not detailed here. During this research, low-frequency Raman spectroscopy played an important role in understanding the structures while in their various forms. However, more importantly, low-frequency Raman spectroscopy produced information-rich regions below 200 cm-1 for each of the crystalline samples and noticeably broad features when the APIs were in solution.
Wang and colleagues (42) investigated the applicability of low-frequency Raman spectroscopy in the analysis of respirable dosage forms of various pharmaceuticals. The analyzed pharmaceuticals were involved in the treatment of asthma or chronic obstructive pulmonary disease (COPD) and include salmeterol xinafoate, formoterol fumarate, glycopyrronium bromide, fluticasone propionate, mometasone furoate, and salbutamol sulfate. Various formulations of amino acid excipients were also analyzed in this study. Results indicated that the use of low-frequency Raman analysis was beneficial because of the large features found in the region and allowed for reliable identification of each of the dosage forms. Not only this, it also allowed unambiguous identification of two similar bronchodilators, albuterol (Ventolin) and salbutamol (Airomir).
Heyler and colleagues (43) collected both the low-frequency and fingerprint region of Raman spectra from several polymorphs of carbamazepine, an anticonvulsant and mood stabilizer. This study found that the different polymorphs of this API could be distinguished effectively using these two regions. Similarly, Al-Dulaimi and colleagues (44) demonstrated that polymorphic forms of paracetamol, flufenamic acid, and imipramine hydrochloride could be screened using low-frequency Raman and only milligram quantities of each drug. In this study, paracetamol and flufenamic acid were used as the model compounds for comparison with a previously unstudied system (imipramine hydrochloride). Features within the low-frequency Raman regions of spectra were shown to be significantly different between forms of each drug. Therefore this study also indicated that the polymorphs were highly distinguishable using the technique. Hence, like all other previously mentioned case studies, these investigations further demonstrate the utility of low-frequency Raman spectroscopy as a fast and effective method for screening pharmaceuticals for crystallinity.
Conclusions
Low-frequency Raman spectroscopy is a new technique in the field of pharmaceuticals, as well as in general studies of crystallinity. This is despite indications in previous studies showing an innate ability of the technique for identifying crystalline materials and in some cases, quantifying crystallinity. Arguably one of the most beneficial aspects of this technique is the relatively small amount of time necessary to prepare and analyze samples when compared with XRD or DSC. This should ensure the growing use of low-frequency Raman spectroscopy in, not only pharmaceutical crystallinity studies, but also crystallinity studies of other substances as well.
References
(1) J.R. Ferraro and K. Nakamoto, Introductory Raman Spectroscopy, 1st Edition (Academic Press, San Diego, 1994).
(2) K.C. Gordon and C.M. McGoverin, Int. J. Pharm. 417, 151–62 (2011).
(3) D. Law et al., J. Pharm. Sci. 90, 1015–1025 (2001).
(4) G.H. Ward and R.K. Schultz, Pharm. Res. 12, 773–779 (1995).
(5) M.D. Ticehurst et al., Int. J. Pharm. 193, 247–259 (2000).
(6) M. Rani, R. Govindarajan, R. Surana, and R. Suryanarayanan, Pharm. Res. 23, 2356–2367 (2006).
(7) M.J. Pikal, in Polymorphs of Pharmaceutical Solids, H.G. Brittain, Ed. (Marcel Dekker, New York, 1999), pp. 395–419.
(8) M. Ohta and G. Buckton, Int. J. Pharm. 289, 31–38 (2005).
(9) J. Han and R. Suryanarayanan, Pharm. Dev. Technol. 3, 587–596 (1998).
(10) S. Debnath and R. Suryanarayanan, AAPS PharmSciTech. 5, 1–11 (2004).
(11) C.J. Strachan, T. Rades, D.A. Newnham, K.C. Gordon, M. Pepper, and P.F. Taday, Chem. Phys. Lett. 390, 20–24 (2004).
(12) Y.C. Shen, Int. J. Pharm. 417, 48–60 (2011).
(13) G.W. Chantry, in Submillimeter Spectroscopy: A Guide to the Theoretical and Experimental Physics of the Far Infrared, 1st Edition (Academic Press Inc. Ltd., Waltam, 1971).
(14) D. Tuschel, Spectroscopy30(9), 18–31 (2015).
(15) P.M.A. Sherwood, Vibrational Spectroscopy of Solids (Cambridge University Press, Cambridge, 1972).
(16) L. Ho et al., J. Control. Release. 119, 253–261 (2007).
(17) V.P. Wallace et al., Faraday Discuss. 126, 255–263 (2004).
(18) F.S. Vieira and C. Pasquini, Anal. Chem. 84, 3780–3786 (2014).
(19) J. Darkwah, G. Smith, I. Ermolina, and M. Mueller-Holtz, Int. J. Pharm. 455, 357–364 (2013).
(20) S. Kojima, T. Shibata, H. Igawa, and T. Mori, IOP Conf. Ser. Mater. Sci. Eng. 54, 1–6 (2014).
(21) T. Shibata, T. Mori, and S. Kojima, Spectrochim. Acta Part A Mol. Biomol. Spectrosc. 150, 207–211 (2015).
(22) S.P. Delaney, D. Pan, M. Galella, S.X. Yin, and T.M. Korter, Cryst. Growth Des. 12, 5017–5024 (2012).
(23) M.D. King, W.D. Buchanan, and T.M. Korter, Anal. Chem. 83, 3786–3792 (2011).
(24) C.J. Strachan et al., J. Pharm. Sci. 94, 837–846 (2005).
(25) C.M. McGoverin, T. Rades, and K.C. Gordon, J. Pharm. Sci. 97, 4598–4621 (2008).
(26) A. Heinz, C.J. Strachan, K.C. Gordon, and T. Rades, J. Pharm. Pharmacol. 61, 971–988 (2009).
(27) H.G. Brittain, J. Pharm. Sci. 86, 405–412 (1997).
(28) L. Yu, S.M. Reutzel, and G. A. Stephenson, Pharm. Sci. Technol. Today 1, 118–127 (1998).
(29) M. Dracínský, E. Procházková, J. Kessler, J. Šebestík, P. Matejka, and P. Bour, J. Phys. Chem. B. 117, 7297–7307 (2013).
(30) P. Sharma et al., J. Raman Spectrosc. DOI 10.1002/jrs.4834, wileyonlinelibrary.com (2015).
(31) A.P. Ayala, Vib. Spectrosc. 45, 112–116 (2007).
(32) J.F. Scott, Spex Speak. 17, 1–12 (1972).
(33) D.P. Strommen and K. Nakamoto, in Laboratory Raman Spectroscopy, 1st Edition (John Wiley & Sons Inc., New York, 1984).
(34) A.L. Glebov, O. Mokhun, A. Rapaport, S. Vergnole, V. Smirnov, and L.B. Glebov, Proc. SPIE. 8428, 84280C1– 84280C11 (2012).
(35) E.P.J. Parrott and J.A. Zeitler, Appl. Spectrosc. 69, 1–25 (2015).
(36) A. Hédoux, L. Paccou, Y. Guinet, J.F. Willart, and M. Descamps, Eur. J. Pharm. Sci. 38, 156–164 (2009).
(37) R.L. McCreery, in Raman Spectroscopy for Chemical Analysis, 1st Edition (John Wiley & Sons Inc., New York, 2000).
(38) P.T. Mah, S.J. Fraser, M.E. Reish, T. Rades, K.C. Gordon, and C.J. Strachan, Vib. Spectrosc. 77, 10–16 (2015).
(39) A. Hédoux, A.A. Decroix, Y. Guinet, L. Paccou, P. Derollez, and M. Descamps, J. Phys. Chem. B. 115, 5746–5753 (2011).
(40) A. Hédoux, Y. Guinet, and M. Descamps, Int. J. Pharm. 417, 17–31 (2011).
(41) P.J. Larkin, M. Dabros, B. Sarsfield, E. Chan, J.T. Carriere, and B.C. Smith, Appl. Spectrosc. 68, 758–76 (2014).
(42) H. Wang, M. A. Boraey, L. Williams, D. Lechuga-Ballesteros, and R. Vehring, Int. J. Pharm. 469, 197–205 (2014).
(43) R. Heyler, J. Carriere, and B. Smith, in “Raman Technology for Today’s Spectroscopists,” supplement to Spectroscopy (June), 44–50 (2013).
(44) S. Al-Dulaimi, A. Aina, and J. Burley, CrystEngComm. 12, 1038–1040 (2010).
Geoffrey P.S. Smith, Gregory S. Huff, and Keith C. Gordon are with the Department of Chemistry, Dodd Walls Centre, at the University of Otago, in Dunedin, New Zealand. Direct correspondence about this article to: keith.gordon@otago.ac.nz


Getting accurate IR spectra on monolayer of molecules
April 18th 2024Creating uniform and repeatable monolayers is incredibly important for both scientific pursuits as well as the manufacturing of products in semiconductor, biotechnology, and. other industries. However, measuring monolayers and functionalized surfaces directly is. difficult, and many rely on a variety of characterization techniques that when used together can provide some degree of confidence. By combining non-contact atomic force microscopy (AFM) and IR spectroscopy, IR PiFM provides sensitive and accurate analysis of sub-monolayer of molecules without the concern of tip-sample cross contamination. Dr. Sung Park, Molecular Vista, joined Spectroscopy to provide insights on how IR PiFM can acquire IR signature of monolayer films due to its unique implementation.


Achieving Accurate IR Spectra On Monolayer of Molecules
April 18th 2024Creating uniform and repeatable monolayers is incredibly important for both scientific pursuits as well as the manufacturing of products in semiconductor, biotechnology, and. other industries. However, measuring monolayers and functionalized surfaces directly is. difficult, and many rely on a variety of characterization techniques that when used together can provide some degree of confidence. By combining non-contact atomic force microscopy (AFM) and IR spectroscopy, IR PiFM provides sensitive and accurate analysis of sub-monolayer of molecules without the concern of tip-sample cross contamination. Dr. Sung Park, Molecular Vista, joined Spectroscopy to provide insights on how IR PiFM can acquire IR signature of monolayer films due to its unique implementation.


