LC–MS Identification of Wax Esters in Cloudy Canola Oil
Canola largely contains unsaturated fatty acids, thus rendering it clear in most cases after extraction and refining.
Canola largely contains unsaturated fatty acids, thus rendering it clear in most cases after extraction and refining. However, canola can become cloudy even at room temperature. The cloudiness is thought to be largely because of the presence of wax esters transferred to the oil from the plant tissues during extraction and increased saturated fatty acid content. Methods have previously used saponification to measure the fatty alcohol and fatty acid components of the wax esters. Others have used solid-phase extraction with gas chromatograph y–mass spectrometry. This study shows that high performance liquid chromatography coupled with quadrupole time-of-flight mass spectrometry (HPLC–QTOF-MS) can directly analyze the wax esters with a simple filter sample preparation step. Using HPLC–QTOF-MS also allows for direct analysis of other fatty components in the sample such as triacylglycerols.
Canola oil is predominately composed of unsaturated fatty acids, thus rendering it clear in most cases after extraction and refining. However, there are instances in which canola can become cloudy even at room temperature. Cloudy canola oil is not typical for the consumer and, therefore, has a negative connotation. Dewaxing is a process in which solids in an oil can be removed, but this added processing step can be costly. Typically, canola oil does not require dewaxing, which, in addition to the low amount of saturated fatty acids, makes it a desirable option for salad oils. Industrially, a cold test is used to see if the oil will become hazy upon storage (1). The oil is heated to 130 °C and then immersed in an ice water bath maintained at 0 °C for 5.5 h. The sample is examined for any evidence of crystals or cloudiness. The sample must be completely clear to pass the test. A lack of clarity indicates the potential for the oil to become hazy over time.
The cloudiness sometimes observed in canola and other oils is thought to be mainly because of the presence of wax esters (2–5) transferred to the oil from the plant tissues and increased levels of saturated fatty acids (2). The increased wax esters can arise in different growing seasons because of varying environmental conditions. Wax esters are made up of a fatty acid and fatty alcohol. These components tend to be long carbon chains 20–28 carbons in length. They can be saturated or unsaturated, although saturated chains are reported more often (2–4). Waxes can act as an organogelator in liquid oils. An organogelator must have a balance of insolubility and solubility in the solution (6). Liquid oils and waxes can have such a relationship. The gelling of waxes with liquid oils has been studied. Sunflower wax esters have been shown to be able to create an organogel in soybean oil at a concentration of 0.5% (7).
Methods have previously used saponification to measure the fatty alcohol and fatty acid components of the wax esters (2). Other studies have used solid-phase extraction with silica gel and gas chromatography–mass spectrometry (GC–MS) (8) as well as silver nitrate–impregnated silica gel with liquid chromatography (LC) (9) to characterize the wax ester fractions of olive and sunflower oils. Studies that have not used a mass spectrometer for detection characterize the composition of the waxes by their number of carbons and degree of unsaturation (8,9). This type of analysis is also common for analyzing triacylglycerols. However, there can be different isomers of each wax. Therefore, mass spectrometry is needed to fully elucidate the composition of each type of wax ester. This study confirms that high performance liquid chromatography coupled with quadrupole time-of-flight mass spectrometry (HPLC–QTOF-MS) can directly detect the wax esters with a simple sample filtration preparation step. HPLC–QTOF-MS also allows for direct analysis of other fatty components in the sample such as triacylglycerols.
Experimental
Sample Preparation
Canola oil with visible cloudiness at room temperature was filtered through a Buchner funnel fitted with black filter paper for visual confirmation of collection of white material. Material on the filter paper was scraped off and collected for analysis. Approximately 10 mg of the collected material was diluted in 25 mL of 80:20 methylene chloride–acetonitrile.
Standards were purchased from NuChek Prep and included lignoceryl lignocerate, behenyl behenate, behenyl oleate, arachidyl oleate, stearyl oleate, and stearyl linoleate. Approximately 1 mg of standard was diluted in 25 mL of 80:20 methylene chloride–acetonitrile.
LC–QTOF-MS Method Parameters
The collected material was analyzed on an Agilent 1290 HPLC system coupled to an Agilent 6520 QTOF-MS system with an electrospray ionization (ESI) source. Mobile-phase A consisted of 80:20 water–2-propanol and mobile-phase B was 80:10:10 butanol–water–2-propanol, each with 25 µM ammonium formate added. The mobile phase was ramped from 30% B to 100% B over a period of 24 min at 0.25 mL/min. A 100 mm × 3.0 mm, 2.7-µm dp Agilent Poroshell 120 EC-C18 column was used and held at 50 °C. The ESI was used in positive mode with the nebulizer set at 30 psig. The drying gas was heated to 325 °C and introduced at a flow rate of 4 L/min. Full-scan data were acquired by scanning from m/z 200 to m/z 1500. Targeted MS-MS was done on the waxes using a mass-dependent formula with a slope of three and y-intercept of 10 for the collision energy.
Data Analysis
Compounds were found using the molecular feature extractor in Agilent's Quant MassHunter software. The composition of known wax esters were added into the personal compound database library (PCDL) which can then be searched using the MassHunter software. MS-MS analysis was necessary to positively identify each wax ester. Wax esters are esters with varying chain lengths of alcohol and fatty acids. Therefore, there are different isomers possible and MS-MS analysis breaks the ester linkage, thereby allowing the identification of the alcohol and fatty acid components.


Table I: Formula information for wax standards
Results and Discussion
Analysis of Wax Standards
The mass spectra obtained from the wax standards show that the predominant ion is the ammonium adduct of the ester. Table I summarizes the masses and adducts formed. A previous study on quantitating positional isomers of triglycerides showed that the ammonium adducts had the least amount of in-source fragmentation (10). Many lipids require the use of adducts to ionize, and other adducts such as lithium, sodium, or silver were shown to have increased diacylglycerol fragments. This principle was used here as well and was helpful for quantitation. The [M+H]+ ion was also present for the standards, but was quite small in comparison to the ammonium adduct.

Figure 1: MS and MS-MS spectra of lignoceryl lignocerate. The prevalent ion is the ammonium adduct in the MS spectrum and the [M+H]+ fragment of lignoceric acid in the MS-MS spectrum.
MS-MS analysis of the standards shows an interesting fragmentation pattern depending on the chain length and unsaturation of the fatty acids and alcohols present in the wax. Lignoceryl lignocerate and behenyl behenate have fragments that are the [M+H]+ of the fatty acid. Lignoceryl lignocerate is made up of a C24 fatty acid and alcohol. The fragment present for lignoceryl lignocerate is the [M+H]+ of lignoceric acid (Figure 1). Behenyl behenate is made up of a C20 fatty acid and alcohol. The fragment present for behenyl behenate is the [M+H]+ of behenic acid (Figure 2). The MS-MS spectra of behenyl oleate has the [M+H]+ of the behenic acid, but also has representative fragments for the oleate moiety. In Figure 3, the fragments at m/z 111.1186 and 125.1339 represent the fragmentation of oleic acid at the C9 carbon and subsequent CH2 loss. Arachidyl oleate, stearyl oleate, and stearyl linoleate have very similar fragmentation patterns. There is no fragment for the saturated component, but there are fragments representing the unsaturated component. The fragments present represent the unsaturated portion with subsequent losses of oxygen and hydrogen. Arachidyl oleate and stearyl oleate have a very similar fragmentation pattern (Figures 4 and 5). The ions at m/z 247.245 and 265.256 represent the oleate component and losses of oxygen. There is also a small fragment at m/z 283.2664. This is the [M+H]+ fragment corresponding to oleic acid. There is a cluster of fragments from m/z 107–209 that show subsequent losses of CH2. This may arise from fragmentation of the saturated component of the wax. A similar pattern is seen for arachidyl oleate, stearyl oleate, and stearyl linoleate. Stearyl linoleate differs from arachidyl oleate and stearyl oleate in the fragments at m/z 245.2298 and 263.2405 (Figure 6). These fragments are from linoleate and subsequent losses of oxygen and hydrogen. It is a similar pattern to the waxes containing oleate.

Figure 2: MS and MS-MS spectra of behenyl behenate. The prevalent ion is the ammonium adduct in the MS spectrum and the [M+H]+ fragment of behenic acid in the MS-MS spectrum.
An interesting point is that the unsaturated portion of the analyte appears to stay intact rather than fragmenting when the wax contains an unsaturated chain and a saturated chain of 20 carbons or less. This is also seen in the fragmentation patterns for triacylglycerols. Data from Malone and Evans (11) show that fragmentation increases with increasing degree of unsaturation. This was speculated to be because ammonium ion affinity is likely to be greater with increasing unsaturation. This pattern also seems to be applied to the waxes when both saturated and unsaturated chains are present. The unsaturated component of the ester may be preferentially ammoniated, and therefore is not fragmented. The saturated component is then fragmented and showing subsequent losses of CH2 (Figures 4–6). Behenyl oleate does not behave in this way, however. Instead of the main fragments coming from oleate, the fragment is the [M+H]+ ion from behenic acid (Figure 3). One explanation is that ammonium ion affinity may also increase with chain length. If this is the case, going from 20 carbons to 22 carbons may be a tipping point for the preference of the ammonium adduct formation in the wax esters. This, in combination with the waxes containing two saturated components, also shows that the fragmentation pattern of the saturated components do not always include the CH2 losses.
Figure 3: MS and MS-MS spectra of behenyl oleate. The prevalent ion is the ammonium adduct in the MS spectrum and the [M+H]+ fragment of behenic acid in the MS-MS spectrum. The MS-MS spectrum also has fragments at m/z 111.1186 and 125.1339 that represent the fragmentation of oleic acid.
Analysis of Cloudy Canola
The main components of the filtered material found in this analysis are ammonium adducts of triglycerides typical of canola oil. In the triglycerides present, there was no indication of larger amounts of saturated fatty acid containing triglycerides such as tristearin. This is contrary to other reports (2), which attributed the cloudy material not only to waxes, but also to saturated fatty acid containing triglycerides. The large amount of liquid oil in the filtered material was confirmed by viewing the sample under a microscope. The microscope shows a crystal network of solid and liquid material, indicating that the wax esters identified in the sample can trap liquid oil within its crystal network during crystal formation. This crystal network with trapped liquid oil is what causes the oil to become hazy or cloudy in appearance (Figure 7).

Figure 4: MS and MS-MS spectra of arachidyl oleate. The prevalent ion is the ammonium adduct in the MS spectrum and the [M+H]+ and oxygen loss fragments of oleic acid in the MS-MS spectrum.
MS analysis showed wax esters with a range of 44–54 carbons to be present. In this range, the C48 wax ester has the largest peak area. In addition to the even-numbered wax esters present, smaller quantities of esters containing odd numbers of carbons are also present. Like the standards, the most abundant ion represents the ammonium adducts. The [M+H]+ ion was also present in lesser abundance. The range of wax esters found is typical for plant materials (2–4).

Figure 5: MS and MS-MS spectra of stearyl oleate. The prevalent ion is the ammonium adduct in the MS spectrum and the [M+H]+ and oxygen loss fragments of oleic acid in the MS-MS spectrum.
In addition to the ability to positively confirm the compounds present, using mass spectrometry as a detection method can help to deconvolute coeluted compounds. There can be overlapping of the waxes with a similar number of carbons and unsaturation, but the software can separate the compounds with different masses and similar retention times.
Figure 6: MS and MS-MS spectra of stearyl linoleate. The prevalent ion is the ammonium adduct in the MS spectrum and the [M+H]+ and oxygen loss fragments of linoleic acid in the MS-MS spectrum.
MS-MS analysis showed that the esters contained carbon chain lengths of 20–28. The nature of the analytes makes it difficult for complete elucidation of each wax component. For instance, the C44 wax ester contained C20, C22, and C24 fragments. The fragments for C20 and C24 were greater in abundance, indicating that, in this case, the wax tends to be more asymmetric rather than having components of the same chain length on each side of the ester linkage. In other reports in which the waxes were separated into their alcohol and acid components before GC analysis, the fatty alcohol tended to have longer chain lengths than the fatty acid (4). This would correlate to the work done here in that the chain lengths would appear to be asymmetric. This method could also be applied to other oils that exhibit cloudiness.


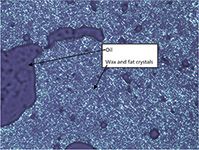
Figure 7: Micrograph of the filtered solids. The dark areas represent pockets of oil that are trapped within the wax and fat crystal network.
Conclusion
LC–QTOF-MS has been shown to provide a direct analysis for the solid material that causes cloudiness in canola oil. In the case of the cloudy canola oil studied here, verification of waxes in the cloudy material was possible via filtration of the oil, dilution of the collected material, and analysis by LC–QTOF-MS. There are many different isomers possible for the wax esters. MS-MS was used to elucidate the composition of the wax esters present. Many waxes are available commercially as standards and can be added into a user library for compound confirmation. This method can also be used for other oils that contain waxes of similar compositions.
Susan Seegers, Gabriela, Sekosan, and Tiffanie West are with Bunge North America in Bradley, Illinois. Direct correspondence to: Susan.Seegers@bunge.com
References
(1) AOCS, Cold Test, Official Method Cc 11-53 (American Oil Chemists' Society [AOCS], Urbana, Illinois).
(2) X.Hu, J.K. Daun, and R. Scarth, J. Am. Oil Chem. Soc. 70, 535–537 (1993).
(3) R. Przybylski, C.G. Biliaderis, and N.A.M. Eskin, J. Am. Oil Chem. Soc.70, 1009–1015 (1993).
(4) P. Kolodziejczyk "#91-08, Identification of Waxes in Canola Oil," available at: http://citeseerx.ist.psu.edu/viewdoc/download?doi=10.1.1.199.2019&rep=rep1&type=pdf.
(5) H. Liu, R. Przybylski, K. Dawson, N.A.M. Eskin, and C.G. Biliaderis, J. Am. Oil Chem. Soc.73, 493-498 (1996).
(6) H.S. Hwang, S. Kim, M. Singh, J.K. Winkler-Moser, and S.X. Liu, J. Am. Oil Chem. Soc.89, 639–647 (2012).
(7) E.D. Co and A.G. Marangoni, J. Am. Oil Chem. Soc.89, 749–780 (2012).
(8) B. Reiter and E. Lorbeer, J. Am. Oil Chem. Soc.78, 881–888 (2001).
(9) G. Henon, K. Recseg, and K. Kovari, J. Am. Oil Chem. Soc.78, 401–410 (2001).
(10) L.C. Herrera, M.A. Potvin, and J.E. Melanson, Rapid Commun. Mass Spectrom.24, 2745–2752 (2010).
(11) M. Malone and J.J. Evans, Lipids39, 273–284 (2004).


Synthesizing Synthetic Oligonucleotides: An Interview with the CEO of Oligo Factory
February 6th 2024LCGC and Spectroscopy Editor Patrick Lavery spoke with Oligo Factory CEO Chris Boggess about the company’s recently attained compliance with Good Manufacturing Practice (GMP) International Conference on Harmonisation of Technical Requirements for Registration of Pharmaceuticals for Human Use (ICH) Expert Working Group (Q7) guidance and its distinction from Research Use Only (RUO) and International Organization for Standardization (ISO) 13485 designations.


