Light and Medium Petroleum Distillate Characterization Using Two-Dimensional Gas Chromatography–High-Resolution Time-of-Flight Mass Spectrometry and Enhanced Software Processing
Special Issues
The enhanced resolution of comprehensive two-dimensional gas chromatography (GCxGC) was combined with the increased resolving power, speed, and mass accuracy of the Pegasus® HRT's mass analyzer to confidently characterize molecules in light cycle oil (LCO) and vacuum gas oil (VGO). Optimized chromatographic and mass spectrometry parameters were implemented to improve data acquisition, processing, and heteroatomic speciation of these light to midlevel petroleum fractions. Software tools were utilized to process the data and facilitate robust compound identifications. GCxGC-HRT data was processed using comprehensive Peak Find and resulted in comprehensive characterization of molecules in LCO and VGO samples. Compound classes consisted of, but were not limited to alkanes, cycloalkanes, aromatics, benzothiophenes, and carbazoles. Selective processing of alkylbenzothiophenes and dibenzothiophenes was conducted by retrospectively processing data using rapid two-dimensional, accurate mass Target Analyte Finding (TAF).
The enhanced resolution of comprehensive two-dimensional gas chromatography (GCxGC) was combined with the increased resolving power, speed, and mass accuracy of high-resolution time-of-flight mass spectrometry to confidently characterize molecules in light cycle oil (LCO) and vacuum gas oil (VGO). Optimized chromatographic and mass spectrometry parameters were implemented to improve data acquisition, processing, and heteroatomic speciation of these light to midlevel petroleum fractions. Advanced software tools were used to process the data to facilitate robust compound identifications and resulted in comprehensive characterization of molecules in LCO and VGO samples. Compound classes consisted of, but were not limited to, alkanes, cycloalkanes, aromatics, benzothiophenes, and carbazoles. Selective detection and quantification of alkylbenzothiophenes and dibenzothiophenes were conducted by retrospectively processing data using rapid two-dimensional, accurate mass target analyte finding. Results were compared to those provided by more-traditional petroleum analysis methods.
The world-wide demand for “clean” fuels and lubricants in combination with changing feedstock supplies has increased the need for novel processing technologies and analysis protocols for heavier and more-sour crude oils (1). Current environmental concerns and updated global regulations have mandated ultralow sulfur fuels that are compliant with new emission control technology (2–4). The results of processing methods and thus the quality of fuels can be best assessed through determination of the molecular composition of these complex materials. Indeed, the hydrocarbon content and degree of saturation is of great importance to the overall value of fuel; however, just as important is the minimization of less desirable compounds containing sulfur, nitrogen, or oxygen because of their lower energy output upon combustion and negative impact on catalytic refinement processes (5).
Gas chromatography (GC) is a widely used technique for the analysis of low- to mid-level petroleum fractions because of its resolution, speed, robustness, and reproducibility. It can be coupled to various detectors including thermal conductivity, flame ionization, atomic emission, mass spectrometry (MS), high-resolution MS, sulfur chemiluminescence, vacuum ultraviolet (VUV), and others for qualitative and quantitative analyses of petroleum fractions. For example, Garcia and coworkers (6) investigated the utility of GC with sulfur chemiluminescence detection and GC–high-resolution MS for aromatic sulfur detection in gas oils and concluded that they were excellent technologies for profiling and characterizing oils.
Comprehensive two-dimensional GC coupled with time-of-flight mass spectrometry (GCxGC–TOF-MS) has been used for the analysis of light- to mid-level petroleum fractions since it results in structured chromatograms and better separation through the use of orthogonally related, high efficiency columns. The columns provide larger peak capacities in two-dimensional (2D) planes, and increased sensitivity as a result of cryogenic focusing of effluents in the modulator connecting the first and second dimension columns (7). GCxGC–TOF-MS has also been used to analyze higher molecular weight hydrocarbons (up to C60) in heavier vacuum gas oil (VGO) samples (8).
In this study, GCxGC was combined with high-resolution TOF-MS to obtain comprehensive structural information for the molecular constituents of samples for light cycle oil (LCO), as shown in Figure 1. GCxGC–high-resolution TOF-MS data resulted in unequivocal compound identifications through spectral similarity comparisons to large, well-established databases and formula determinations for high-resolution accurate mass fragment and molecular ions. The distinct advantage of GCxGC–high-resolution TOF-MS for complex material analysis is a direct result of its ability to reduce coelutions through superior chromatographic separation and minimize mass spectral interferences with higher mass analyzer resolving power.

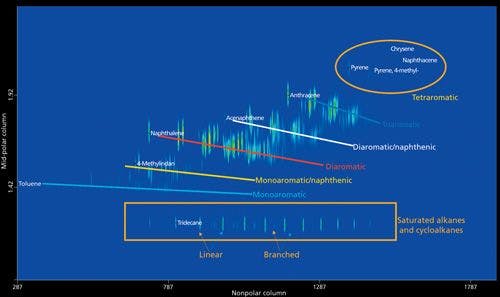
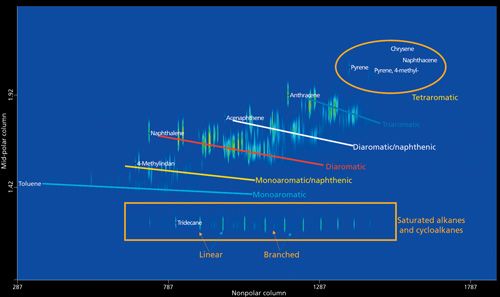
Figure 1: Contour plot illustrating different classes of compounds in LCO.
Experimental
LCO and VGO samples were diluted in dichloromethane (100:1 and 10:1) and 0.5 mL aliquots were placed in 2-mL vials. Data acquisition was carried out using an Agilent 7890 gas chromatograph with a split–splitless injector, a Gerstel MPS2 autosampler, and a LECO Pegasus GC-HRT 4D MS system. The GC system was equipped with a secondary oven, a liquid nitrogen quad-jet, a dual-stage thermal modulator (LECO Corporation) and a dual capillary column set (Restek Corporation): column 1: a nonpolar 30 m x 0.25 mm, 0.25-µm df Rxi-5ms; column 2: a mid-polar 0.6 m x 0.25 mm, 0.25-µm df Rxi-17Sil MS.
LCO (0.5 µL) was injected into the split–splitless injector using a split ratio of 200:1 and an inlet temperature of 280 °C. The separation was performed using a 1-mL/min constant flow of helium and a temperature program of 40 °C (2-min hold) to 330 °C at 10 °C/min (3-min hold). VGO sample introduction consisted of a 1-µL injection with a 20:1 split and an inlet temperature of 350 °C. Helium at a constant flow of 1 mL/min and an oven temperature program of 40 °C (2-min hold) to 350 °C at 3 °C/min (25-min hold) was used for VGO component separation. The secondary oven and modulator were maintained at +5 °C and +15 °C relative to the corresponding primary oven temperature programs used in LCO and VGO analysis. Modulation times of 2 s and 6 s were used for LCO and VGO, respectively. The Pegasus HRT 4D mass spectrometer was run with an electron energy of 70 eV, an emission current of 1 mA, and a source temperature of 250 °C. Data were acquired at 200 spectra/s, and the mass range was 35–510 m/z. LECO ChromaTOF-HRT software was used to acquire, process, and display data.
Results and Discussion
A significant improvement in comprehensive LCO and VGO sample characterization was achieved through coupling 2D GC with high-resolution TOF-MS. Comprehensive processing of the LCO data resulted in confident identification of alkanes, cycloalkanes, aromatics (mono-, tri-, tetra-), and heteroatomic compounds through a combination of spectral similarity searches and robust formula determinations using high-resolution accurate mass (HRAM) ions. For example, Tables I and II list retention times, formulas, expected and observed molecular ion m/z values, mass accuracy values, and spectral similarity search results for representative sets of aromatic and polyaromatic hydrocarbons (PAHs). The average spectral similarity value for the aromatic hydrocarbon set was 903/1000 and 904/1000 for PAHs. Average absolute mass accuracy values for these sets of compounds were 0.43 and 0.36 ppm, respectively.
A major bottleneck for petroleum analysis is data processing and interpretation. GCxGC–high-resolution TOF-MS contour plots provided quick views or “fingerprints” that displayed organized clusters of compounds in complex petroleum fractions. HRAM ions were used to easily extract information from complex chromatograms as shown for oxygenates and nitrogen containing compounds in LCO (Figure 2). Peak true (deconvoluted) mass spectral data are displayed for dibenzofuran and carbazole. Spectral similarity and mass accuracy values for these heterocyclic aromatic compounds were 960/1000, 1.13 ppm and 955/1000, -0.27 ppm.


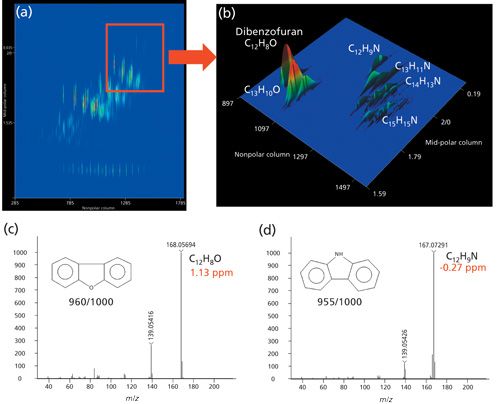
Figure 2: (a) Contour plot (TIC) and (b) expanded surface plot (XIC) displaying oxygen and nitrogen compounds in LCO. Peak true mass spectra for (c) dibenzofuran and (d) carbazole.
The software was used to quickly interrogate rich data sets retrospectively in a targeted manner after compounds of interest were identified using its comprehensive Peak Find processing feature. GCxGC–high-resolution TOF-MS data from these complex petroleum fractions were processed by leveraging target compound HRAM ions and XY coordinates or regions (retention times) of chromatographic maps (contour plots). Figure 3 illustrates how dibenzothiophene and alkylated dibenzothiophenes (C1–C4) in VGO were targeted using a new software processing feature, target analyte finding (TAF). TAF methods allow for minimum peak height and area specifications, smoothing, and tabular input of compounds to locate in high-resolution TOF-MS comprehensive data files. Molecular, fragment, or adduct search criteria can be specified in the “Expected Adduct” list of TAF processing methods. For VGO, individual analyte names, target regions (first and second dimension times), and molecular formulas were entered into the “Analytes to Find” table (Figure 3a). The software automatically calculated the four most abundant ions in ion clusters. Alternatively, m/z values or additional ions can be added to the target list. In addition, ion tolerance values or units (Da, mDa, or ppm) can be changed as well as the number of ions required for a positive hit and the production of a peak marker in GCxGC–high-resolution TOF-MS contour plots. For example, a positive hit for a C3-dibenzothiophene (DBT) isomer (C15H14S) required both M+ (226.08162 ± 0.005) and [M+2]+ (228.07761 ± 0.005) ions for a peak in the specified region of the plot (Figure 3b).

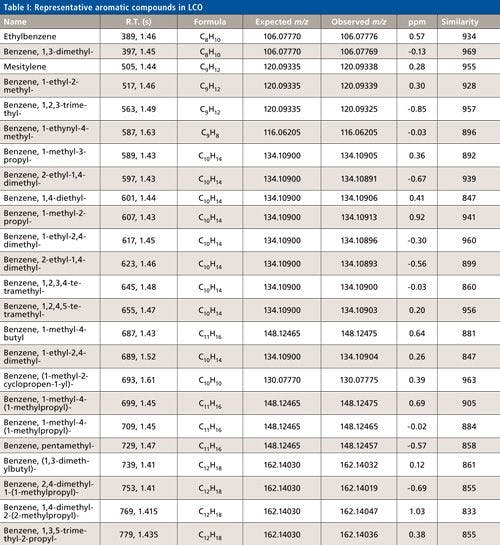
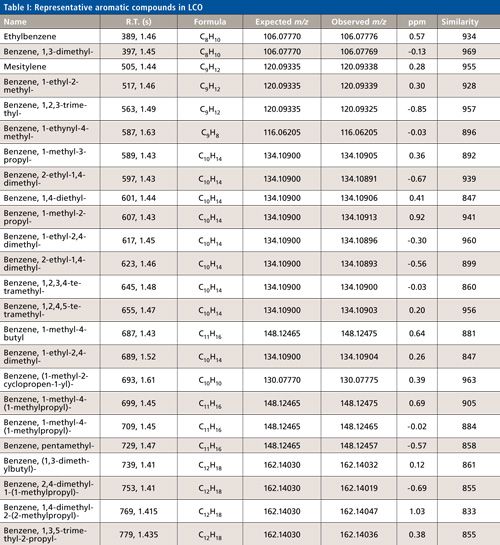

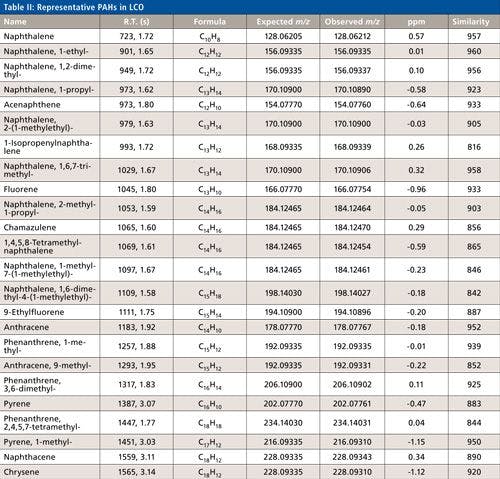
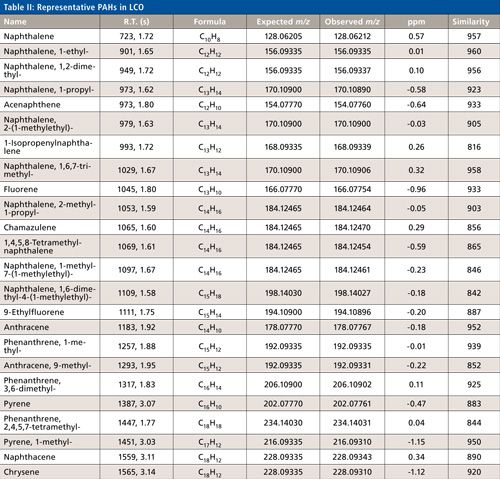

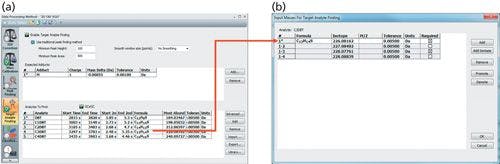
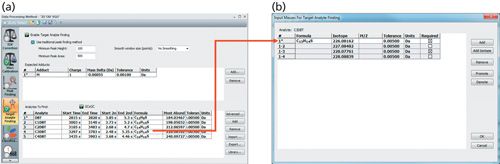
Figure 3: ChromaTOF-HRT (a) target analyte finding list and (b) HRAM ion list.
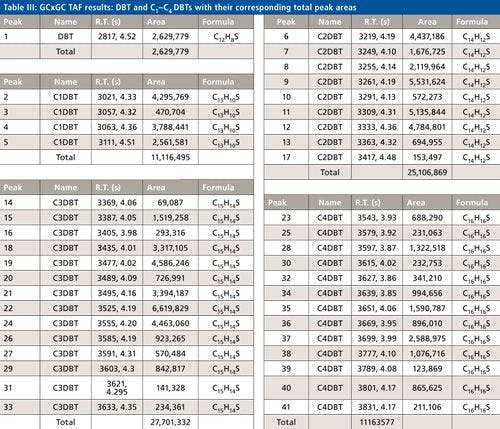
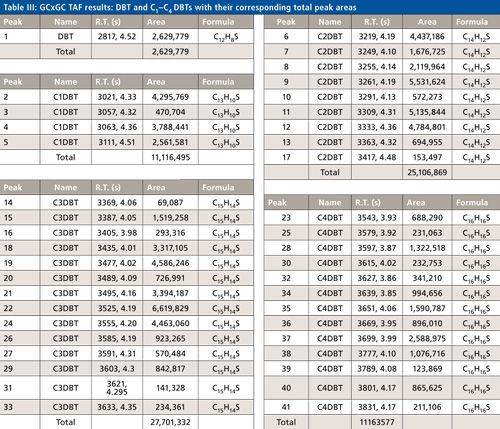
The results of TAF for dibenzothiophene (DBT) and alkylated dibenzothiophene (C1–C4 DBT) in VGO are displayed on the surface plot in Figure 4. The peak numbers, names, retention times, areas, and formulas for dibenzothiophenes meeting the TAF criteria are listed in Table III.


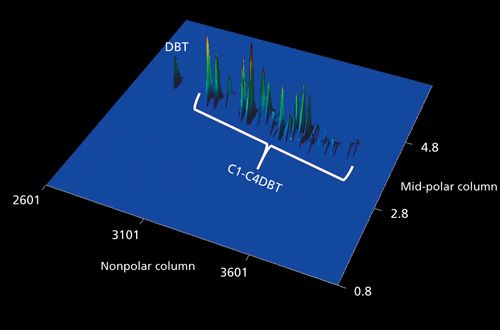
Figure 4: VGO GCxGC-high-resolution TOF-MS surface plot showing DBT and alkylated DBTs (C1–C4).

The TAF processing feature was used to quickly target higher molecular weight, sulfur-containing compounds (C17H12S to C20H14S) in a different region of the VGO contour plot as displayed in Figure 5. The mass accuracy values for three naphthenic benzothiophenes, (9,10-dihydro-6,7-dimethylbenzo[b]naphtha[2,3-d]thiophene, dinaphtho(1,2-b:2,1d)thiophene and 5,6-dihyrodinaphtho(1,2-b:1,2d)thiophene), ranged from -0.54 to 1.13 ppm.


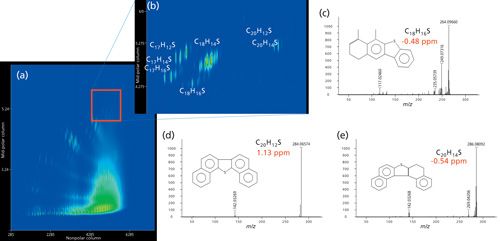
Figure 5: VGO (a) contour plot, (b) contour plot expansion showing higher molecular weight sulfur-containing compounds (C17H12S to C20H14S) and (c–d) peak true mass spectral data with molecular ion mass accuracies for naphthenic benzothiophenes.
Conclusion
The combination of enhanced chromatographic resolution (GCxGC), increased resolving power of high-resolution TOF-MS, and software designed to leverage these attributes resulted in data that were easy to process and interpret. Superlative structural characterization of low to mid-level petroleum fractions was facilitated by the production of high quality spectral data obtained with unmatched spectral acquisition rates for proper chromatographic peak definition. Confident molecular identifications were made via spectral similarity and formula searches of high-resolution accurate mass data. In addition, rapid speciation of various compound classes was accomplished through retrospective analysis of comprehensive GCxGC–high-resolution TOF-MS data using TAF.
References
- H. Muller, F.M. Adam, S.K. Panda, H.H. Al-Jawad, and A.A. Al-Hajji, J. Am. Soc. Mass Spectrom.23, 806–815 (2012).
- A.T. Nawaf, S.A. Gheni, A.T. Jarullah, and I.M. Mujtaba, Fuel Process. Technol. 138, 337–343 (2015).
- U. Arellano, J.M. Shen, J.A. Wang, M.T. Timko, L.F. Chen, J.T. Vazquez Rodriguez, M. Asomoza, A. Estrella, O.A. Gonzalez Vargas Gonzales, and M.E. Llanos, Fuel (2014). Available at: http://dx.doi.org/10.106/j.fuel.2014.11.001.
- B. Jiang, H. Yang, L. Zhan, R. Zhang, Y. Sun, and Y. Huang, Chem. Eng. J.283, 89–96 (2016).
- F. Adam, F. Bertoncini, D. Thiebaut, S. Esnault, D. Espinat, and M.C. Hennion, J. of Chrom. Science5, 643–649 (2007).
- C.L. Garcia, M. Becchi, M.F. Grenier-Loustalot, O. Paisse, and R. Szymanski, Anal. Chem.74, 3849–3857 (2002).
- H. Zheng, F. Zou, E. Lehne, J.Y. Zuo, and D. Zhang, in Advanced Gas Chromatography-Progress in Agricultural, Biomedicine and Industrial Applications, M.A. Mohd, Ed. (InTech, Rijeka, Croatia, 2012), pp. 363–388.
- T. Dutriez, M. Courtiade, D. Thiebaut, H. Dulot, F. Bertoncini, J. Vial, and M.-C. Hennion, J. Chromatogr. A1216, 2905–2913 (2009).
David E. Alonso, Clecio Klitzke, and Joe Binkley are with LECO Corporation in St. Joseph, Michigan. Direct correspondence to: david_alonso@leco.com


Synthesizing Synthetic Oligonucleotides: An Interview with the CEO of Oligo Factory
February 6th 2024LCGC and Spectroscopy Editor Patrick Lavery spoke with Oligo Factory CEO Chris Boggess about the company’s recently attained compliance with Good Manufacturing Practice (GMP) International Conference on Harmonisation of Technical Requirements for Registration of Pharmaceuticals for Human Use (ICH) Expert Working Group (Q7) guidance and its distinction from Research Use Only (RUO) and International Organization for Standardization (ISO) 13485 designations.


