More Raman Analyses Less Fluorescence Interference
Application Notebook
In recent years, the spectroscopy community has observed rapid development of Raman instrumentation and its usefulness in a variety of applications. Routine Raman analysis with 785 nm excitation has served well for the great majority of industrial applications and has become the most favored instrument configuration.
Duyen Nguyen and Eric Wu, Enwave Optronics, Inc.
In recent years, the spectroscopy community has observed rapid development of Raman instrumentation and its usefulness in a variety of applications. Routine Raman analysis with 785 nm excitation has served well for the great majority of industrial applications and has become the most favored instrument configuration. Nevertheless, the need still persists for further reduction of fluorescence interference in many important applications containing fluorescent samples.
Continuing the success of the ProRaman Series, Enwave Optronics recently announced the implementation of the ProRaman-L9 Series instruments with excitation wavelength around 900 nm for analysis of materials prone to fluorescence interference. The deployment of ProRaman-L9 has proven to be invaluable for various applications requiring further fluorescence reduction from using 785 nm excitation.
Experiment
The samples chosen for this experiment were red wine and wheat flour, both of which were previously reported unable to be analyzed by 785 nm Raman instruments (due to fluorescence). The samples were measured using ProRaman-L-785 and ProRaman-L9. Both of the ProRaman instruments were equipped with a fiber optics probe for sample interface. The red wine sample was kept in a quartz cuvette during data collection. Whole wheat flour was measured using a sapphire lens probe for direct measurement with the sample in a plastic bag.
Results and Discussion
Figure 1 shows the comparison between Raman spectra of red wine measured with Proraman-L-785 and ProRaman-L9. With 785 nm excitation, fluorescence quickly filled the intensity dynamic range, leaving little room for Raman signal to be analyzed. With ProRaman-L9, the Raman to fluorescence ratio improved about 10 times and after simple baseline subtraction, the ethanol Raman peaks appeared strong and the analysis could be readily performed.

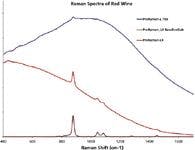
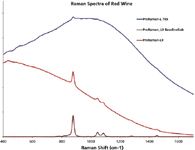
Figure 1: Raman spectra of red wine measured with ProRaman-L-785 and ProRaman-L9. Baseline subtracted ProRaman-L9 data shows in brown trace.
Figure 2 shows the measurements of whole wheat flour sample measured with ProRaman-L-785 and ProRaman-L9. Again, obvious improvement of the Raman to fluorescence ratio can be seen, and the baseline-subtracted spectrum of the whole wheat flour could be readily analyzed.

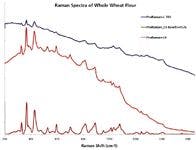
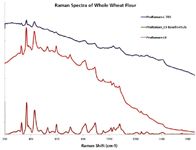
Figure 2: Raman spectra of whole wheat flour measured with ProRaman-L-785 and ProRaman âL9. Baseline subtracted ProRaman-L9 data shows in brown trace.
Conclusion
Utilizing longer wavelengths into the near infrared for Raman excitation further reduces the interference of fluorescence and improves the capability for Raman analysis in samples previously thought tough to measure. Red wine and whole wheat flour are two excellent examples showing the improved usefulness and capability for Raman analysis using ProRaman-L9. Other applications such as motor oil, pharmaceuticals, etc., may also benefit from this longer excitation wavelength Raman system.
Enwave Optronics, Inc.
18200 McDurmott St., Suite A, Irvine, CA 92614
tel. (949) 955-0258, fax (949) 955-0259
Website: www.enwaveopt.com


Nanometer-Scale Studies Using Tip Enhanced Raman Spectroscopy
February 8th 2013Volker Deckert, the winner of the 2013 Charles Mann Award, is advancing the use of tip enhanced Raman spectroscopy (TERS) to push the lateral resolution of vibrational spectroscopy well below the Abbe limit, to achieve single-molecule sensitivity. Because the tip can be moved with sub-nanometer precision, structural information with unmatched spatial resolution can be achieved without the need of specific labels.


