More Theory and Practice: The Thorny Problem of Mixtures and More on Straight Chain Alkanes
Spectroscopy
Continuing the theory and practice themes from previous columns, the theory portion of this column will be a discussion of the proper way of handling the infrared spectral interpretation of mixtures. In my opinion, mixtures are the biggest obstacle to interpreting infrared spectra, and I will share with readers five tried-and-true techniques for dealing with them. The practice portion of the column will give the answer to the last installment’s problem, and complete the spectral analysis of straight chain alkanes.
Continuing the theory and practice themes from previous columns, the theory portion of this column is a discussion of the proper way of handling the infrared (IR) spectral interpretation of mixtures. In my opinion, mixtures are the biggest obstacle to interpreting IR spectra, and I share with readers five tried-and-true techniques for dealing with them. The practice portion of the column gives the answer to the last installment’s problem and completes the spectral analysis of straight-chain alkanes.
Continuing themes from the last column, this installment is part theory and part infrared (IR) spectral interpretation. The interpretation of mixture spectra is one of the biggest challenges in IR spectroscopy. The theory section covers five techniques that can be used to make the interpretation of mixture spectra easier. The interpretation section of this column continues our examination of the spectra of straight-chain alkanes. We wrap up with the answer to the question from the April installment of this column (1) and present a new problem spectrum for you to interpret.
Overcoming the Thorny Problem of Mixtures
The problem with interpreting mixture spectra is that as more molecules are added to a mixture, and the composition of a sample becomes more complex, the spectrum becomes more complex. Figuring out which peaks belong to which molecules then becomes an increasingly difficult task. This is why in an ideal world we would only take IR spectra of pure substances, but of course this is rarely doable. Fortunately, a number of ways of dealing with the mixture analysis challenge exist:
- Purification
- Spectral subtraction
- Library searching
- Mixture analysis software
- The process of elimination
Now, let’s examine each of these methods in turn.
Purification
Unlike chromatographic methods, where mixtures are first purified and then analyzed, in IR spectroscopy mixture samples are typically analyzed as is. This means IR sample preparation is faster, but of course the complexity of the sample’s composition complicates the interpretation of the sample’s spectrum. Purification is one way around this problem.
Anything a Fourier transform infrared (FT-IR) spectroscopy user can do to simplify the composition of a sample, the simpler the spectrum will become and the easier its interpretation will be. All of the purification methods used in analytical chemistry generally can be applied to FT-IR samples (2). For example, solid-liquid mixtures can be filtered to separate the two dissimilar materials. Liquid-liquid mixtures can be distilled, and solid-solid mixtures can be recrystallized. Physical separation can also be used. For example, if a sample consists of a laminate of different polymer films, pulling the layers apart physically separates them from each other making their composition and spectra simpler. Samples in solution can be purified exploiting solubility differences via chemical extraction.
Last, but not least, one can use chromatography to separate mixtures into their components, and then the IR spectra of the individual components can be measured. A gas chromatograph can be interfaced with an FT-IR system to obtain the hyphenated technique gas chromatography (GC)-IR (3). In this technique, the GC separates a sample into its component mixtures, and then the carrier gas sweeps the sample into what is essentially a specialized FT-IR gas cell. The spectrum of each pure component is measured as they pass through the cell at different points in time. Library searches of these pure components frequently mean individual molecules can be identified.
Liquid chromatography (LC) can also be used to purify FT-IR samples. The simplest way to do this is to collect high performance liquid chromatography (HPLC) peaks as they come out of the column into separate flasks, evaporate off the mobile phase, and then take the IR spectrum of the resulting residue. The trouble with this technique is that HPLC mobile phases often contain buffers and other substances that will contaminate a sample peak and leave you with, alas, a mixture.
Spectral SubtractionSpectral subtraction is a software technique that simplifies the spectra of mixtures. It works by taking the spectrum of a pure component in the mixture, called the reference, and subtracting it from the mixture spectrum itself. Ideally, the peaks from the reference material are removed, leaving behind the peaks from the other components in the mixture. An example of how spectral subtraction works is shown in Figure 1.


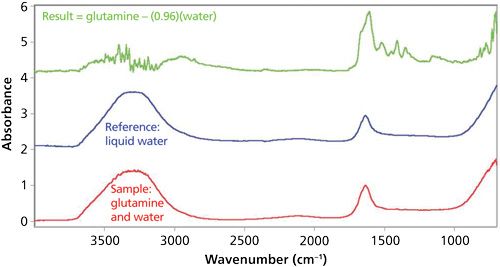
The sample spectrum in this case, seen in red at the bottom of Figure 1, is of the amino acid glutamine dissolved in water. The desire is to clearly see the spectrum of the glutamine, which is very difficult to see in this sample spectrum. The reference spectrum, in blue in the middle of the figure, is of liquid water. The top spectrum in green in Figure 1 is from subtracting the water spectrum from the sample spectrum. Note that the water absorbances have been minimized, and there are clear glutamine peaks in the 1700-1000 cm-1
range. This result is an excellent example of how spectral subtraction can be used to simplify mixture spectra and allow users to see the spectra of mixture components more clearly. A more detailed discussion of spectral subtraction will be saved for a later column.
Library Searching
Another way of analyzing mixtures is library searching (4). In this technique, the spectrum of a sample is mathematically compared to a collection of known spectra kept in a library. As a result of the comparison a number called the hit quality index (HQI) is calculated, which is a measure of the similarity between two spectra. The matches with the best HQIs are reported to the user. In some cases a close match between a library spectrum and a mixture component can be made, allowing the identification of that component in a sample. In an even more powerful technique, multiple components can be identified in a mixture by combining spectral subtraction and library searching into a technique called subtract and search again. Further discussion of library searching will be saved for a future column.
Mixture Analysis Software
Several leading FT-IR manufacturers have developed what is called mixture analysis software. In this technique the software takes the spectra in a library, combines them together using different weighting factors, and produces a large collection of calculated mixture spectra. The sample spectrum is then compared to this collection of calculated spectra in similar fashion to a library search. The best matches are reported, and ideally a good match between an actual and calculated spectrum is found. The spectra used to create the calculated spectrum can help identify the components in a mixture. The weighting factors used in the calculation give a rough idea of the concentration of each identified component in a mixture.
The limitation of mixture analysis software programs is that there are a finite number of spectra that can be used to calculate simulated mixture spectra. This means there is a limit on the number of components that can be identified in a given mixture, and for many mixtures not all the components will be identified. Despite these limitations, mixture analysis software programs offer spectroscopists an excellent new tool to tackle the problem of mixture interpretation.
The Process of Elimination
All the mixture analysis techniques discussed so far involve doing something to the mixture sample or its spectrum. The process of elimination does none of these things. Instead, it is a three-step process that requires you to rethink your approach to interpreting mixture spectra:
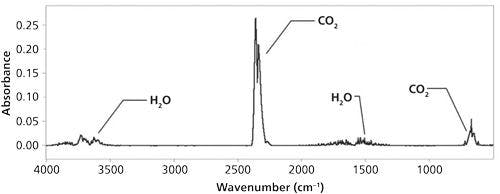
• Identify the artifacts in your spectrum, which I define as peaks that are not caused by the sample. The most common artifacts are caused by IR absorbing molecules in the atmosphere such as water vapor and carbon dioxide. The mid-IR spectrum of these gases is shown in Figure 2. Compare this spectrum to your sample spectra to help identify artifacts.
• Identify the peaks of known mixture components. For example, if your sample is dissolved in water, as shown in Figure 1, identify the water peaks. Then, identify the liquid peaks of any other components known to be present.
• At this point, you will have a spectrum with a number of unidentified peaks. Using the known peak positions of chemical functional groups (4-9), you can assign unknown peaks to identify the functional groups present, and then combine these to determine the molecular structures present in a sample.
By following this process for mixture spectra, your interpretation process will be faster and easier.
As has been shown, mixture spectra are a problem for IR spectral interpretation. However, the five techniques discussed here are your best bet for overcoming this problem.


Infrared Spectra of Straight-Chain Alkanes: C-H Stretching Vibrations
In the last installment we introduced the spectra of straight-chain alkanes (1). Recall that “methyl groups” are CH3- moieties attached to a single carbon atom, while “methylene groups” are CH2- functionalities attached to two carbon atoms. In the last column, we discussed the C-H stretching peaks of methyl and methylene groups, but that is only half the story. Not only can C-H bonds stretch but they can bend as well. An illustration of two of the C-H bending vibrations for methyl groups is seen in Figure 3.

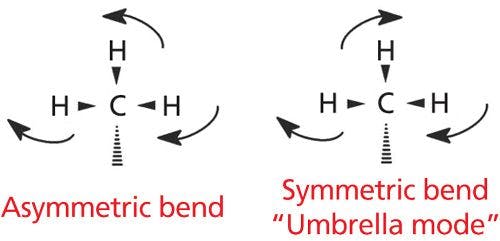
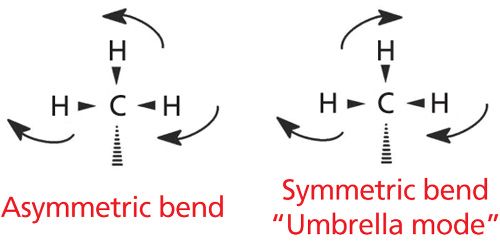
The easiest way to envision the bending vibrations of a methyl group is to imagine the C-H bonds as the ribs of an umbrella. In Figure 3, we are looking down the main axis of the umbrella with the ribs pointing out to the sides.
During the asymmetric bend, one rib of the umbrella is moving in one direction while the other two ribs are moving in the opposite direction. This vibration gives a peak at 1460 ± 10 cm-1, and appears in the spectrum of hexane as shown in Figure 4 at 1465 cm-1.

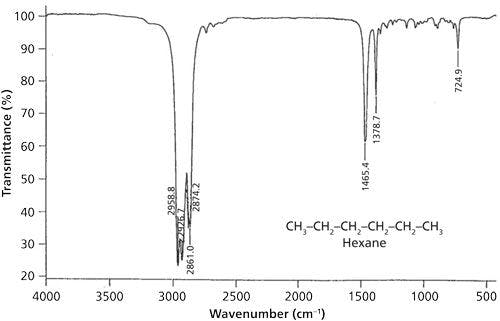
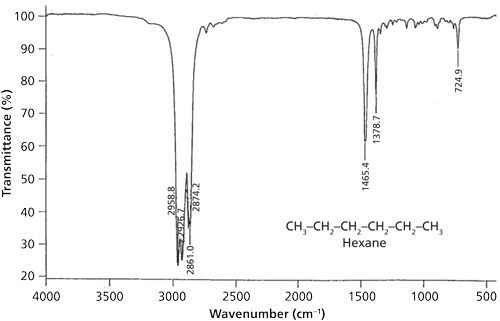
For the methyl group symmetric stretching vibration, imagine the three ribs of the umbrella bending away and toward the carbon atom in phase with each other. This motion mimics the opening and closing of an umbrella, which is why it is commonly referred to as the umbrella mode. Methyl group umbrella modes show up at 1375 ± 10 cm-1. Hexane displays this band at 1378 cm-1.
A trio of peaks then defines the presence of a methyl group in a sample: the C-H asymmetric stretch at 2962 ± 10 cm-1, the symmetric stretch at 2872 ± 10 cm-1, and the umbrella mode at 1375 ± 10 cm-1. On occasion, methyl group C-H stretching peaks fall outside of these ranges, for example, because of the presence of heteroatoms nearby. In my experience, however, the umbrella mode rarely falls outside the 1385-1365 cm-1 range, making it an excellent indicator of the presence of a methyl group in a sample.
Two of the C-H bending vibrations for methylene groups are shown in Figure 5.

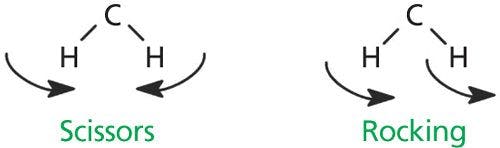
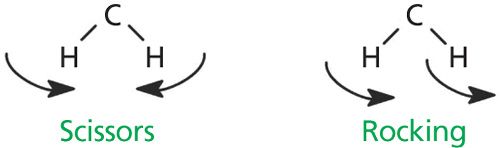
Each methylene group is attached to one carbon behind the plane of the page, and to another pointing out of the plane of the page.
The vibration on the left in Figure 5 involves the H-C-H bond angle getting bigger and smaller, with the two hydrogen atoms getting closer together and further apart like the opening and closing of a pair of scissors. This vibration is called the methylene scissors mode. This vibration appears in the spectra of straight-chain alkanes at 1455 ± 10 cm-1, and falls in the spectrum of hexane at 1465 cm-1.
Methylene groups are also capable of “rocking” as shown on the right in Figure 5. The two C-H bonds swing part way in one direction, then swing part way in the opposite direction, and the vibration is essentially a frustrated rotation around the C-C bond axis. The methylene rocking vibration in alkanes occurs at 720 ± 10 cm-1, and appears in the spectrum of hexane at 725 cm-1. An unusual property of this peak is that it appears in this range only if there are four or more CH2 groups in a row in an alkyl chain. Molecules with hydrocarbon chains shorter than this will not exhibit this band. Thus, the presence or absence of this band can give a crude estimate of hydrocarbon chain length. Table I is a summary of the C-H bending vibration peak positions for methyl and methylene groups.


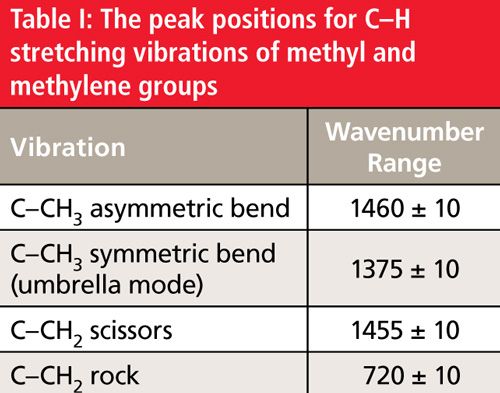
Note that there is significant overlap between the peak positions of the CH3 asymmetric bend and the CH2 scissors vibration. It can happen that these two peaks can overlap giving a single peak, as seen in the spectrum of hexane at 1465 cm-1. This is a problem because this peak can indicate that methyl may be present, methylene may be present, or both may be present. Since this peak is ambiguous it is not useful for IR spectral interpretation and should generally be ignored in the spectra of straight-chain alkanes.
Solution to Last Column’s Quiz, and the Next Problem Spectrum
The problem spectrum from the last column is shown in Figure 6.


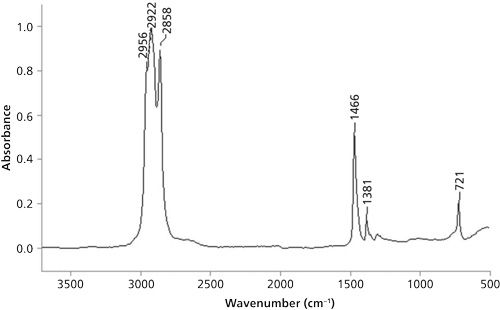
Since the spectrum exhibits three peaks from 3000 to 2850 cm-1, it means there are methyl and methylene groups present. As of the conclusion of the last column (1), we had only discussed the C-H stretching peaks of methyl and methylene groups, so only those peaks in the problem spectrum could be assigned. The proper assignment of these three peaks is shown in Table II.

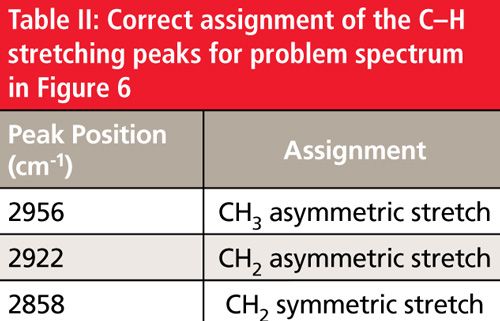
Note that the CH3 symmetric stretching peak is missing, which will be discussed in the next column.
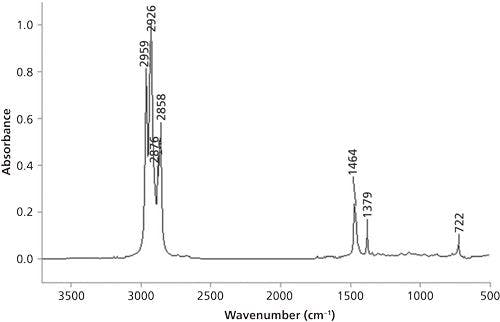
The next problem spectrum is shown in Figure 7. Using the peak positions shown, do your best to assign all the peaks to determine the functional groups present. Then, put the functional groups together to come up with a proposed chemical structure. Feel free to make use of reference spectra already published in these columns. One reader, selected at random from all who submit correct responses, will receive a signed copy of my book on IR spectral interpretation. To take the quiz please visit: www.spectroscopyonline.com/ir-spectral-interpretation-workshop-0. Good luck and happy interpreting!


References
(1) B.C. Smith, Spectroscopy 30(4), 18-23 (2015).
(2) B.C. Smith, Fundamentals of Fourier Transform Infrared Spectroscopy 2nd Edition (CRC Press, Boca Raton, Florida, 2011).
(3) B.C. Smith, Fundamentals of Fourier Transform Infrared Spectroscopy 1st Edition (CRC Press, Boca Raton, Florida, 1996).
(4) B.C. Smith, Infrared Spectral Interpretation: A Systematic Approach (CRC Press, Boca Raton, Florida, 1999).
(5) L.J. Bellamy, The Infrared Spectra of Complex Molecules, Third Edition (Wiley, New York, New York, 1975).
(6) R. Silverstein, G. Bassler, and T. Morrill, Spectrometric Identification of Organic Compounds (Wiley, New York, New York, 1981).
(7) N. Colthup, L. Daly, and S. Wiberley, Introduction to Infrared and Raman Spectroscopy (Academic Press, Boston, Massachusetts, 1990).
(8) D. Lin-Vien, N. Colthup, W. Fateley, and J. Graselli, The Handbook of Infrared and Raman Characteristic Frequencies of Organic Molecules (Academic Press, Boston, Massachusetts, 1991).
(9) G. Socrates, Infrared and Raman Characteristic Group Frequencies: Tables and Charts 3rd Edition (Wiley, New York, New York, 2001).


Brian C. Smith, PhD, is a Senior Infrared Product Specialist for PerkinElmer, based in San Jose, California. Before joining PerkinElmer, he ran his own FT-IR training and consulting business for more than 20 years, and taught thousands of people around the world how to improve their FT-IR analyses and interpret infrared spectra. Dr. Smith has written three books on infrared spectroscopy: Fundamentals of FTIR and Infrared Spectral Interpretation, both published by CRC Press, and Quantitative Spectroscopy: Theory and Practice published by Academic Press. He has published a number of papers in peer-reviewed journals and is a co-inventor on a patent for an FT-IR method to monitor dust exposure in coal mines.


Measurement of Ammonia Leakage by TDLAS in Mid-Infrared Combined with an EMD-SG Filter Method
April 9th 2024In this article, tunable diode laser absorption spectroscopy (TDLAS) is used to measure ammonia leakage, where a new denoising method combining empirical mode decomposition with the Savitzky-Golay smoothing algorithm (EMD-SG) is proposed to improve the signal-to-noise ratio (SNR) of absorbance signals.


