Multiline Analysis: A Key Technique to Enhance Analytical Reliability in ICP-AES
Interactive dedicated tools have been developed to facilitate the use of multiline analysis in inductively coupled plasma–atomic emission spectroscopy (ICP-AES) with emphases on multiline selection and on statistics for rejection of possible outliers. The aim is to take full benefit of the available information when using a charge-coupled device (CCD) detector–based instrument and to enhance the accuracy of the results. Determination of Cu in steel will be used to illustrate the potential of the tools.


Interactive dedicated tools have been developed to facilitate the use of multiline analysis in inductively coupled plasma–atomic emission spectroscopy (ICP-AES) with emphases on multiline selection and on statistics for rejection of possible outliers. The aim is to take full benefit of the available information when using a charge-coupled device (CCD) detector–based instrument and to enhance the accuracy of the results. Determination of Cu in steel will be used to illustrate the potential of the tools.
The classical way of performing quantitative analysis in inductively coupled plasma–atomic emission spectroscopy (ICP-AES) is based upon the use of a single line per element, with line selection including adequate sensitivity and freedom from spectral interferences. The use of a single line could easily be understood with a sequential monochromator, because the use of several lines per element would result in a time penalty. Similarly, with a conventional simultaneous polychromator equipped with photomultiplier tubes, a single channel usually was used for a given element because of cost and space. The introduction of multichannel detection based upon charge-coupled device (CCD) or charge-injection device (CID) detectors at the beginning of the 1990s made it possible to use several lines per element, so-called multiline analysis. However, most ICP-AES users are still using a single line per element. Why is multiline analysis not widely used for routine analysis?

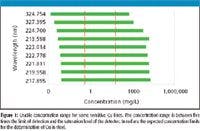

Figure 1
Multiline Analysis
With a single line for a given element, a series of replicate measurements is performed. A concentration is then deduced from the mean of the replicates, leading to a single concentration result. There is no way to verify whether a systematic bias (outlier) is present. A bias can be caused by an unexpected spectral interference. This interference can result in an enhancement of the line intensity when the spectral interference leads to a quasi-overlap. In contrast, a decrease in the line intensity can be observed when the interfering line is located at the edge of the analyte line, resulting in a background overcorrection. However, when using several lines per element, it is possible to assess outliers from the series of results. Therefore, a more accurate and precise concentration per element can be obtained. However, selection of an adequate line can be challenging with line-rich matrices, which means that selecting several lines per element would be even more complex.

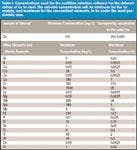
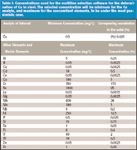
Table I: Concentrations used for the multiline selection software for the determination of Cu in steel. The selected concentration will be minimum for the Cu analyte, and maximum for the concomitant elements, to be under the most pessimistic case.
An ICP-AES instrument based upon CCD detection has been described previously (ACTIVA, HORIBA Jobin Yvon) (1). Although any system equipped with a solid-state multichannel detector can perform multiline analysis, this is not sufficient to obtain reliable element concentrations. In particular, there is a need for easy multiline selection taking into account sensitivity and risk of spectral interferences, along with a statistical data processing of the data to extract reliable element concentrations. HORIBA Jobin Yvon (Longjumeau, France) has developed interactive dedicated software to facilitate multiline selection and to detect and reject possible outliers. The potential of this software will be illustrated with the determination of Cu in steel using multiline analysis.

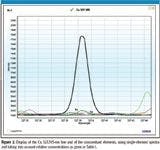
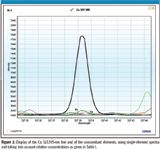
Figure 2
Dedicated Software for Multiline Analysis
The first software tool is dedicated to multiline selection and is called MASTER (multielement analysis, selection tool for enhanced reliability). This multiline selection software makes use of an ICP-based spectra database. Acquisition of this database has been described previously (2). The database contains information about wavelength, excitation energy, line width, sensitivity, limit of detection (LOD), detector saturation, and background intensity for over 50,000 identified peaks, plus thousands of other peaks not found in the conventional wavelength tables.
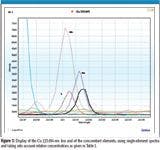
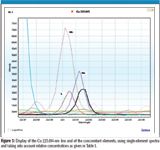
Figure 3
Combining LODs and saturation levels, it is possible to select lines that can be used over a given concentration range. In the case of Cu in steel, the expected concentration was in the 0.5–60 mg/L range. Figure 1 shows the nine most sensitive lines of Cu with their possible usable concentration range (between five times the LOD and the saturation level). There is no problem to use these lines in the 0.5–60 mg/L range. Actually, deduced from the spectra database, there are at least 40 Cu lines that could fulfill this concentration range condition.
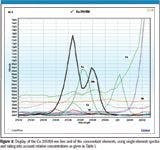
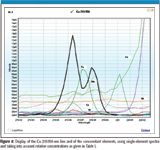
Figure 4
From the relative sensitivities and line widths, it is possible to predict spectral interferences. For this purpose, the multiline selection software uses two steps. The first is a filtering procedure to select lines with appropriate sensitivity and free from spectral interferences, while the second is an interactive display of the lines and their vicinity, to validate line selection and to facilitate background correction. The filtering procedure has been described previously (2) and takes into account the highest concentrations of the concomitant elements, and the lowest concentration of the analyte, so as to be under the most pessimistic conditions. This is why the expected concentration range must be specified for each element. In the case of the steel samples, these concentrations are given in Table I. The lowest Cu concentration, 0.5 mg/L, is selected when Cu is considered as an analyte. Following these concentrations, the filtering procedure rejects the 224.700-, 213.598-, 223.014-, and 222.778-nm lines among the nine lines given in Figure 1. This filtering procedure could be considered sufficient for multiline selection. However, because single-element spectra are stored in the database, the multiline selection software can display wavelength ranges of interest by combining the various single-element spectra as a function of the relative concentration of the elements, once again under the most pessimistic conditions. It is then possible to visualize real spectra and to verify the filtering procedure, particularly if molecular bands are present (for instance, due to OH bands). Moreover, as blank spectra are available, it is also possible to set up an adequate background correction because the blank can be visualized beside and below the analyte peak. This interactivity permits the user the full validation of the multiline selection procedure. Display examples are given for some Cu lines — the 327.395-, 223.014-, and 219.958-nm lines (Figures 2–4). In Figure 2, there is no problem with the Cu 327.395-nm line, and the background correction can be performed on both sides of the line. Figure 3 confirms that the Cu 223.014-nm line is subject to several spectral interferences due to Mn, Mo, and V lines. Figure 4 indicates that the Cu 219.958-nm line can be used, but the background correction can be performed only on the lower wavelength side. Clearly, the possibility of visualizing ICP-based spectra facilitates multiline selection and is most helpful in selecting a reliable background correction. There was no need to prepare synthetic solutions, because the combined single-element spectra used for the display were obtained with a similar ICP-AES instrument. Results of the display are summarized in Table II. Four lines were kept for the determination of Cu.

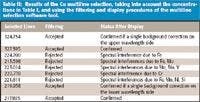
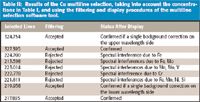
Table II: Results of the Cu multiline selection, taking into account the concentrations in Table I, and using the filtering and display procedures of the multiline selection software tool.
The next step makes use of the statistics for outlier survey (SOS) software tool. For each Cu line, a concentration associated with a standard deviation is obtained. A detailed analysis of variance (ANOVA) is applied to the series of line concentrations to detect any possible outlier (3). From ANOVA, a pooled variance that gives outlier statistics software a comparison of pairs of means for all values can be determined. If there is indication of one or several outliers, outlier statistics software rejects the most probable outlier, for instance by eliminating the line concentration that is either the maximum or the minimum one. If there is indication of another outlier after rejection of the first outlier, the procedure is repeated, and iteration is performed until no more outliers are observed, or if only two line concentrations remain.

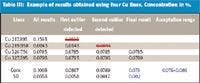
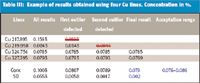
Table III: Example of results obtained using four Cu lines. Concentration in %.
Table III illustrates the outlier statistics software. The concentration obtained from the Cu 217.895-nm line is an outlier, which is confirmed by the outlier statistics software. However, iteration reveals that a second outlier is present, actually that from the Cu 219.958-nm line (Figure 5). Two lines remain, which leads to an element concentration of 0.079%, which is within the acceptation range (0.076–0.086%). The advantage of using multiline analysis is shown with this sample. The strong interference on the Cu 217.895-nm line actually is assigned to a W line. When the multiline selection software was applied to the determination of Cu, the maximum expected W concentration was 10 mg/L. Under this assumption, the influence of W on the Cu 217.895-nm line was found to be negligible. However, an unexpected higher concentration of W actually is present in the sample (120 mg/L) and produces a significant spectral interference. Clearly, use of multiline analysis makes it possible to cope with unexpected spectral interferences.

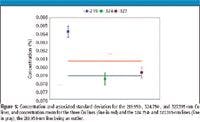
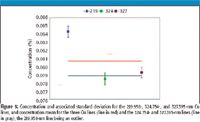
Figure 5
Conclusions
Based upon a comprehensive and detailed spectra database obtained with the CCD-based ACTIVA system, full benefit of multiline analysis can be obtained by facilitating the selection of several lines per element with the multiline selection software tool, and by rejecting any possible outlier among the concentrations with the outlier statistics software tool. A reliable, single concentration can be deduced for each analyte.
Jean-Michel Mermet is with Spectroscopy Forever, Tramoyes, France. Agnès Cosnier, Emmanuel Fretel, Sébastien Vélasquez, Alexandre Grigoriev, and Cendrine Dubuisson are with HORIBA Jobin Yvon, based in Longjumeau, France.
References
(1) J.M. Mermet, A. Cosnier, Y. Danthez, C. Dubuisson, E. Fretel, O. Rogérieux, and S. Vélasquez, Spectroscopy 20(2), 60–68 (2005).
(2) Y. Danthez, C. Dubuisson, E. Fretel, J.M. Mermet, and O. Rogérieux, Spectroscopy, Applications of ICP and ICP-MS Techniques for Today's Spectroscopist, 14–19 (2005).
(3) D.L. Massart, B.G.M. Vandeginste, L.M.C. Buydens, S. De Jong, P.J. Lewi, and J. Smeyers-Verbeke, Handbook of Chemometrics and Qualimetrics : Part A (Elsevier, Amsterdam, 1997), chapter 6.


Inside the Laboratory – The Petrochronology Group at University of California, Santa Barbara
January 29th 2024In this edition of “Inside the Laboratory,” John Cottle, PhD, a professor of geology at the University of California, Santa Barbara, and a member of Spectroscopy’s Editorial Advisory Board, discusses his group’s most recent work using “laser ablation split steam” analysis to measure elemental concentrations and isotopic ratios in rocks and minerals.


