Optimizing FT-IR Sampling for a Method to Determine the Chemical Composition of Microbial Materials
Algae and other aquatic species are promising sources for biomass that can be economically converted into fuel, and several infrared sampling techniques can be used to analyze these samples.
The need for new energy sources has been a major concern for many years. The fear over global warming and CO2 emissions has drastically increased the worldwide awareness of this critical problem. The conversion of biomass into fuel is one of the most promising technologies to replace fossil fuels as a main energy source, particularly for transportation. Although food crops such as corn and soybeans have been successfully used to create bioethanol and biodiesel, the use of food crops and viable farmland is not really a sustainable long-term solution. A great deal of research is being funded to investigate alternative sources of biomass that can be economically converted into fuel. Algae and other aquatic species appear to be one of the most promising sources for the large quantities of biomass required for a successful biofuels program. The concept of producing biofuels from algae is not a recent idea and government funding for this research has been significant. A report from the National Renewable Energy Laboratory (Golden, Colorado) provides an excellent background in this area, describing research that started in 1978 and extended over 20 years (1). One reason for the interest in algae as a source of biodiesel is that CO2 and a source of nutrients are required for biomass production. In one scenario, large algae "farms" are positioned near power plants or incinerators to convert their waste CO2 into biomass. Waste-treatment facilities also could provide most of the required nutrients.
The rapid growth of many microalgae species is not only valuable for production, but greatly reduces the time required to optimize the strains for biofuels. A number of research groups are attempting to increase the amount of lipid produced by the algae under normal conditions through genetic improvements. Fourier-transform infrared (FT-IR) spectroscopy has been used extensively to characterize the chemical composition of biological systems including bacteria, single cells, and tissues (2–6). The infrared spectrum contains peaks that correspond to the presence of protein, carbohydrates, and lipids, as well as DNA and other biomolecules commonly found in cells. In a recent paper, Pistorius and colleagues (7) describe a method to determine the protein, carbohydrate, and lipid content in biomass from algae and other microbiological sources. Their analysis is based on obtaining a high quality FT-IR spectrum from a sample of microalgae and determining the amount of specific components in the sample based on specific features in the spectra. The authors emphasized that the sample preparation is a key step to obtaining reproducible results. In this paper, several different infrared sampling techniques will be described that can be used to analyze microbiological samples. The goal of this work was to identify a cost-effective technique that might greatly increase the number of samples that can be analyzed with automated spectroscopy.
Experimental
Portions of dried samples of different algae specimens were directly analyzed by attenuated total reflectance (ATR) spectroscopy. Aqueous suspensions of the material were deposited on various substrates for both transmittance and reflectance studies. The actual chemical compositions of the algae samples available for this study were unknown. An analytical method modeled after the work of Pistorius and colleagues was created using Thermo Scientific OMNIC TQ Analyst software (Thermo Fisher Scientific, Waltham, Massachusetts).
The key parameters from their work that were used in this analysis method are shown in Table I.


Table I: Key parameters of the Pistorius method (7) used in this study
When the method was applied to ATR spectra, the actual scale factors reported in the Pistorius method were adjusted to account for the different relative intensities observed with the ATR spectra. Figure 1 shows the screen in TQ Analyst that sets up the spectral region used to determine the protein concentration.

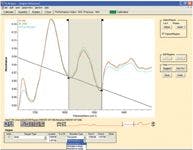
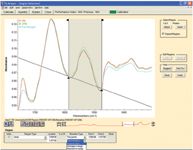
Figure 1: Selecting the protein spectral region in OMNIC TQ Analyst software.
FT-IR spectra were obtained from several samples of algae using ATR spectroscopy, transmission spectroscopy, reflectance spectroscopy, and infrared microscopy. A Thermo Scientific Nicolet iS 10 FT-IR spectrometer configured with a Smart iTR diamond accessory (Thermo Fisher Scientific) was used to obtain spectra from dried algae. All spectra were acquired at 4-cm-1 resolution with a room temperature DTGS (deuterated triglycine sulfate) detector in less than 1 min. The pressure tower on the accessory applies a constant pressure on the sample, producing consistent spectra from the different samples. The transmission spectra were acquired using the same FT-IR spectrometer and the Smart OMNI-transmission accessory. The samples were deposited from aqueous solution onto barium fluoride or silicon windows, a polyethylene microporous membrane, or polytetrafluoroethylene (PTFE) membrane. For the reflectance study, the samples were deposited onto an aluminum foil surface marked with 96 positions consistent with a standard well-plate format. A Nicolet 6700 spectrometer (Thermo Fisher Scientific) with an automated well-plate reader was used with the OMNIC Array Automation software to analyze the samples deposited on the aluminum foil surface. The infrared microscope transmission data were obtained with a Nicolet 6700 FT-IR system and a Continuum infrared microscope configured with an automated X,Y stage.
Results and Discussion
ATR spectroscopy is an excellent technique to rapidly characterize discrete samples. The dried material is pressed against the 2-mm diameter ATR crystal and a spectrum is acquired. The depth of penetration into the sample in the ATR experiment is wavelength dependent and results in relatively lower intensity of the peaks in the higher wavenumber region. The peak intensity is also related to the total amount of sample in contact with the crystal. Thus, sample hardness and particle size can change the intensities of the peaks slightly, and spectra should be corrected before calculating the amount of each component. Although the samples were prepared for automated reflectance analysis, ATR spectra were also acquired from the algae deposited on the aluminum foil surface. These spectra were similar to the ones obtained by placing the dried algae directly on the ATR crystal. Figure 2 shows the ATR spectra from different algae samples that were acquired.

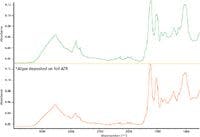
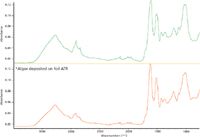
Figure 2: ATR spectra from powdered algae (top) and algae deposited on an aluminum foil surface (bottom).
One of the objectives of this research was to develop a better understanding of ways that the automated sampling techniques created for pharmaceutical high-throughput screening systems might be applied to the analysis of algae. In particular, can the automated weighing, dilution, and deposition systems designed around the 96-well SBS format improve productivity in FT-IR analysis of biological materials? A number of years ago, 3M (St. Paul, Minnesota) introduced a disposable IR sampling card based on a polymer microporous membrane. A publication by Mosoba and colleagues (8) reports using a polyethylene microporous film with this sampling concept to obtain FT-IR spectra from bacteria samples. They created a multiple-sampling method by stretching the film across the holes in an autosampler wheel. A plate with 96 holes in a well-plate format or a microscope slide with 16 holes also could be developed for automated sampling.
A major point of these analyses is to measure the amount of lipid in the algae samples using infrared spectroscopy. The analytical method described in the Pistorius publication uses the spectral features in the C-H stretching region to determine the lipid content. However, the spectral features from the polyethylene film are very similar to those from lipids, creating a large cross interference problem. The PTFE polymer shows no interference in the C-H stretch region and has no features in the amide or carbonyl regions, although the strong infrared peak for PTFE near 1200 cm-1 results in some spectral distortion near the region employed for the carbohydrate analysis. Figure 3 shows spectra from the two polymer films and from algae samples after subtraction of the spectra from the reference films. Although some spectral artifacts are observed from the polymer, the use of microporous polymer film as a sample substrate would result in a very low cost disposable sampling system.

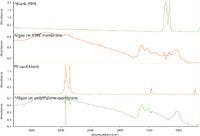
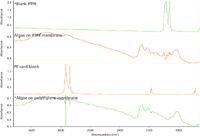
Figure 3: Transmittance spectra from algae samples deposited on polyethylene and PTFE microporous films.
In a previous project, biological samples were deposited from a saline solution onto small 5-mm squares of barium fluoride (BaF2) and dried before the acquisition of spectra in transmittance (2). Barium fluoride is an excellent IR window and is not soluble in water. However, it is quite expensive and probably would not be considered a disposable sample holder by most laboratories. An alternative approach that looks very promising is to deposit the samples on small squares of polished silicon that have been cut from a semiconductor wafer. A number of surplus double side polished 8-in. silicon wafers were purchased and were diced into 0.25-in. squares.
Figure 4 shows the spectrum obtained by depositing an aqueous suspension onto a barium fluoride window and the spectrum from a bacteria sample deposited onto a silicon square after subtraction of a silicon reference spectrum. This figure shows the similarities and differences between the algae and bacteria samples. A plastic holder was designed to hold the silicon and BaF2 squares. For compatibility with microscope slide handling stages, a 1 × 3 in. silicon sample holder was also designed, allowing use in a high throughput sampling system that matches two columns in the standard 96-well format. Another alternative sampling technique is to use a single piece of silicon with 96 shallow wells created by a gasket. The silicon piece is mounted in a frame consistent with the SBS 96-well form factor. In a related study, samples of bacteria were deposited and dried on a silicon 96-spot plate (Pike Technologies, Madison, Wisconsin). Spectra were acquired from the samples deposited on the plate using a Nicolet 6700 FT-IR spectrometer and a Continuum infrared microscope configured with a high-precision X,Y stage and a modified version of the OMNIC Array Automation software. Infrared microscopy is very valuable for obtaining high quality spectra when the amount of sample is limited to less than a milligram. The sampling area in the ATR experiment and transmission is 2–5 mm, while the sampling area with an infrared microscope is routinely 100 μm and can be less than 10 μm. The Array Automation software would permit the analysis of micro-arrays including the SBS standard 1536-well plate format.
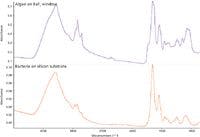
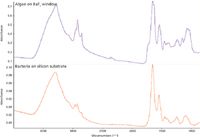
Figure 4: An algae sample deposited on barium fluoride and a bacteria sample deposited on silicon.
A final, very promising, sampling technique is automated reflectance analysis. This involves depositing the algae samples onto a highly reflecting surface, such as aluminum foil, in an array format. In this example, the samples were deposited in a 96-well format and analyzed using the reflectance option with the well plate reader. The optical layout of the reflectance module that is positioned over the X,Y stage is shown in Figure 5.

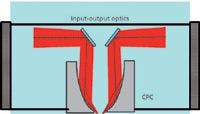

Figure 5: Diagram of the reflectance optics module used in the array autosampler.
The 96-spot foil containing the samples was taped to a metal plate that mounted in the automated X,Y stage. A spectrum from a well with no sample was acquired as a background. Spectra were then automatically acquired from the original samples. Figure 6 shows the screen after the software has acquired the data. The color of each well in the schematic in the upper left corresponds to the magnitude (result) of the chemometric analysis selected. This could be as simple as the intensity of the amide band from the protein, the similarity to a target spectrum, or the amount of lipid in the sample. In this case, the color corresponds to the amount of lipid in the sample based on this implementation of the Pistorius method (7). The wells colored red or orange correspond to samples containing more lipid material.

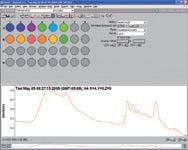
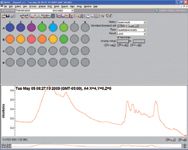
Figure 6: Screen showing the Array Automation results using the amount of lipid as the metric to color the wells.
Conclusions
Many of the FT-IR techniques that have been reported for classifying and characterizing clinical samples can be applied to analyzing materials developed for use in biofuels. In this feasibility study spectra from algae samples were obtained using a number of different infrared sampling techniques, forming a basis for developing rapid screening methods to determine the lipid content of microbiological species intended for biofuels. These techniques would prove valuable during several steps in the development process including optimizing the algae strains through the actual production of biomass to ensure that the algae species are remaining true and are not contaminated by wild organisms.
For a small number of samples, ATR spectroscopy provides an easy nondestructive way to quickly determine the chemical composition of dried samples. For applications with a large number of samples, the use of a "well plate" based on the microporous membrane would provide a low-cost way to rapidly analyze multiple samples. Multivariate statistical techniques could be employed to eliminate interference from the spectral features because of the polymer film, which might otherwise limit its general use. One interesting possibility of using a microporous film as the sample substrate is filtering samples directly onto the substrate using an automated 96-sample filtering system.
The robust nature and relatively low cost of silicon make it an excellent choice as a substrate for a 96-well plate. Transmission sampling plates can be produced from a single piece of silicon (120 × 85 mm) with 96 sample positions or a plate that mounts 96 individual disposable windows. The results of the reflectance analysis using the Array Automation system are also very promising, and this appears to be an easy method for analyzing multiple samples. As with any analytical application, the best method depends on the details of the analysis. However, FT-IR spectroscopy has the flexibility and specificity to deliver a robust solution optimized to the specific problem.
References
(1) J. Sheehan, T. Dunahay, J. Benemann, and P. Roessler, "A Look Back at the U.S. Department of Energy's Aquatic Species Program-Biodiesel from Algae", NREL/TP-580–24190 (1998).
(2) S.R. Lowry, Cellular and Molecular Biology 44, 169–177 (1998).
(3) D. Naumann, D. Helm, and H. Labischinski, Nature 351, 81–82 (1991).
(4) K. Stehfest, J. Toepel, and C. Wilhelm, Plant Physiology and Biochemistry 43, 717–726 (2005).
(5) A.P. Dean, M.C. Martin, and D.C. Sigee, Phycologia 46, 151–159 (2005).
(6) D.L. Wetzel, A.J. Eilert, L.N. Pietrzak, S.S. Miller, and J.A. Sweat, Cellular and Molecular Biology 44, 145–168 (1998).
(7) A.M. Pistorius, W.J. DeGrip, and T.A. Egorova-Zachernyuk, Biotechnology and Bioengineering 103, 123–129 (2009).
(8) M.M. Mossoba, F.M Khambaty, and F.S. Fry, Applied Spectroscopy 56, 732–736 (2002).
Steve Lowry is Application Scientist, Molecular Spectroscopy, with Thermo Fisher Scientific, Waltham, Massachusetts.


Measurement of Ammonia Leakage by TDLAS in Mid-Infrared Combined with an EMD-SG Filter Method
April 9th 2024In this article, tunable diode laser absorption spectroscopy (TDLAS) is used to measure ammonia leakage, where a new denoising method combining empirical mode decomposition with the Savitzky-Golay smoothing algorithm (EMD-SG) is proposed to improve the signal-to-noise ratio (SNR) of absorbance signals.


