Practical Group Theory and Raman Spectroscopy, Part II: Application of Polarization
Polarized Raman spectra are presented along with a discussion of the association of the symmetry species of the normal vibrational mode and the depolarization ratio of Raman scattering.


In this second installment of a two-part series we present polarized Raman spectra and discuss the association of the symmetry species of the normal vibrational mode and the depolarization ratio of Raman scattering. We discuss those aspects of molecular symmetry and Raman polarization rules that can be applied with normal Raman instrumentation. Materials include liquids, single crystals, and polycrystalline compounds.
The excitation in Raman spectroscopy is usually linearly polarized monochromatic light from a laser. The Raman scattered light can be polarized parallel or perpendicular with respect to the incident laser polarization depending on the symmetry species of the vibrational modes. Normally, Raman spectroscopy is performed without a polarization analyzer so that both polarizations of the Raman scattered light are collected to maximize the signal. This is frequently a sensible choice. However, there are instances for which the use of a Raman polarization analyzer can be helpful in both band assignment and the characterization of molecular or solid-state structure.
In part I (1), we summarized and presented the most salient and beneficial aspects of group theory when applied to vibrational spectroscopy in general and Raman spectroscopy in particular. Here, we apply that knowledge to Raman spectra obtained from liquids, single crystals, and polycrystalline compounds. The treatment of polycrystalline compounds is a cautionary tale about the importance of Raman sampling and sample grain size relative to that of the incident laser beam.
Polarized Raman Spectroscopy of Water
Recall that in the first part of this series we discussed the normal vibrational modes of water. We found that there were three Raman active modes, two stretching and one bending. Furthermore, we found that the bending mode (ν2) and one of the stretching modes (ν1) are totally symmetric (A1) and therefore polarized, whereas the antisymmetric stretch (ν3, B2) is depolarized. The polarized Raman spectra of water shown in Figure 1 includes the depictions of the normal vibrational modes that we presented in part I (1). Spectra are shown in the parallel and perpendicular polarized configurations and all three of the normal vibrational modes can be assigned based on their energies and polarization responses. There are several things to notice in these spectra. First, you see that the energy of the bending mode, which appears in the so-called fingerprint region of the vibrational spectrum, is substantially less than that of the stretching modes. Second, note how much more intense either the symmetric or antisymmetric stretching modes are relative to the angle bending mode. As a general rule, the symmetric stretches of bonds tend to yield stronger Raman bands.

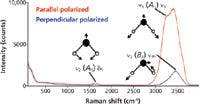
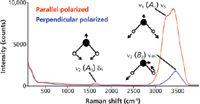
Figure 1: Polarized Raman spectra of H2O.
It is often said that Raman spectroscopy is the vibrational spectroscopy of choice for the analysis of analytes in aqueous solutions. The Raman spectrum of water demonstrates why that statement has considerable merit. The angle bending mode at 1635 cm-1 is weak and produces little background or band interference in the fingerprint region. The presence of the weak angle bending band leaves the entire fingerprint region without any substantial background, and this is the basis for the claim that Raman spectroscopy can readily be applied to the analysis of aqueous solutions. The stretching modes beyond 3000 cm-1 are significantly more intense and broader. The substantial width of the stretching modes of water can be attributed to H bonding. The entire OH stretching from two allowed bands covers the region from approximately 2900 cm-1 to 3700 cm-1! The Raman spectrum of water is a remarkable demonstration of the distribution of vibrational energy states created by H bonding in the liquid state.
Carbon Tetrachloride, Depolarization Ratios, and Isotopic "Splitting"
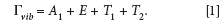
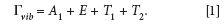
Carbon tetrachloride, CCl4, is sometimes referred to as the Raman spectroscopist's favorite molecule for teaching purposes. The molecular structure of CCl4 is tetrahedral and belongs to the point group Td. The set of Raman active vibrational modes is given by

The four (1 A1, 1 E, 1 T1, and 1 T2) normal modes of vibration are assigned to the bands in the CCl4 spectrum shown in Figure 2. A fifth band at 762 cm-1 is assigned the combination mode T2 + A1. This band is an example of combination mode Raman scattering that can sometimes appear in conjunction with the first order normal modes, the so-called fundamental vibrational modes. The topic of second order and combination mode Raman scattering and group theory is beyond the scope of this work; perhaps we will address this in another installment. From the equation above, we should expect to see one Raman band that is polarized, the totally symmetric A1 species. The band at 459 cm-1 is easily identified as the A1 totally symmetric stretch because the signal nearly vanishes with the Raman analyzer configured perpendicular to the incident laser polarization.


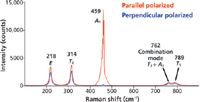
Figure 2: Polarized Raman spectra of CCl4.
The remaining E, T1, and T2 bands should be depolarized and we can see that the ratio of perpendicular to parallel Raman scattering strength conforms to the expected value of 0.75. The low energy bands at 218 and 314 cm-1 are attributed to bending modes of E and T2 symmetry, respectively. That leaves the band at 789 cm-1 assigned to the fourth fundamental mode of species T1. You may be asking yourself: On what basis did we assign the 789 cm-1 band rather than the 762 cm-1 band to the T1 mode? The justification is that the addition of 314 and 459 cm-1 equals 773 cm-1, which is close to and just a little higher in energy than the 762 cm-1 band. Combination and second order bands normally appear at energies slightly less than the values expected from addition or multiplication of the fundamental modes. Therefore, we assign the 762 cm-1 band to the T2 + A1 combination mode and the 789 cm-1 band to the fourth fundamental mode of species T1.
Now, let's look a little more carefully at the A1 symmetric stretch at 459 cm-1, which appears to split into several bands. An expanded plot of the A1 band is shown in Figure 3. The spectral resolution of this measurement is such that one can resolve five adjacent bands designated ν1a through ν1e. The fine structure that you see in this band is attributed to what is referred to as isotopic splitting. However, this is not actually splitting in the familiar sense of the word because no degeneracy has been lifted to separate energy levels. Rather, the fine structure is because of the naturally occurring relative abundances of isotopic Cl, which is approximately 25% 37Cl and 75% 35Cl (2).


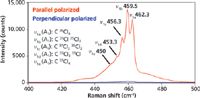
Figure 3: A1 Symmetric stretching band of CCl4. The band is split in accordance with the isotopic abundance of Cl.
An interesting observation is that only C35Cl4 and C37Cl4 (ν1a and ν1e) retain true Td symmetry, whereas C37Cl35Cl3 and C37Cl335Cl (ν1b and ν1d) belong to C3v and C37Cl235Cl2 (ν1c) belongs to C2v. Therefore, the degeneracy is lifted in the E and T modes for the C3v and C2v species and we might expect to see splitting of those bands. However, the isotopic mass induced symmetry differences are sufficiently small such that the collisional broadening in the liquid prevents the splitting from being resolved in the lifting of degeneracy in the E and T modes. The fact that the polarization ratio of the isotope components remains very small is further evidence for the lack of a reduction of the symmetry from Td to C3v, or C2v.
The Raman Scattering Strength of Totally Symmetric Modes
In part I (1), we discussed whether vibrational modes will be Raman active, infrared active, or silent and found that the application of group theory based on the symmetry of the molecule provides the tools to help us make those decisions as well as understand and interpret spectra. Beyond Raman activity alone, the Raman scattering strengths of particular vibrational modes and the relative intensities that we observe in a spectrum are just as important to us. Is there any way that group theory can help us understand that aspect of Raman spectra based on signal strength? Well, not directly. However, it happens that the totally symmetric vibrational modes are associated with the largest changes in polarizability with respect to the vibrational modulation of the bond, the Raman polarizability. Furthermore, the greater the change in vibrationally modulated polarizability, the greater the Raman signal strength will be.
To get an appreciation of this empirical fact, let us look at the polarized Raman spectra of toluene and acetonitrile shown in Figures 4 and 5, respectively. Toluene belongs to point group Cs and can be thought of as a mono-substituted benzene (D6h). Recall that only the totally symmetric vibrational modes are polarized, and we see from the character table of Cs that the A' species is Raman active. Inspection of the Raman spectrum of toluene in Figure 4 reveals that the most intense Raman bands in the fingerprint region at 521, 786, 1003, 1030, and 1210 cm-1 are all polarized and therefore of A' symmetry. Conversely, those bands that are not polarized are significantly weaker than the totally symmetric vibrational modes.

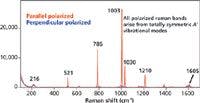

Figure 4: Polarized Raman spectra of toluene.
Now let's consider an entirely different molecule with respect to chemical bonding and molecular structure, one that is not aromatic. Acetonitrile belongs to point group C3v, and its spectrum is shown in Figure 5. The most intense Raman bands appear at 919, 2253, and 2943 cm-1 and all three are polarized. Let's focus on the two bands at 2253 and 2943 cm-1 because of what they tell us about the importance of totally symmetric modes and their relationship to Raman signal strength. The 2253 cm-1 band is assigned to the CN symmetric stretch and the 2943 cm-1 band to CH stretching. Both are very intense and one might have supposed that based on functional group character alone that the CN stretch would be far more intense because of the CN triple bond. Although bond order and functional group identity are indeed important and suggestive regarding Raman scattering strength, you can see that the nature of the symmetry species to which the vibrational mode belongs can be just as important to Raman signal strength.

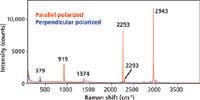
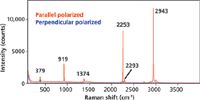
Figure 5: Polarized Raman spectra of acetonitrile.
Polarized Raman Spectroscopy of Single-Crystal LiNbO3
We now move from liquids to considering single crystals. LiNbO3 is a technologically important material with a high nonlinear susceptibility and electro-optic coefficient. At room temperature it is a ferroelectric with a crystal structure belonging to the C3v crystal class. The complete set of vibrational modes is given by

where the A1 and E modes are both Raman and infrared active and the A2 modes are silent. LiNbO3 is often used for optical frequency doubling because of its large d33 nonlinear coefficient. The conventional approach for second harmonic generation with LiNbO3 is to guide an incoming laser beam incident upon the X-face of the crystal and polarized along the Z-axis. Using that same configuration, polarized Raman spectra of the X-face with the incident laser beam polarized along the Z-axis are shown in Figure 6.

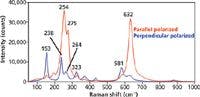
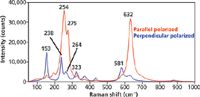
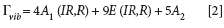
Figure 6: Polarized Raman spectra of the X-face of single crystal LiNbO3 with the incident laser polarized along the Z-axis.
Configuring the Raman analyzer parallel to the incident polarization selects the A1 Raman bands. Unlike a liquid in which the molecules are randomly oriented in space, the chemical bonds in a crystal are all oriented in particular directions and not all Raman bands can necessarily be detected from one face of a single crystal. Therefore, one should not expect to see all Raman bands when examining a single crystal face, particularly if the crystal face examined is a crystallographic X-, Y-, or Z-axis face. The Raman bands at 254, 275, and 632 cm-1 are three of the four allowed A1 Raman bands of LiNbO3. Keeping the laser beam fixed with Z-axis polarization but rotating the Raman analyzer 90° to the perpendicular configuration selects the E modes. Note the dramatic difference in parallel and perpendicular polarized Raman spectra obtained from single crystals compared to the parallel and perpendicular spectra acquired from a liquid sample. In a liquid you are sampling all orientations of the molecule in space, whereas in a crystal the chemical bonds are all oriented in space in accordance with the crystal class to which the compound or element belongs.
The forms of the Raman polarizability tensors for crystals are dictated by the symmetry of the crystal. By this we mean that whether a specific Raman polarizability tensor element is zero or nonzero is dictated by the crystal symmetry (3). For LiNbO3 the same spectrum will be obtained whether the incident laser beam is polarized along the Z-axis or the Y-axis if the Raman analyzer is configured perpendicular to the incident polarization for the backscattering arrangement. We invite you to watch a short lecture explaining the polarized Raman spectroscopy of LiNbO3 and a real time demonstration of polarized Raman spectral acquisition with a single crystal at https://www.youtube.com/watch?v=96ob6wY-6t8.
Crystals from a Reagent Bottle
Now that you've seen the dramatic effects of crystal symmetry and orientation with respect to the single crystal Raman experiment you should be better prepared to face the challenges of Raman sampling when dealing with polycrystalline materials. You can encounter laser polarization and crystal orientation effects similar to that of single crystals when analyzing crystalline samples sprinkled onto a glass slide from a reagent bottle. Figure 7 shows reflected light images of rubrene grains on a microscope slide. The crystal system of rubrene is orthorhombic and the predominant form of these crystals belongs to the D2h crystal class with 4 molecules per unit cell (4). In fact, you can see that orthorhombic structure manifest in the crystal habit of grain R_3 in Figure 7. Grain R_1 shows no particular orientation whereas the crystallographic axes and faces of grain R_3 can be assigned according to its crystal habit and are depicted on the grain.

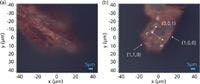

Figure 7: Reflected light images of rubrene grains (a) R_1 and (b) R_3.
The Raman active modes of D2h rubrene are species Ag, B1g, B2g, and B3g wherein the B1g, B2g, and B3g modes have off-axis nonzero Raman tensor elements for combinations of all three axes. Therefore, one can expect a rich variety of spectra from a collection of single grains randomly oriented on the microscope slide. The Raman spectra of grains R_1 and R_3 acquired at the center of each image and without the use of a Raman analyzer (no polarization selection here) are shown in Figure 8. The spectrum of R_3, the blue trace, was acquired with the incident laser beam polarized off axis but within the ab crystallographic plane. Grain R_1 is not oriented in any obvious way relative to the crystallographic axes and its Raman spectrum is the red trace. Here, you see two grains of the same compound taken from the same reagent bottle and yet they produce significantly different spectra with respect to the relative intensities of the bands. That last point is important. If you look carefully, you will see that the band positions of the red and blue traces do indeed match; it is simply the relative intensities of the bands that differ, which can lead one to falsely conclude that the two samples are chemically not the same when in fact they are.


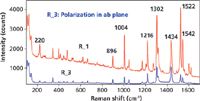
Figure 8: Raman spectra of different grains of rubrene.
Conclusions
In this second of a two-part series we presented polarized Raman spectra and discussed the association of the symmetry species of the normal vibrational mode and the depolarization ratio of Raman scattering. We demonstrated that although bond order and functional group identity are indeed important and suggestive regarding Raman scattering strength, the nature of the symmetry species to which the vibrational mode belongs can be just as important to Raman signal strength. The experimental application of polarized Raman spectroscopy for single crystals was demonstrated with the uniaxial ferroelectric crystal LiNbO3. Finally, the Raman spectra of individual grains of rubrene from a reagent bottle demonstrated the challenges of Raman sampling when dealing with polycrystalline materials.
References
(1) D. Tuschel, Spectroscopy 29(2), 14–23 (2014).
(2) M. Diem, Introduction to Modern Vibrational Spectroscopy (Wiley-Interscience, New York, 1993), p. 181.
(3) D. Tuschel, Spectroscopy 27(3), 22–27 (2012).
(4) J.R Weinberg-Wolf, L.E. McNeil, S. Liu, and C. Kloc, J. Phys.: Condens. Matter 19, 276204 (15pp) (2007).
David Tuschel is a Raman applications manager at Horiba Scientific, in Edison, New Jersey, where he works with Fran Adar. David is sharing authorship of this column with Fran. He can be reached at: david.tuschel@horiba.com.


David Tuschel


