Raman Analysis of Si Crystallinity
Application Notebook
While crystalline silicon (c-Si) is still the material of choice for modern solar cell manufacturing, the drive toward lower cost, more efficient solar cells is prompting a renewed interest in thin-film amorphous silicon (a-Si). In light of this, it is more important than ever to have the ability to quickly identify Si crystallinity, both qualitatively and quantitatively. In this application note, we evaluate how a portable Raman spectrometer can be used in conjunction with a portable video microscope to measure crystallinity.
While crystalline silicon (c-Si) is still the material of choice for modern solar cell manufacturing, the drive toward lower cost, more efficient solar cells is prompting a renewed interest in thin-film amorphous silicon (a-Si). In light of this, it is more important than ever to have the ability to quickly identify Si crystallinity, both qualitatively and quantitatively. In this application note, we evaluate how a portable Raman spectrometer can be used in conjunction with a portable video microscope to measure crystallinity.
For this study, the i-Raman® from B&W Tek, was chosen due to fact that it is the highest resolution (~3 cm-1 ) portable Raman spectrometer on the market. This, in conjunction with its TE cooled CCD and convenient fiber optic probe, made it the ideal solution for both "at line" and laboratory measurement. The minimal fluorescence background of Si allowed for the use of 532 nm excitation to take advantage of the higher photon energy and shallower penetration depth as compared to longer excitation wavelengths.
Experiment and Results
In the experiment, the i-Raman® was coupled to the BAC151A video microscope from B&W Tek to facilitate accurate sample positioning for the measurement. Figure 1a shows the experiment setup of the i-Raman® and the video microscope sampling system. The sample set for this experiment contained samples with differing crystallinity, ranging from < 10% to pure crystalline Si. These Si samples were deposited on glass substrates.

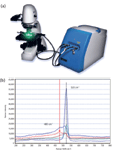
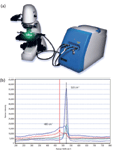
Figure 1: (a) Experimental setup of the i-Raman coupled to the BAC151A video microscope, and (b) Raman spectrum of Si at varying degrees of crystallinity.
Two Raman peaks are related to silicon crytallinity: the peak at 480 cm-1 is associated to the amorphous phase and the peak at 520 cm-1 is associated with crystalline Si.
Figure 1b overlays the Raman spectra of all five samples in the set. The red and blue spectra represent samples with a crystallinity < 10%, the brown spectrum is of a sample with a crystallinity between 40% and 60%, the green spectrum is of a sample with > 90% crystallinity and the dark blue spectrum is of pure c-Si. The shifting of the Si band from 480 cm-1 to 520 cm-1 can be clearly observed in the data. As silicon crytallinity increases, the amorphous peak 480 cm-1 reduces while the microcrystalline silicon peak 520 cm-1 emerges.
Figure 1b shows how Raman spectroscopy can easily be used as a qualitative measurement to determine the difference between a-Si and c-Si, but the high resolution of the iRaman® also makes it possible for the development of calibration curves using chemometric algorithms in a software package such as B&W Tek's new BWIQ™ software package. From these curves, a method can be developed for the quantitative analysis of Si crystallinity.
Conclusions
B&W Tek's i-Raman® spectrometer, when coupled with a BAC151A video microscope sampling system, is an ideal setup for Si crystallinity analysis. The compact form factor and light weight (~6.6 lb) of the i-Raman when coupled with low noise TE cooled detector and high resolution F/2 spectrograph make it the ideal solution for both laboratory and field analysis.
B&W Tek, Inc.
19 Shea Way, Newark, DE 19713
tel. (302) 368-7824; fax (302) 368-7830
Website: www.bwtek.com


The World of Microplastics Up to Date – an Overview
April 23rd 2024Watch this 20-minute educational video by Andreas Kerstan, Agilent Product Specialist in molecular spectroscopy, to gain a comprehensive update on the microplastics landscape and the environmental concerns related to them. Discover the current challenges in microplastics characterization and how Agilent innovative solutions and techniques, including FTIR, LDIR, GC/MS, and ICP-MS, are addressing these issues head-on.
Accurate Microplastics Analysis in Minutes, Not Hours
April 10th 2024The automated Agilent 8700 LDIR chemical imaging system lets you obtain high-quality images and spectral data faster than ever before. So, you can perform confident large-scale microplastics studies and monitoring activities.

