Raman Spectroscopy for Biomedical Applications
In this column, Fran Adar discusses what progress is being made in the application of Raman spectroscopy to studies of disease states and why it is worth the effort to pursue.


The application of Raman spectroscopy to studies of disease states results from an interesting confluence of spectroscopists and medical researchers. Vibrational spectroscopy has the potential to provide a wealth of information about biological materials, and spectroscopists who have established collaborations with medical researchers have been developing the field. The challenge is to determine how to extract the information from the data. There are two paths to achieve this goal. On the one hand, spectroscopists like to "interpret" spectra. A given molecule will have characteristic bands (1–3), and these spectra can be modified by many environmental factors. However, any biological system will have so many molecules, each of which has in principle hundreds of vibrational degrees of freedom, in all types of environments, that one can argue that spectral interpretations of the disease state will be nearly impossible. From the opposite approach, one can collect lots of data and subject it to multivariate (statistical) analysis; these tools enable the identification of spectral trends that are difficult to perceive visually (4,5). This column will consider what progress is being made in the field and why it is worth the effort to pursue.
As an example of work that followed the first method of investigation, we cite the work of Michael Feld (6), who used "bulk" spectra of atherosclerotic and normal tissues (elastic laminae, collagen fibers, smooth muscle, fat cells, foam cells, necrotic core, cholesterol crystals, β-carotene crystals, and Ca mineralization) as basis spectra for linear least squares minimization modeling of morphological structures of coronary artery tissue spectra. He succeeded in classifying these structures as nonatherosclerotic, calcified plaque, or noncalcified atheromatous plaque. Subsequent prediction of 68 coronary artery samples produced a 94% correct classification (64 samples).


Fran Adar
While it is tantalizing to be able to assign specific molecular species to biochemical, physiological, and disease states, there is a real risk of overinterpreting the results. As an example, Diem cites the mistaken association of glycogen as a marker for cervical cancer (page 6 of reference 5).
On the other hand, mapping unstained histological sections is a way of collecting large heterogeneous data sets. Without any a priori assumptions about the origins of the spectra, the data sets can be subjected to numerous unsupervised and supervised multivariate algorithms and the results can be correlated with pathological conditions (7,8).
In this installment of "Molecular Spectroscopy Workbench," I will give an overview of the development of Raman mapping for disease diagnosis. Certainly vibrational spectroscopy is not expected to be intuitive to medical practitioners, so why would one want to hurdle the barrier to merge the two fields? For one thing, there must be a need. Why do medical diagnosticians need another tool? The answer is obvious when one realizes that diagnosis is quite often not black versus white. For example, in the case of atherosclerosis, it is nearly impossible to predict when deposits can be classified as vulnerable plaque, which means they are susceptible to rupture resulting in a heart attack. In the case of cancer, there is often a continuous transformation from healthy tissue to a premalignant state (hyperplasia) to carcinoma in situ to metastatic–invasive cancer. The problem for the pathologist is to be able to recognize cancerous regions, identify their origins (when a metastasis provides the initial diagnosis), and define their boundaries. But because early states of the disease often do not have identifiable histological features, that identification is not always straightforward. And it is not unusual for two pathologists examining the same tissue to draw different conclusions. Note that the consequences for both false positives and false negatives are substantial. A false negative means that disease goes untreated. A false positive can result in physical disfiguration as well as emotional trauma. Any technique that can improve the results of the diagnostic process will be a valuable tool for the diagnostician.
Motivation for Applying Raman Spectroscopy to Clinical Applications
Why Raman? First let's discuss why vibrational spectroscopy (which includes Raman scattering and infrared absorption and other less well known techniques) has potential. The number of degrees of freedom in a complex molecule is equal to 3N – 6, where N is the number of atoms. For a large molecule there are essentially three degrees of freedom for each atom. Because a biopolymer can have tens if not hundreds of atoms, this is a large space. The spectra tend to be complex, but different types of molecules do exhibit characteristic behavior, so there is information encoded in the spectra. The challenge is to identify spectral characteristics that are associated with a disease state. Because of the complexity of the individual spectra and the complexity of the chemical mixtures, this can only be handled using statistical methods mentioned earlier.
Now, why Raman? Why not IR or near-IR (NIR)? Raman has the advantages over IR that water is not a large interferent, so spectra can be recorded in the "physiological" state. This is not the case for mid- or even NIR, where water absorption is high. Spatial resolution is also a big issue. The limiting spatial resolution is determined by the diffraction limit, which in turn is determined by the wavelength of the light. Visible wavelengths are shorter than mid- or NIR wavelengths, so the spatial resolution limit is greater (0.5 μm vs. ~10–50 μm or ~1–1.5 μm). In terms of histological samples, that means that a Raman microscope has the potential to image subcellular organelles, while IR probably cannot. It also means that smaller tumors can be imaged with Raman than with IR. (Note that while the NIR image resolution approaches that of Raman, absorption of water overtones and combinations is an issue, and the tissue bands, which are also overtones and combinations, tend to be much broader than the Raman bands, which means that the information content is lower.) This is not to say that IR imaging is not useful. Its application was developed earlier than Raman, and many chapters in current textbooks cite important work done in this field (4,5).
In order to convince the reader that Raman spectroscopy is worth pursuing, we reproduce here some spectra of relevant molecules. The upper five spectra in Figure 1 from top to bottom are sucrose (glucose–fructose dimer), olive oil, oleic acid (both of these are in the liquid form at room temperature), stearic acid (solid at room temperature), and cholesterol. The spectra clearly enable identification of material, but also enable differentiation of similar species. The olive oil can be differentiated from the oleic acid because the triglyceride (the oil) shows a >C=O band near 1750 cm–1 of the esterified carboxylic acid group. The stearic acid (which differs from oleic acid only in the absence of the double bond in the C18 chain) is solid (that is, crystalline), so its bands are much sharper, and the >C=C< band at 1650 cm–1 is, of course, not present. Cholesterol is in a class by itself, easy to differentiate, again with sharp bands due to the crystalline state. The lowest four tra represent spectra of four proteins — kangaroo tendon (collagen), skin (with contributions of lipids and other components as well), wool, and silk. Clearly there are many differences in these spectra, even though they are all protein, but to demonstrate the potential to derive information, we will focus on the Amide I band near 1650 cm–1; the variations in peak frequency and width that are related to the conformation and homogeneity of the peptide bonds.

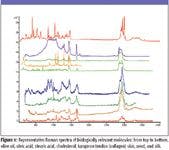
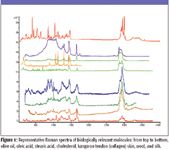
Figure 1
So what will make Raman microscopy of high interest to the medical researcher? The answer is that there will have to be a "killer" application. When Raman microscopy solves a clinical problem that cannot be addressed in any other way, it will gain attention (9). One can describe what is happening today as the academic prelude. The collaborations between clinicians and spectroscopists enable data collection on known samples. The data are examined to determine under what conditions they will be predictive of future, as-yet-unclassified cases. Ultimately, there will have to be clinical trials to validate the technology.
A simple technique was developed during World War II for binary classification of aircraft to understand how to maximize the identification of true positives while minimizing false positives and false negatives. The ROC curve was created and has since been applied to many fields, including medical diagnostics. It is a simple xy plot in which, for a given set of measurements, the x axis represents the probability for false positives and the y axis represents the probability for true positives. In a perfect classification scheme, a group of measurements would produce a point on the (0,1) point. In reality, there are always measurements that are false positives or false negatives. These measurements will fall on the curve above the 45° random line (10).

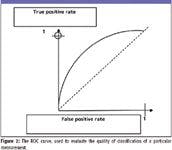
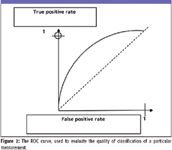
Figure 2
The idea is to apply a model to a collection of measurements and examine the behavior of the collection of predictions on the ROC curve. To put this into the context of Raman pathology, would the Raman measurements produce a better approach to the perfect (0,1) point than the current method? There are good reasons to believe that this is true because of the high information content in the Raman spectra and their relationship to the biochemistry of the materials.
Why would one expect a Raman measurement to be better? The answer lies in why the current methods are limited. The reality is that the histology and pathology depend upon morphological changes. But one must assume that biochemical changes have to happen before they are reflected in the histology. To take the case of cancer detection, how does one decide that dysplasia has progressed to cancer? The fact that the pathologists disagree means that the microscopic morphology is not totally clear. But a spectroscopic measurement has a chance to provide more detail, especially if multivariate methods are used to reveal information that is hidden in the overlapping bands. Another example of the usefulness of a spectroscopic-based decision would be to identify the origin of a metastasis when its appearance is the first indication of disease. When the histology does not clearly indicate the tumor's origin, there again is the possibility that a spectroscopic-based measurement could.
Actually there is one more point that can be made. In developing accurate spectroscopic models, often it is decided not to include cases in which there is a discrepancy between pathologists. It would really be interesting to see how the spectroscopic models would classify these cases, and then to follow them in time to see if the prediction proved correct.
Instrumentation and Measurement Conditions
By its very nature, biological tissue has a high probability not to be fluorescence-free. For this reason, NIR lasers often are used for measurements. Fourier-transform (FT)-Raman was developed in 1990 to make measurements with a Nd:YAG laser (1.064 nm). Since that time, many applications were developed because of the ability to acquire routine, fluorescence-free spectra. However, during the same period, dispersive Raman instruments with NIR lasers also were becoming available, and eventually it is was seen that the dispersive instruments were more sensitive and required lower laser power (which now resulted in less sample damage), so the Raman microscopes that are being used are of the dispersive type. By surveying the literature, one can find that most measurements are made with 785- or 830-nm diode lasers. There is a trade-off between sensitivity at shorter wavelength, fluorescence avoidance at longer wavelength, and the goal to detect in the 700–900 nm range, where self-absorption is minimal and penetration is maximized.
For those materials that are highly scattering, spatial resolution is compromised, and it becomes difficult to measure subsurface material. This problem is being approached with the development of spatially offset Raman scattering (SORS) (11). In this scheme, Matousek (11) has shown that it is possible to collect subsurface Raman signals from well-defined locations by offsetting the collection optic axis from the laser illumination axis by an amount corresponding to the scattering of the light. This technology is currently being commercialized.
As a corollary to SORS, it has been recognized that it is possible to collect "average" spectra from high scattering samples by transmission measurements that, in fact, take advantage of the scattering to assure that the signals are generated from the entire sample rather than just a localized spot.
Of course, the clinically most relevant measurement would be to make an in-situ measurement (that is, with an endoscopic probe). Such probes have been reported in the literature (12,13) and are currently being developed by a number of research groups.
Active Areas of Raman Research
An extensive review of all the areas that are under active research is well beyond this article. Interested readers are directed to the literature; in particular, references 7 and 8 have been published in the last 12 months and represent a good place to start. At the risk of excluding some important research groups, I can list those groups that have contributed significantly in recent years. My apologies to anyone whose work is not listed.
Bone and Other Mineralized Tissue
Professor Michael Morris, University of Michigan
Professor Richard Mendelsohn, Rutgers University, Newark
Professor Ozan Akkus, Purdue University
Dr. Lin-P'ing Choo-Smith, NRC Winnipeg
Skin
Professor Gerwin Puppels, Erasmus University, Rotterdam
Professor Michael Morris, University of Michigan
Professor Richard Mendelsohn, Rutgers University, Newark
Dr. C. Hadjur, L'Oreal Recherche
Professor Michel Manfait, Universite de Reims
Chil-Hwan Oh, Korea University
Atherosclerosis
Professor Michael Feld, Massachusetts Institute of Technology
Dr. Lin-P'ing Choo-Smith, NRC Winnipeg
Professor Gerwin Puppels, Erasmus University, Rotterdam
Cancer
Professor Max Diem, Northeastern University
Professor Nicholas Stone, Gloucestershire Hospital
Professor Christoph Krafft, Dresden University
Professor Michel Manfait, Universite de Reims
Professor Anita Mahadevan Jansen, Vanderbilt University
Multivariate Analysis
In our opinion, the success of this work will depend heavily upon the mathematical reduction of the data together with judicial selection of algorithms that produce results that "make sense" chemically and histologically.
Concluding Perspective
I believe that Raman does have the potential to succeed because of the high information content in the spectra that will enable the "killer" application in medical diagnostics. But, even though it will be difficult to ascribe spectral changes to specific biochemical changes or events, those changes are reflective of the biochemical state, and a statistical approach will provide correlations. It will be fun to watch these areas in the coming years and see in which fields Raman will have its first impacts. Perhaps a future column can treat one of these areas in more detail.
Fran Adar is the Worldwide Raman Applications manager for Horiba Jobin Yvon (Edison, NJ). She can be reached by email at: fran.adar@jobinyvon.com
References
(1) J. DeGelder, K. DeGussem, P. Vandenabeele, and L. Moens, J. Raman Spectrosc. 38, 1133–1147 (2007).
(2) J.M. Benevides, S.A. Overman, and G.J. Thomas, Jr., J. Raman Spectrosc. 36, 279–299 (2005).
(3) R. Tuma, J. Raman Spectrosc. 36, 307–319 (2005).
(4) Vibrational Spectroscopy for Medical Diagnosis, M. Diem, P.R. Griffiths, and J.M. Chalmers, Eds. (Wiley, New York, 2008).
(5) Biomedical Vibration Spectroscopy, P. Lasch and J. Kneipp, Eds. (Wiley, New York, 2008).
(6) H.P. Buschman, J.T. Motz, G. Deinum, T.J. Romeo, M. Fitzmaurice, J.R. Kramer, A. Van der Laarse, A.V. Bruschke, and M.S. Feld, Cardiovasc. Pathol. 10, 59–68 (2001).
(7) M.J. Romeo, R.K. Dukor, and M. Diem, "Introduction to Spectral Imaging, and Applications to Diagnosis of Lymph Nodes," Chapter 1 in Vibrational Spectroscopy for Medical Diagnosis, M. Diem, P.R. Griffiths, and J.M. Chalmers, Eds. (Wiley, New York, 2008).
(8) M.J. Romeo, S. Boydston-White, C. Matthaus, M. Miljkovic, B. Bird, T. Chernenko, P. Lasch, and M. Diem, "Infrared and Raman Microscopic Studies of Individual Human Cells," Chapter 2 in Vibrational Spectroscopy for Medical Diagnosis, M. Diem, P.R. Griffiths, and J.M. Chalmers, Eds. (Wiley, New York, 2008).
(9) Personal communication with Ishai Nir.
(10) A simple introduction to the ROC curve can be found on Wikipedia.
(11) N.A. Macleod and P. Matousek, Appl. Spectrosc. 62/11, 929A–304A (2008).
(12) J.F. Brennan III, Y. Wang, R.R. Dasari, and M.S. Feld, Appl. Spectrosc. 51/2, 201–208, (1997).
(13) Y. Hattori, Y. Komachi, T. Asakura, T. Shimosegawa, G. Kani, H. Tashiro, and H. Sato, Appl. Spectrosc. 61/6, 579–584 (2007).