Rapid Analysis of Inks on Paper by Viewing FT-IR–ATR Spectroscopy
The authors illustrate the value of FT-IR–ATR with sample viewing through the analysis of an ink source on paper.
Attentuated total reflectance (ATR) has become a prominent Fourier-transform infrared (FT-IR) sampling technique due to its ease of use and its accommodation of diverse materials such as liquids, solids, pastes, gels, and powders within a single platform. In some cases, having the ability to obtain a magnified view of the sampling surface enhances user efficiency and data quality because it is possible to find and position the sampling point easily, and to document the sample image. Application examples include fiber analysis, sample contamination evaluation, and small sample analysis. This article illustrates the value of FT-IR–ATR with sample viewing through the analysis of an ink source on paper. Viewing capabilities assured proper sample positioning on the ATR crystal. The infrared chemical signature of three different inks on paper were compared, and the inks were differentiated.
In forensic science, it is often necessary to determine whether or not ink used within a document is the same. Adulteration might be caused by adding extra text, thereby changing the meaning of the wording or altering monetary value.
Primary constituents within ink include a mixture of dyes providing the coloring matter, and resinous material serving to bind the ink to the paper. Ballpoint inks are not based upon an aqueous solvent but on quick-drying pastes or gels; hence, they are only partly absorbed into the paper. Therefore, the quantity of ink deposited on paper is far less than its appearance suggests. Consequently, suitable analytical techniques for investigating inks on paper need to handle very small amounts of ink material in addition to a great deal of paper matrix.
Fourier-transform infrared (FT-IR) spectroscopy is a powerful analytical technique for obtaining a chemical "fingerprint" of samples under investigation. In combination with modern designed attenuated total reflectance accessories, the handling of samples has become very quick and simple yet provides reliable results. In the case of document analysis and many other applications, it is highly desirable to have the evidence or samples preserved by using a nondestructive technique such as FT-IR–attenuated total reflectance (ATR).
In this work, an ATR accessory was used to analyze the infrared spectral characteristics of ballpoint inks on white writing paper. This accessory was chosen due to its magnified sample viewing capabilities.
Experimental Conditions
Writing samples from three ballpoint pens containing black ink from different manufacturers were made on white paper. Spectra were collected using an FT-IR spectrometer equipped with a deuterated triglycine sulfate (DTGS) detector, and a GladiATR Vision sampling accessory with integrated video microscope capabilities (PIKE Technologies, Madison, Wisconsin). This accessory features a monolithic diamond crystal and all reflective optics for a virtually unlimited spectral range. The integrated miniaturized CCD camera, focused through the bottom of the diamond crystal, offers video microscope quality with a magnification of 110× (Figure 1). With the optional video capture card, images can be stored electronically. A single reflection diamond crystal serves as the sampling interface with a dimension of 3 mm × 2 mm.


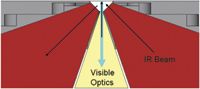
Figure 1: Optical viewing of the instrument's diamond plate; IR beam and visible illumination meet at the sample position.
For carrying out the experimental data collection, the paper sample with or without ink markings was placed face down onto the diamond. The integrated video microscope allowed for verification of the desired sample area. The opted wavenumber region was 4000–400 cm–1 with a spectral resolution of 4 cm–1. Background and data collection times were 1 min. Three replicate measurements were made at different locations within the samples.
Results
A criterion for successful FT-IR–ATR sampling is to apply sufficient pressure to obtain intimate contact between the sample and the ATR crystal. In this study, flattening the rough paper surface of the sampling area was accomplished successfully using the ATR accessory's high-pressure clamp, delivering up to 30,000 psi. Figure 2 shows the spectra of pure paper collected from three locations. Despite the relative size of the sampling area, the spectra are very uniform even though paper is known to be a very heterogeneous material made from pulped fibers, minerals such as kaolin, and various binding agents (1). Specifically, cellulose- and hemicellulose-related absorbance bands are located around 1000 cm–1, and OH vibrations with hydrogen bonding is observed near 3300 cm–1 (2).

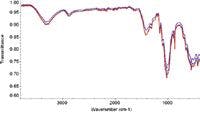
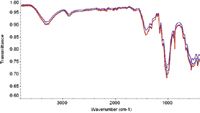
Figure 2: FT-IRâATR spectra of paper.
The ATR accessory is ideal for the analysis of ink markings because the sample area is easily determined through the LCD viewer. Captured images of the sampling area are shown in Figure 3. The ink stroke diameter under evaluation was approximately 460 μm for inks 1 and 2, and 560 μm for ink 3.

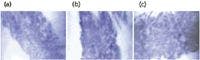
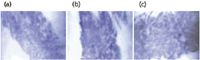
Figure 3: Captured images of ink sample analysis area for (a) ink 1, (b) ink 2, and (c) ink 3.
Considering that the primary spectral contributions from ink occurred at wavenumbers less than 1800 cm–1, the subsequent analysis focuses on this region. Reproducibility between repeat ink measurements was found to be similar to that observed with paper. Therefore, the average of three spectra for each ink sample and for the paper only is reported for visual clarity. No additional spectrum manipulation was performed.
As expected, all spectra from the ink samples show a strong influence from the paper matrix. However, when comparing ink spectra with those from pure paper and against each other, spectral differences for all ink sources are observed. Spectral regions attributed to ink include 1725, 1584, 1366, and 695 cm–1. Kher and colleagues (3) suggest that the band around 1584 cm–1 is carboxylate acid salts and polymeric non-dye constituents such as resin within ink. No two inks evaluated in this work exhibited the same fingerprint, as can be observed from the spectra presented in Figure 4. Visually evident bands are presented here; further differences could be extracted through the application of statistical methods such as discriminate analysis.

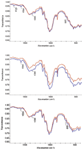

Figure 4: Average spectrum of ink (in blue) and paper (in red) for (a) ink 1, (b) ink 2, and (c) ink 3.
Summary
This study was conducted to illustrate a rapid and convenient technique for the comparison of different inks on paper using FT-IR with an ATR accessory. The method is nondestructive and requires no sample preparation.
Manfred Feustel is with Resultec, Illerkirchberg, Germany. Jenni Briggs is with PIKE Technologies, Madison, Wisconsin.
References
(1) T.J. Wilkinson, D.L. Perry, M.C. Martin, W.R. McKinney, and A.A. Cantu, Appl. Spectrosc. 56, 800 (2002).
(2) S.D. Mansfield, E. de Jong, R.S. Stephens, and J.N. Saddler, J. Biotechnol. 57, 205 (1997).
(3) A. Kher, M. Mulholland, E. Green, and B. Reedy, Vib. Spectrosc. 40, 270 (2006).


Measurement of Ammonia Leakage by TDLAS in Mid-Infrared Combined with an EMD-SG Filter Method
April 9th 2024In this article, tunable diode laser absorption spectroscopy (TDLAS) is used to measure ammonia leakage, where a new denoising method combining empirical mode decomposition with the Savitzky-Golay smoothing algorithm (EMD-SG) is proposed to improve the signal-to-noise ratio (SNR) of absorbance signals.


