Resonance Light Scattering Assessment of the Combined Contamination of DNA with Thifensulfuron-Simazine
A study of the toxic interactions of these pesticides with fish sperm DNA
Using the spectroscopic techniques of resonance light scattering (RLS), absorption spectroscopy, fluorescence spectroscopy, and atomic force microscopy (AFM), we studied the toxic interactions of the combined pesticides pollutants thifensulfuron and simazine with fish sperm deoxyribonucleic acid (fsDNA). The results show that the pesticides individually have relatively weak toxicity to fsDNA compared to the combined thifensulfuron–simazine pollution, which shows obvious toxic interaction with fsDNA. Thifensulfuron and simazine have a strong synergistic effect on interaction with fsDNA with a dose of 3.0 × 10⁻⁴ mol/L thifensulfuron and 8.0 × 10⁻⁶ mol/L simazine in Briton-Robinson (BR) buffer solution (pH 2.09).
During the past decade there was an increased focus on the fact that humans, animals, and plants are concurrently exposed to a number of chemicals via water and the environment. These chemicals may have a combined action that causes a lower or higher toxic effect than would be expected from a single compound (1,2). This has raised concerns regarding their impact on human health and the functioning and health of aquatic and terrestrial ecosystems. Consequently, combined contamination has become a more important direction in environmental science.
Thifensulfuron and simazine have recently been reported as suspected endocrine disrupters (3,4), they are also known to cause multiple types of cancers (3), and have many other effects such as interrupting regular hormone function and causing birth defects, reproductive tumors, and weight loss in mothers and embryos. Despite the fact that these drugs are used at very low levels, they are found in the environment because of their solubility and other chemical and physical properties. Thus, thifensulfuron, simazine, and their metabolites end up in natural waters and soil, which are considered serious problems for environmental safety and human health.
The traditional and most frequently used methods to evaluate the toxicity of combined pollutants are biotoxicity tests, including animal toxicity tests (5–7), microorganism toxicity tests (8,9), and epiphytology investigations. Cell toxicity tests (10,11) are also commonly used. Most of the above methods are time consuming and are limited to the study of the effects of the combined contamination. The mechanism of toxicity is seldom studied.
A molecular toxicity test investigates the toxicity of combined pollutants at the molecular level (12,13). It is a simple and rapid method that can be combined with advanced experimental measurements. It is well known that contamination influences organisms by reacting with functional biological molecules such as deoxyribonucleic acid (DNA) and protein. Thus, there is great importance in directly researching the interaction between contamination and biological molecules and for learning the toxic mechanism. Spectroscopic methods, especially resonance light scattering (RLS), have been widely developed for the sensitive detection of biomolecules (14–16), pollutants (17,18), and research on the interaction of biomolecules with contamination (12,13,19,20). These spectroscopic methods are potentially powerful approaches for investigating the toxic interaction mechanism of the combined contamination with DNA in vitro (13).
In this study, the toxic mechanism of the combined contamination of thifensulfuron and simazine to fish sperm deoxyribonucleic acid (fsDNA) is investigated from the view of molecular toxicology using RLS, absorption spectroscopy, fluorescence spectroscopy, and atomic force microscopy (AFM). This work gives a new approach for investigating the toxic mechanism of combined contamination. It aims to simulate the interaction of pesticide mixtures with organisms and provides a scientific basis for the research on the toxicity mechanism of pesticides in vivo.
Experimental
Reagents
A standard stock solution of DNA was prepared by dissolving commercially purchased fsDNA (Shanghai Institute of Biochemistry, Academy of Science) in ultrapure water. The standard solution concentration was 100 μg/L. The stocks were stored at 0–4 °C with an occasional gentle shake if needed.
A 1.0 × 10⁻³ mol/L stock solution of thifensulfuron (Arcos Organics) was prepared by dissolving 0.1937 g of the product in water in a 500-mL volumetric flask. The standard solution was 1.0 × 10⁻³ mol/L.
A 1.0 × 10⁻³ mol/L stock solution of simazine (Arcos Organics) was prepared by dissolving 0.1010 g of the product in water in a 500-mL volumetric flask. The standard solution was 1.0 × 10⁻⁴ mol/L.
A series of Briton-Robinson (BR) buffer solutions (consisting of 0.04 mol/L H3PO4, 0.04 mol/L H3BO3, 0.04 mol/L CH3OOH, and 0.2 mol/L NaOH) were used for the pH adjustment.
All agents were analytical reagents and were used without further purification. Milli-Q purified water (18.2 MΩ, Millipore) was used for all sample preparations.
Apparatus
The RLS spectra and the fluorescence spectra were measured using an RF-5301PC (Shimadzu) fluorescence spectrometer with a 3.00-cm quartz fluorescence cell.
All absorption spectra were measured by an La-25 spectrophotometer (PerkinElmer). All AFM experiments were conducted using a Multimode NS 3d electron microscope (VEECO Inc.) with a resonance frequency of 233 kHz.
All pH measurements were made with a pHs-3C digital pH meter (Leici).
Experimental Procedure
Appropriate amounts of the thifensulfuron solution, simazine solution, BR buffer solution, and nucleic acid solution were successively added into a 10-mL volumetric flask, mixed, and then diluted to the mark with water.
The RLS spectra were obtained by simultaneously scanning the excitation and emission monochromators from 250 nm to 700 nm with Δλ = 0 nm. Both the excitation and emission slit widths were kept at 3.0 nm. The RLS intensity was measured at 344 nm. The enhanced RLS intensity of the thifensulfuron–simazine–DNA system was represented as ΔI = I – I0 (I and I0 were the RLS intensities of the system with and without nucleic acids).
The absorption spectra were recorded on an La-25 spectrophotometer equipped with 10-mm quartz cells in the range of 200–325 nm.
The fluorescence spectra measurements were made by keeping both the slit widths of excitation and emission at 5.0 nm, excited at 240 nm.
AFM specimens were prepared by dropping 5-μg/mL analyzed solutions onto freshly cleaved mica (already glued on a steel disk if necessary) and incubating them for 5–10 min before testing.
All measurements were conducted at ambient temperature.
Results and Discussion
RLS Spectral Characteristics
To investigate the toxicity of the combined pollutants thifensulfuron–simazine by RLS, the RLS spectra of thifensulfuron, simazine, fsDNA, and their mixtures were obtained (shown in Figure 1). The intensities of RLS for thifensulfuron, simazine, fsDNA, and thifensulfuron–simazine mixture were weak. There are some increases in two-component mixtures of thifensulfuron–fsDNA and simazine–fsDNA, which means that they form aggregates in the solution that result in the enhanced RLS intensity (21,22). More visibly, highly enhanced RLS spectra are obtained for the solution in which all the three components were dissolved, suggesting the formation of a ternary complex of thifensulfuron–simazine–fsDNA and their aggregates. A maximum intensity of RLS is found at 344 nm as well as two weaker peaks at 450 nm and 600 nm.

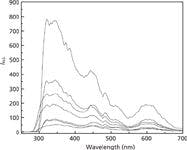

Figure 1: Resonance light scattering spectra of the thifensulfuronâsimazineâfsDNA system. Conditions: thifensulfuron concentration: 3.0 Ã 10-4 mol/L ; simazine concentration: 8.0 Ã 10-6 mol/L; pH: 2.09; fsDNA concentration: 3.0 mg/L. Spectra, from bottom to top: thifensulfuron, simazine, thifensulfuronâsimazine, fsDNA, thifensulfuronâfsDNA, simazineâfsDNA, thifensulfuronâsimazineâfsDNA.
The results suggest that the two pesticides thifensulfuron and simazine have relatively weak toxicity to fsDNA compared to the thifensulfuron-simazine pollution, which showed obvious toxic interaction with fsDNA. The phenomenon also means thifensulfuron and simazine have a synergistic effect on interaction with fsDNA, resulting in the highly enhanced RLS intensity of ternary complex compared to binary mixtures. The extent of enhancement of the RLS spectrum (ΔI) of the thifensulfuron–simazine system reflects the toxic interaction intensity of the system to fsDNA (23).
The Absorption Spectra
UV–vis spectrophotometry was applied to investigate the toxic interaction of thifensulfuron–simazine with fsDNA. Figure 2 shows the UV–vis absorption spectra of thifensulfuron, simazine, fsDNA, and their mixtures. When fsDNA was added to the thifensulfuron solution and simazine solution, separately, a hypochromic effect and red shift in the thifensulfuron solution and a hyperchromic effect and blue shift in the simazine solution were observed, respectively. The UV–vis absorption intensity of the ternary complex thifensulfuron–simazine–fsDNA is much stronger than that of binary mixtures. Also, there is more blue shift compared to thifensulfuron–fsDNA complex.

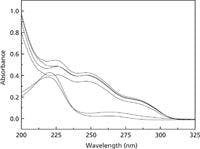

Figure 2: Absorption spectra of the thifensulfuronâsimazineâfsDNA system. Conditions: thifensulfuron concentration: 3.0 Ã 10-5 mol/L; simazine concentration: 8.0 Ã 10-6 mol/L; pH: 2.09; fsDNA concentration: 3.0 mg/L. Spectra, from bottom to top: simazine, simazineâfsDNA, thifensulfuronâfsDNA, thifensulfuron, thifensulfuronâsimazine,thifensulfuronâsimazineâfsDNA.
The changes in absorption spectra indicate that strong bonding interaction formed among thifensulfuron, simazine, and fsDNA, leading the aggregation among them. The hyperchromic effect and red–blue shift demonstrate that there are electrostatic binding and hydrophobic forces in the reaction of fsDNA with thifensulfuron and simazine during the formation of a ternary complex (24). Moreover, the results also suggest that thifensulfuron and simazine have a synergistic effect on the interaction with fsDNA, which is consistent with the consequences of RLS spectra.
Features of the Fluorescence Spectra
Figure 3 displays the fluorescence spectra of thifensulfuron, simazine, fsDNA, and their mixtures. When the excitation wavelength was 240.0 nm, the emission wavelength was 375.0 nm. The fluorescence intensity of the binary mixtures of thifensulfuron–fsDNA and simazine–fsDNA is stronger than that of pure thifensulfuron and simazine. The ternary complex of thifensulfuron–simazine–fsDNA is much stronger, which indicates that the synergistic effect occurred between thifensulfuron and simazine.

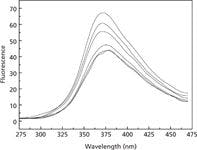

Figure 3: Fluorescence spectra of the thifensulfuronâsimazineâfsDNA system. Conditions: thifensulfuron concentration: 3 Ã 10-4 mol/L; simazine concentration: 8 Ã 10-6 mol/L; pH: 2.09; fsDNA concentration: 3 mg/L. Spectra, from bottom to top: thifensulfuron, simazine, thifensulfuronâsimazine, thifensulfuronâfsDNA, simazineâfsDNA, thifensulfuronâsimazineâfsDNA.
From the enhanced fluorescence intensity, we can infer that the interaction between fsDNA and thifensulfuron-simazine mainly involves groove binding, intercalative binding, or both of those bindings, not electrostatic interaction because it would be hard to observe the increase (25–27). Combined with the RLS and the UV spectra, we can deduce that groove binding is the main force together with weak electrostatic binding and hydrophobic force because the intercalative binding hardly leads the increase in RLS intensity (21,28).
AFM Measurements
AFM can be used to obtain high-resolution images of nucleic acids and nucleic acid–protein complexes, observe the physiological process, and analyze the sequences (29–33). In this study, we conducted the AFM measurements of the systems to understand the factors that result in the amplified RLS signals of fsDNA by addition of thifensulfuron–simazine and the toxic mechanism of combined contamination of thifensulfuron–simazine. AFM images are shown in Figure 4. Particles of thifensulfuron, thifensulfuron–fsDNA, simazine, simazine–fsDNA, thifensulfuron–simazine, and thifensulfuron–simazine–fsDNA have nanospheric shapes or nanorod-like shapes with diameters of 4.270 nm, 5.280 nm, 4.703 nm, 15.714 nm, 9.970 nm, and 241.68 nm, respectively. We can see that the particles of the ternary complex are much larger than that of the binary complex, which are larger than single compounds; the size differences are consistent with the RLS spectra. In Figure 4a, thifensulfuron is widely dispersed. When fsDNA was added into the thifensulfuron solution, particles of thifensulfuron–fsDNA became larger (as shown in Figure 4b). The same phenomenon happened in the simazine–fsDNA system (as shown in Figures 4c and 4d). But the increased degree is limited, which means the toxicity of single thifensulfuron or simazine is very weak. The addition of simazine into thifensulfuron induced larger particles compared to single thifensulfuron or simazine (shown in Figure 4e), which indicates that thifensulfuron and simazine can form complex. When fsDNA was added into thifensulfuron–simazine system, rods like aggregates were formed. This is direct evidence that fsDNA interacts with the thifensulfuron–simazine combined system to form an aggregate complex. We can infer that thifensulfuron and simazine have weak toxicity to fsDNA, but the toxicity of their complex to fsDNA is much stronger, which further demonstrates that thifensulfuron and simazine together have synergistic effects when reacting with fsDNA.

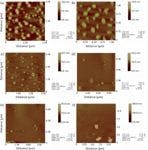
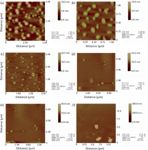
Figure 4: AFM imaging of the thifensulfuronâsimazineâfsDNA system. Conditions: thifensulfuron concentration: 3.0 Ã 10-4 mol/L; simazine concentration: 8.0 Ã 10-6 mol/L; pH: 2.09; fsDNA concentration: 3.0 mg/L. (a) thifensulfuron, (b) simazine, (c) thifensulfuronâsimazine, (d) thifensulfuronâfsDNA, (e) simazineâfsDNA, (f) thifensulfuronâsimazineâfsDNA.
Effect of pH and Buffers
The buffer type and buffer pH have obvious effects on the toxicity of pollutants. We investigated the effect of pH on the toxicity of the thifensulfuron–simazine combined contamination to fsDNA. The effect of pH on the RLS intensity of the system was investigated over the pH range 1.72–9.33. As shown in Figure 5, the RLS intensity is greatly affected by pH, which in turn means that pH has an obvious effect on the toxicity. When pH is at 2.09, the maximum increase of RLS intensity was obtained. So, the pH value of the interacting medium was controlled at 2.09. Moreover, the effect of the buffer medium was also examined. Among the buffers of Britton-Robinson, Tris-HCl, HMAT-HCl, and Na2HPO4–citric acid, ΔI (%) values were 100.0, 85.3, 55.0, and 79.2, respectively. Therefore, a 1.0-mL Britton-Robinson buffer solution of pH 2.09 was used in this research.


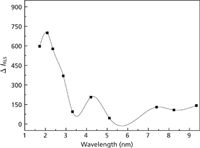
Figure 5: Effect of pH on the RLS intensity. Conditions: thifensulfuron concentration: 3.0 Ã 10-4 mol/L; simazine concentration: 8.0 Ã 10-6 mol/L; fsDNA concentration: 3 mg/L.
Effect of Thifensulfuron Concentration
Figure 6 depicts the influence of the thifensulfuron concentration on the toxicity of combined contamination. From Figure 6, we can see that the concentration of thifensulfuron has an obvious effect on RLS intensity of the thifensulfuron–simazine–fsDNA system. It is found that when the concentration is 3.0 × 10⁻⁴ mol/L, the ΔI of the system reaches a maximum, which indicates that a thifensulfuron concentration of 3.0 × 10⁻⁴ mol/L yields the strongest toxicity. Therefore, 3.0 × 10⁻⁴ mol/L was selected for further research.


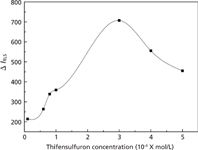
Figure 6: Effect of thifensulfuron concentration on the RLS intensity. Conditions: simazine concentration: 8.0 Ã 10-6 mol/L; fsDNA concentration: 3.0 mg/L; pH: 2.09.
Effect of Simazine Concentration
When the concentration of simazine was 8.0 × 10⁻⁶ mol/L, the toxicity reached the maximum (displayed in Figure 7). Therefore, a 8.0 × 10⁻⁶ mol/L simazine concentration was used to investigate the interaction of fsDNA, thifensulfuron, and simazine.

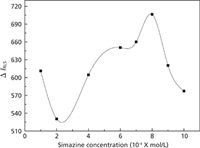
Figure 7: Effect of simazine concentration on the RLS intensity. Conditions: thifensulfuron concentration: 3.0 Ã 10-4 mol/L; fsDNA concentration: 3.0 mg/L; pH: 2.09.
Effect of Ionic Strength
Ionic strength has an obvious effect on the thifensulfuron–simazine–fsDNA system (shown in Figure 8). The results indicate that there is electrostatic binding between thifensulfuron–simazine and fsDNA.

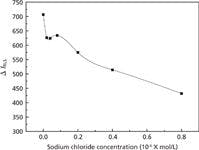

Figure 8: Effect of ion strength on the RLS intensity. Conditions: thifensulfuron concentration: 3.0 Ã 10-4 mol/L; simazine concentration: 8.0 Ã 10-6 mol/L; pH: 2.09; fsDNA concentration: 3.0 mg/L.
Reaction Time and Stability
The RLS intensity was measured immediately after mixing the three compounds. The results show that the reaction of fsDNA, thifensulfuron, and simazine occurs rapidly at room temperature. Thus, this method does not require crucial timing. Moreover, the RLS intensities remain stable for at least 3 h, which shows that thifensulfuron–simazine can tightly combine with fsDNA, resulting in strong toxicity.
Conclusion
This paper investigated the toxic property of the combined pesticide pollutants of thifensulfuron and simazine to fsDNA. The two pesticides have relatively weak individual toxicity to fsDNA compared to the combined thifensulfuron–simazine pollution, which showed obvious toxic interaction with fsDNA. Thifensulfuron and simazine have a strong synergistic effect on the interaction with fsDNA by groove binding, electrostatic binding, and hydrophobic forces, with concentrations of 3.0 × 10⁻⁴ mol/L thifensulfuron and 8.0 × 10⁻⁶ mol/L simazine. The RLS technique is shown to be an effective new method to evaluate the toxicity of the combined contamination of thifensulfuron–simazine to fsDNA. This work gives a new insight into the study of the toxic mechanism of combined contamination and provides a scientific basis for the research on the toxicity mechanism of pesticides in vivo.
Acknowledgments
This work was supported by the Natural Science Foundation of Hunan Province (11JJ6010), the Hunan Provincial Education Department (10A115, 11C1203), and Xiangtan University (2011XZX07). All authors express their sincere thanks.
References
(1) J. Lahr, B. Münier, H.J. De Lange, J.F. Faber, and P.B. Sørensen, Sci. Total Environ. 408, 3891–3898 (2010).
(2) T.K. Reffstrup, J.C. Larsen, and O. Meyer, Regul. Toxicol. Pharmacol. 56, 174–192 (2010).
(3) M.T. Strandberg and J.J.S. Fordsmand, Sci. Total Environ. 296, 117–137 (2002).
(4) Q.X. Zhou, J.P. Xiao, W.D. Wang, G.G. Liu, Q.Z. Shi, and J.H. Wang, Talanta 68, 1309–1315 (2006).
(5) J.V. Brian, C.A. Arris, M. Scholze, T. Backhaus, P. Booy, M. Lamoree, G. Pojana, N. Jonkers, T. Runnalls, A. Bonfa, A. Marcomini, and J.P. Sumpter, Environ. Health Perspect. 113, 721–728 (2005).
(6) M. Lodovici, C. Casalini, C. Briani, and P. Dolara, Toxicology 117, 55–60 (1997).
(7) J. Wang, Q.X. Zhou, Q.R. Zhang, and Y. Zhang, J. Environ. Sci. 20, 68–74 (2008).
(8) S. Deng, R. Bai, X. Hu, and Q. Luo, Appl. Microbiol. Biotech. 60, 588–593 (2003).
(9) Y.H. Zhang, S.S. Liu, X.Q. Song, and H.L. Ge, Ecotoxicol. Environ. Saf. 71, 880-888 (2008).
(10) D.F. Bradford, E.M. Heithmar, N.G.T. Halsell, G.M. Momplaisir, C.G. Rosal, K.E. Varner, M.S. Nash, and L.A. Riddick, Environ. Sci. Technol. 44, 4609–4614 (2010).
(11) F. Orton, I.Lutz, W. Kloas, and E.J. Routledge, Environ. Sci. Technol. 43, 2144-2150 (2009).
(12) R.T. Liu, W.S. Zong, K.K. Jin, X.T. Lu, J.H. Zhu, L. Zhang, and C.Z. Gao, Spectrochim. Acta, Part A 70, 198–200 (2008).
(13) Z.X. Chi, R.T. Liua, X.R. Pan, Y. Teng, H. Qin, J.H. Zhu, and X.P. Hao, Spectrochim. Acta, Part A 75, 177–182 (2010).
(14) G.W. Song, Z.X. Cai, and L. Li, Microchim. Acta. 144, 23–27 (2004).
(15) Z.G. Chen, T.Y. Zhang, F.L. Ren, and W.F. Ding, Microchim Acta. 153, 65–71 (2006).
(16) C.Q. Cai, H. Gong, and X.M. Chen, Microchim Acta. 157, 165–171 (2007).
(17) L.P. Wu, Y.F. Li, C.Z. Huang, and Q. Zhang, Anal. Chem. 78, 5570–5577 (2006).
(18) L.H. Yu, Z.F. Liu, X.L. Hu, L. Kong, and S.P. Liu, Microchim Acta. 168, 331–340 (2010).
(19) S.P. Liu, H.Q. Luo, N.B. Li, Z.F. Liu, and W.X. Zheng, Anal Chem. 73, 3907–3914 (2001).
(20) H. Chen, Q.C. Zou, H. Yu, M. Peng, G.W. Song, J.Z. Zhang, S.G. Chai, Y.H. Zhang, and C.E. Yan, Microchimica Acta. 168, 331–340 (2010).
(21) C.Z. Huang, Y.F. Li, and X.D. Liu, Anal. Chim Acta. 375, 89–97 (1998).
(22) R.T. Liu, J.H. Yang, C.X. Sun, L. Li, X. Wu, Z.M. Li, and C.S. Qi, Chem. Phys. Lett. 376, 108–115 (2003).
(23) R.T. Liu, J.H. Yang, X. Wu, S. Hua, and C.X. Sun, Acta A. 57, 2561–2566 (2001).
(24) R.T. Liu, J.H. Yang, X. Wu, and T. Wu, Anal. Chim. Acta. 448, 85–91(2001).
(25) R.F. Pasternack, C. Bustamante, P.J. Collings, A. Giannetteo, and E.J. Gibbs, J. Am. Chem. Soc. 115, 5393–5399 (1993).
(26) R.F. Pasternack and P.J. Collings, Science 269, 935–939 (1995).
(27) G.A. Miller, J. Chem. Phys. 82, 616–618 (1978).
(28) S.P. Liu, H.Q. Luo, N.B. Li, Z.F. Liu, and W.X. Zheng, Anal. Chem. 73, 3907–3914 (2001).
(29) H.G. Hansma, K.J. Kim, D.E. Laney, R.A. Garcý'a, M. Argaman, M.J. Allen, and S.M. Parsons, J. Struct. Biol. 119, 99–108 (1997).
(30) H.G. Hansma, I. Revenko, K. Kim, and D.E Laney, Nucleic Acids Res. 24, 713–720 (1996).
(31) A.G. Wu, Z. Li, L.H. Yu, H.D. Wang, and E.K. Wang, Anal. Sci. 17, 583–584 (2001).
(32) W.J. Tiner, V.N. Potaman, R.R. Sinden, and Y.L. Lyubchenko, J. Mol. Biol. 314, 353–357 (2001).
(33) O.I. Kiselyova, I.V. Yaminsky, E.M. Karger, O.Y. Frolova, and Y.L. Dorokhov, J. Gen. Virol. 821, 503–1508 (2001).
Lin Luo, Changqun Cai, Ying Ma, Chao Weng, and Xiaoming Chen are with the Key Laboratory of Environmentally Friendly Chemistry and Applications at the Ministry of Education in the College of Chemistry, at Xiangtan University in Xiangtan, Hunan, China. Direct correspondence to: cai_mao3@hotmail.com.


Getting accurate IR spectra on monolayer of molecules
April 18th 2024Creating uniform and repeatable monolayers is incredibly important for both scientific pursuits as well as the manufacturing of products in semiconductor, biotechnology, and. other industries. However, measuring monolayers and functionalized surfaces directly is. difficult, and many rely on a variety of characterization techniques that when used together can provide some degree of confidence. By combining non-contact atomic force microscopy (AFM) and IR spectroscopy, IR PiFM provides sensitive and accurate analysis of sub-monolayer of molecules without the concern of tip-sample cross contamination. Dr. Sung Park, Molecular Vista, joined Spectroscopy to provide insights on how IR PiFM can acquire IR signature of monolayer films due to its unique implementation.


