A Sensitive and Cost-Effective LC–MS-MS Method for Determination of 1α,25-Dihydroxyvitamin D3 in Human Plasma
Special Issues
The biologically active form of vitamin D is an important analytical target in both research and clinical practice.
The biologically active form of vitamin D is an important analytical target in both research and clinical practice. However, quantification of 1α,25-dihydroxyvitamin D3 (1,25(OH)2D3) has been challenging because of the extremely low levels in circulation - in the low picograms-per-milliliter range. Here, we report a sensitive, time-efficient, and cost-effective liquid chromatography–tandem mass spectrometry (LC–MS-MS) method that combines the use of immunoaffinity extraction, 4-phenyl-1,2,4-triazole-3,5-dione (PTAD) derivatization, and methylamine adduction.
Vitamin D3 plays an important role in the maintenance of bone health by promoting the absorption and metabolism of calcium and phosphate (1,2). Vitamin D3 is either produced in skin (under the influence of UV light) or absorbed from dietary or supplement intake (3,4). The primary circulating metabolite, 25-hydroxyvitamin D3 (25(OH)D3), is formed following a first hydroxylation step in liver microsomes. The active form, 1α,25-dihydroxyvitamin D3 (1,25(OH)2D3), is formed in a second hydroxylation step, which occurs primarily in the kidney (Figure 1). Through upregulation of a wide variety of genes, 1,25(OH)2D3 is responsible for most of the biological action of vitamin D3. Areas of influence of the active metabolite include immune function, cell proliferation, differentiation, and apoptosis (5).

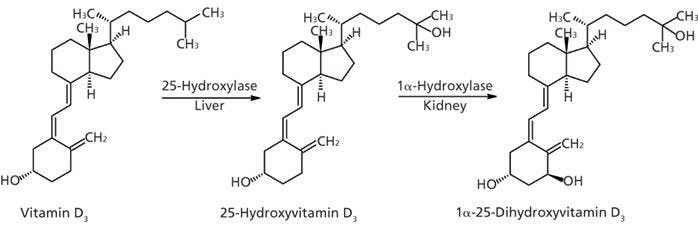

Figure 1: Metabolic pathway of 1α,25-dihydroxyvitamin D3.
Circulating concentrations of 1,25(OH)2D3 are very low (low picograms per milliliter) (6) in normal human plasma. These extremely low concentrations and the potential interference from other vitamin D3 metabolites have made the accurate quantification of 1,25(OH)2D3 a challenge. Previous progress to increase the sensitivity of liquid chromatography–tandem mass spectrometry (LC–MS-MS) assays has been made by either using a more sensitive derivatization reagent (7) or by using the microflow LC–MS-MS (8) concept to improve the instrument sensitivity. But there are drawbacks associated with those methods, including cost, availability, the stability of the agents used, and the complexity of the system involved. Herein, we report a sensitive and selective LC–MS-MS method using immunoaffinity extraction (IAE), 4-phenyl-1,2,4-triazole-3,5-dione (PTAD) derivatization, and methylamine (CH3NH2) adduction for the LC–MS-MS analysis. Our method is easier to use than current methods and offers significant advantages in cost effectiveness. The recovery and selectivity of the IAE are high for 1,25(OH)2D3 and PTAD is a stable and commercially available reagent.
Experimental
The finalized experimental conditions for IAE, PTAD derivatization, and methylamine adduction in the LC–MS-MS analysis of 1,25(OH)2D3 are described below.
Immunoaffinity Extraction
Samples were extracted using ImmunoTube extraction kits (Immundiagnostik AG, distributed by ALPCO). Internal standards (IS) consisted of 20 μL of a 10-ng/mL solution of 26,26,26,27,27,27-hexadeuterium-1α,25-dihydroxyvitamin D3 (d6-1,25(OH)2D3) (Chemaphor) dissolved in acetonitrile and were spiked to 0.5 mL of human plasma sample. The sample was vortexed and centrifuged before being transferred into the ImmunoTubes. The ImmunoTubes were incubated on a rotator at room temperature for 1 h, then washed with 3 × 500 μL of WASHSOL (the wash solution provided by the manufacturer in the extraction kit), and finally eluted with 250 μL of ELUREAG (the elution reagent provided by the manufacturer in the extraction kit). The eluent was dried completely on a Speed Vac concentrator (Savant SPD121P-115, Thermo Electron Corporation), and then 50 μL of PTAD (0.2 mg/mL in acetonitrile) was added. The reaction was then held at room temperature for 2 h and finally terminated with 50 μL of water. Then the samples were transferred to high performance liquid chromatography (HPLC) vials containing inserts, and 10 μL was injected into the LC–MS-MS system. Next, 1,25(OH)2D3 calibration standards were prepared by spiking 50 μL of 1,25(OH)2D3 standard (Cerilliant) at different concentrations in acetonitrile into a 500-μL aliquot of vitamin D– depleted blank human serum (Golden West Biologicals Inc., VD-DDC Mass Spect Gold MSG 1000) at concentrations of 5.0, 10.0, 25.0, 50.0, 100.0, 250.0, 500.0, and 1000.0 pg/mL. The remaining procedures were carried out identically to those performed for the plasma samples.
LC–MS-MS Conditions
The LC–MS-MS system consisted of an Agilent 1100 system coupled to a tandem quadrupole 4000 Qtrap MS system (AB Sciex). Chromatographic separations were performed on a 50 mm × 2.1 mm, 2.7-μm Waters Cortecs C18+ column (90 Å), with the column temperature held at 60 °C. Mobile-phase A was 0.1% formic acid and 1 mM methylamine in water, and mobile-phase B was 0.1% formic acid in methanol.
The gradient was as follows: 0–0.1 min, 50% B; 2 min, 90% B: 2.5–4.0 min, 100% B; 4.1–8.0 min, 50% B. The MS system was operated in positive electrospray ionization mode with an ion spray voltage of 5500 V. Nitrogen was used as the collision gas. The optimized source conditions were as follows (arbitrary units if not specified): gas 1: 50; gas 2: 40; curtain gas (CUR): 30; collision gas (CAD): 10; and temperature (TEM): 400. The optimized compound conditions were declustering potential (DP): 50; collision energy (CE): 32; entrance potential (EP): 10; collision cell exit potential (CXP): 8; and dwell time: 100 ms for all analytes. The multiple reaction monitoring (MRM) transitions used were m/z 623.4→314.1 for 1,25(OH)2D3 and m/z 629.4→314.1 for d6-1,25(OH)2D3. Data were processed with Analyst software version 1.5.1 (AB Sciex).

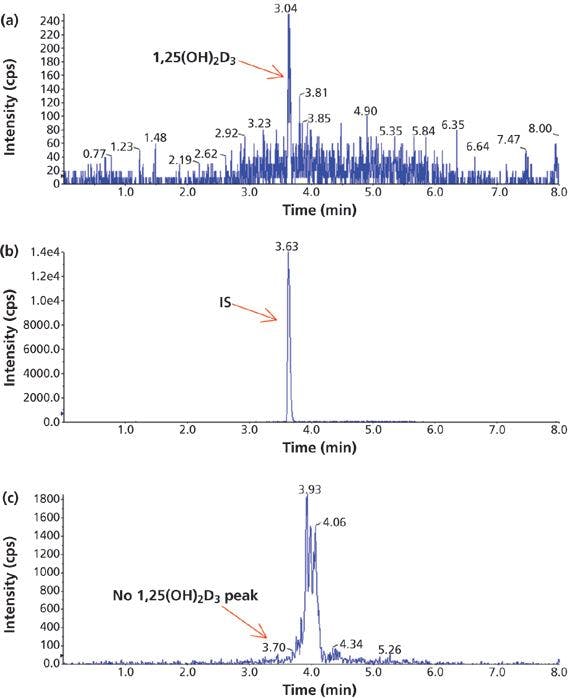

Figure 2: A comparison of the chromatograms of a sample containing 5 pg/mL of 1,25(OH)2D3 extracted by different methods: (a) IAE, (b) IAE, and (c) SPE.
Results and Discussion
Selection of Sample Cleanup Method
Before using IAE to separate 1,25(OH)2D3 from its matrix interferences, several different solid-phase extraction (SPE) cartridges were evaluated. IAE was clearly superior in sample cleanup and sensitivity (Figure 2). The 1,25(OH)2D3 peak was detected in the sample (containing 5 pg/mL of 1,25(OH)2D3) treated with IAE (Figure 2a), but not in the sample treated with SPE (Figure 2c). Figure 2b is the peak of IS for the retention time identification purpose for the main peak of 1,25(OH)2D3. No other interference peaks were observed near the main peak from a plasma sample treated with IAE (Figure 3c). Unlike SPE, which separates analytes based on their polarity, the immunoaffinity assay targets dihydroxyvitamin D metabolites only, resulting in higher selectivity. A cleaner sample made the subsequent LC–MS-MS analysis easier since an extensive separation on an LC column is not necessary. The run time was shortened by 50%, resulting in greater throughput efficiency and less cost to the investigator. The IAE procedures provided by the manufacturer were straightforward and easy to use with minimum preparation. IAE is a key step to improve the assay sensitivity, making it possible to measure 1,25(OH)2D3 in human plasma on the mass spectrometer. These results were not achieved with any of the tested SPE cartridges used previously as sample cleanup methods.


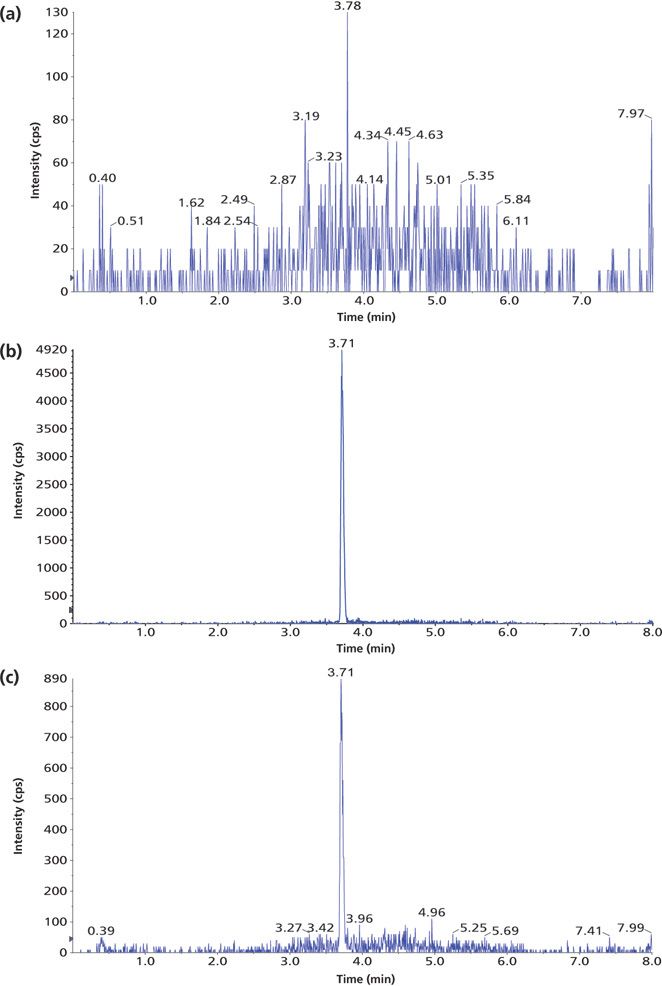
Figure 3: Example chromatograms of 1,25(OH)2D3 in human plasma treated with IAE: (a) blank human plasma, (b) a standard, and (c) a patient sample.
Selection of the Derivatization Reagent and Use of Mobile-Phase Additive
Besides the improvement in the sample cleanup method, using a sensitive derivatizing reagent is another key to improve the sensitivity. At the beginning, the Amplifex Diene (AD, AB Sciex) derivatizing reagent was used for the assay since it was able to provide a 10-fold higher signal-to-noise ratio compared to PTAD (7) (Figure 4). However, because of the cost, the current availability of the AD derivatizing reagent, and its low stability following exposure to ambient air, the choice of derivatizing reagent went back to PTAD since our intention was to develop a method with great practicality and relative low cost while still meeting the assay detection limit requirement. To achieve this goal, methylamine was used as a mobile-phase additive to enhance assay sensitivity after the PTAD derivatization. When methylamine was added to the mobile phase, the derivative provided methylammonium adduct ions ([M+ CH3NH2]+, m/z 623.4) as the base peak ion (9). The intensities of the protonated molecules, other adduct ions, and the dehydrated ion significantly decreased. In summary, the combination of PTAD derivatization and the addition of methylamine to the mobile phase provided sensitive and reliable measurement of 1,25(OH)2D3 on the mass spectrometer with a lower limit of quantification (LLOQ) of 5 pg/mL in human plasma.


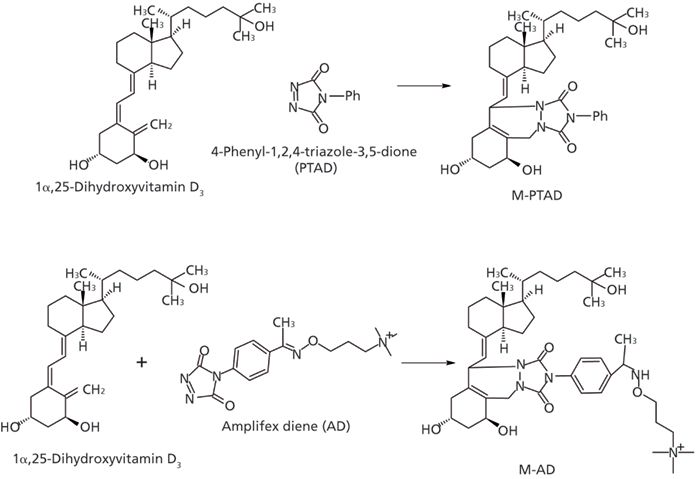
Figure 4: Derivatization of 1α,25-dihydroxyvitamin D3 with AD and PTAD.
Optimization of the Conditions for PTAD Derivatization and LC–MS-MS Analysis Using Methylamine as an Additive
To obtain the maximum sensitivity, the amount of PTAD added for the derivatization, the concentration of methylamine in the mobile phase, the type of organic solvent in mobile-phase B, and the gradient were optimized to yield the highest signal-to-noise ratios and the lowest detection limit with repeatable results in a relatively short run time. For PTAD optimization, 50 μL of PTAD at different concentrations (0.05, 0.1, 0.2, 0.3, 0.4, 0.6, 0.8, 1.0, and 1.2 mg/mL in acetonitrile) was added to identical samples spiked with 500 pg/mL of 1,25(OH)2D3 and the IS. The samples were derivatized and analyzed according to the conditions described in the experimental section. The results are shown in Figure 5. Our data show that 0.1–0.2 mg/mL PTAD gave the highest peak area for both analyte and IS, and 50 μL of a 0.2-mg/mL solution of PTAD was chosen for the IAE sample to ensure that a sufficient derivatizing reagent was available in all reactions.

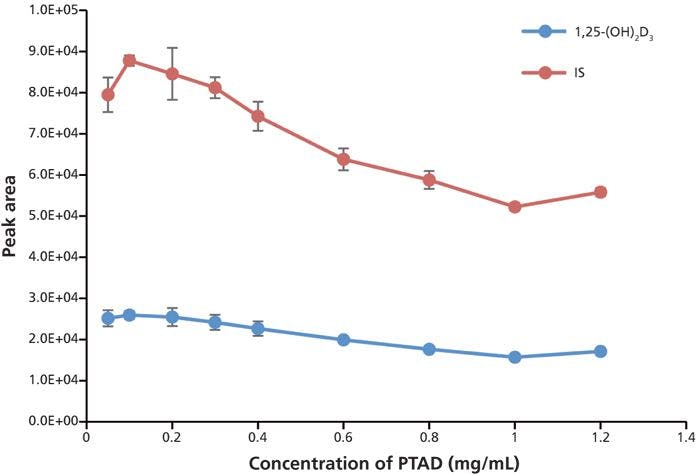
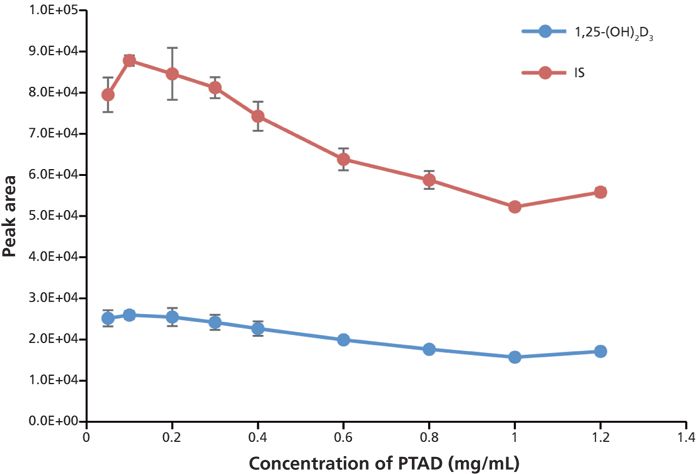
Figure 5: Optimization of PTAD concentration in derivatization. Error bars represent standard deviations of three replicates.
To optimize the methylamine concentration in the mobile phase, aliquots of the same sample were injected and analyzed on the LC–MS-MS system with different concentrations of methylamine in mobile-phase A. The optimal value is 1 mM methylamine in mobile-phase A because it gave the highest peak area for both analyte and IS (Figure 6).

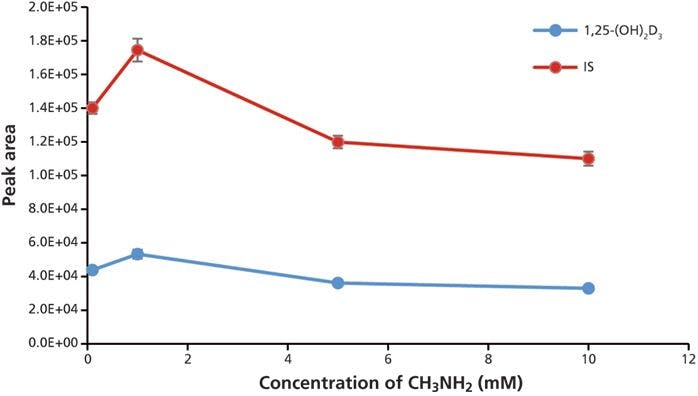
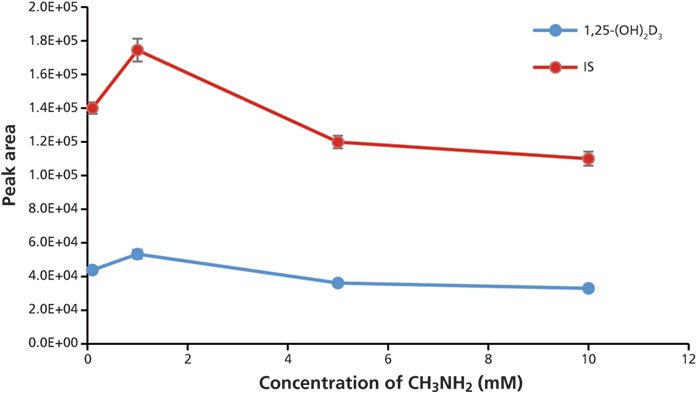
Figure 6: Optimization of methylamine concentration in the mobile phase. Error bars represent standard deviations of three replicates.
Several different columns, organic components in mobile-phase B, and gradients were also evaluated to maximize the sensitivity. It was found that the column mentioned in the experimental section gave the best performance overall in terms of peak shape, separation, and column pressure. The detection sensitivity was shown to be higher when methanol instead of acetonitrile was used in mobile-phase B. Since IAE yielded a cleaner sample than other sample cleanup methods, and since PTAD is less hydrophilic than AD, 50% methanol was used as the initial gradient condition, resulting in a faster gradient that reduced the run time from 16 min (using AD as the derivatizing reagent) to 8 min (using PTAD as the derivatizing reagent) (see Figure 7). The 8-min run time is also significantly shorter than other methods reported for LC–MS-MS analysis of 1,25(OH)2D3 (7,8,10).

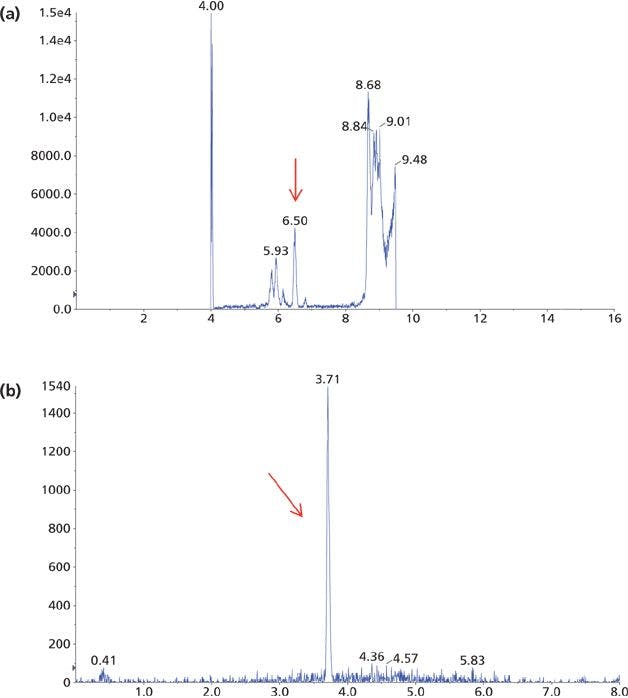
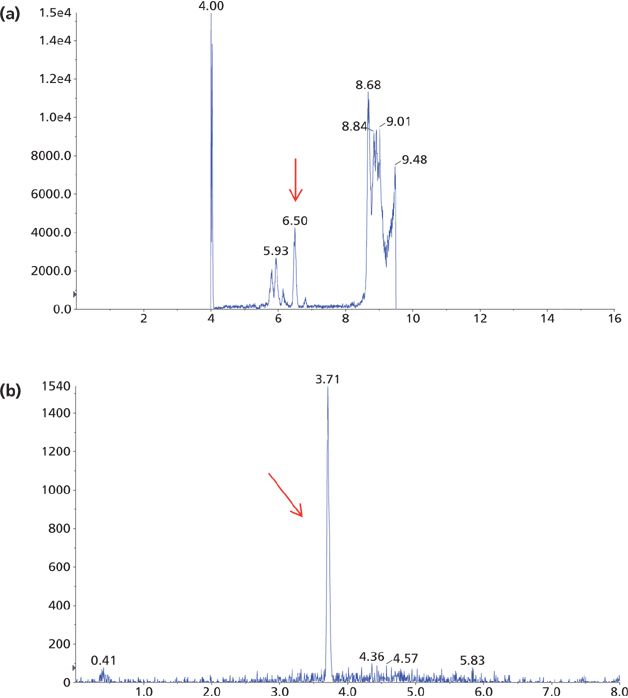
Figure 7: Mass chromatograms of the LC–MS-MS analysis of a patient sample derivatized with (a) AD and (b) PTAD. The arrows indicate the 1,25(OH)2D3 peak.
A Comparison of the 1,25(OH)2D3 Results Obtained Using Different Derivatization Reagents
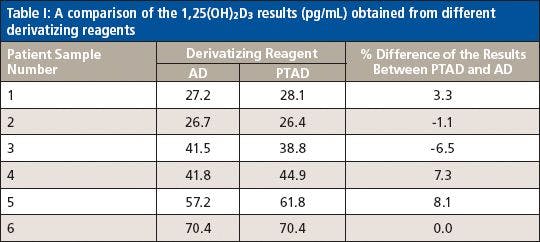
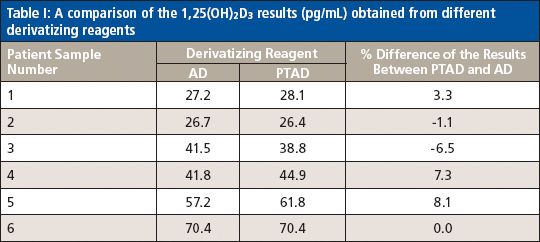
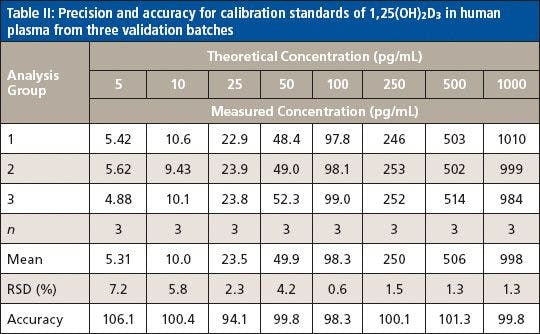
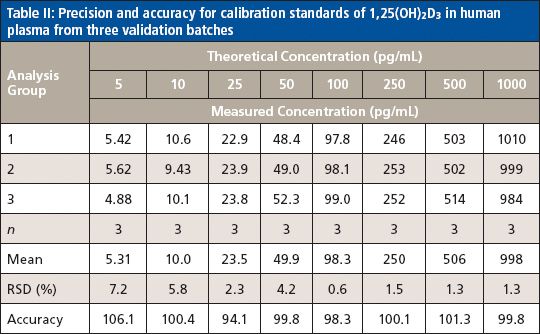
To make sure that the new method (using PTAD derivatization and 1 mM methylamine in mobile-phase A) with a shorter run time (8 min) was able to replace the initial method (using AD derivatization) developed for 1,25(OH)2D3 analysis, six patient samples at low, middle, and high levels of 1,25(OH)2D3 were analyzed in both ways to compare the results side by side. By doing so, after the IAE sample cleanup, one set of the six patient samples went through the derivatization with PTAD and was analyzed by LC–MS-MS using the conditions described in the experimental section above. Another set of the samples went through the derivatization with AD and were analyzed on the same LC–MS-MS system using the optimized conditions, which was different from the one used for the PTAD method. Since the "best" chromatographic conditions (mainly the column and the mobile phases) developed for the PTAD method are not the best for the AD-derivatized samples, the optimized chromatographic conditions for the AD method are listed below. The column used was a 100 mm × 2.1 mm, 2.6-μm Phenomenex Kinetex C18 column (100 Å), mobile-phase A was 0.1% formic acid in water, and mobile-phase B was 0.1% formic acid in acetonitrile. The gradient was as follows: 0 min, 5% B; 0.85 min, 35% B; 6.0 min, 45% B; 6.5–10 min, 95% B, 10.1–16.0 min, 5% B. The optimized source conditions were as follows: gas 1: 40; gas 2: 60; CUR: 30; CAD: 11; and TEM: 450. The optimized compound conditions were as follows: DP: 70; CE: 40; EP: 13; and CXP: 11 for MRM transition 748.6→689.5 (1,25(OH)2D3). For MRM transition 754.6→689.5 (d6-1,25(OH)2D3), the conditions were DP: 65; CE: 50; EP: 11; and CXP: 9. Each patient sample was analyzed in triplicate, with the average reported in Table I. The results in Table I indicate that the percent difference of the results from the two methods is <9%, which is below the acceptance limit (±15%) generally set for LC–MS-MS analysis. The accuracy of the new method (using PTAD and methylamine) is very comparable to that of the initial method developed for 1,25(OH)2D3 in which the more sensitive derivatizing reagent AD was used. Both methods have the same LLOQ, which is 5 pg/mL for 1,25(OH)2D3. The calibration curve was linear over the range of 5.0–1000 pg/mL (Table II). Therefore, it is possible to use the existing low-cost reagent PTAD to replace the more expensive AD for the measurement of 1,25(OH)2D3 in human plasma as long as methylamine is added in the mobile phase.

Method Validation
The last step in the method development was method validation to test for robustness and reproducibility. The method was validated for linearity, sensitivity, accuracy, precision, selectivity, recovery, and matrix effect. Excellent linearity was obtained for the eight-point calibration curve constructed by plotting the peak area ratio of 1,25(OH)2D3 to its internal standard (d6-1,25(OH)2D3) versus the corresponding concentration ratio and fitting the data using linear least-squares regression with a 1/x weighting factor. For three consecutive batches, the calibration curves showed an overall accuracy of 94.1–106.1% with RSD ≤7.2% over the concentration range of 5.0–1000.0 pg/mL (Table II). The correlation coefficient (r2) of the linear regression was ≥ 0.9998. The LLOQ was taken as the lowest calibration concentration that passed acceptance criteria with a signal-to-noise ratio of at least 5:1. The LLOQ was found to be 5.0 pg/mL. The LLOQ obtained on the mass spectrometer is low enough to accomplish the 1,25(OH)2D3 measurement in human plasma since the level of 1,25(OH)2D3 in most human plasma samples is 15–60 pg/mL (10). In addition, our technique differs from the prior method (7) because it is faster and more cost effective.

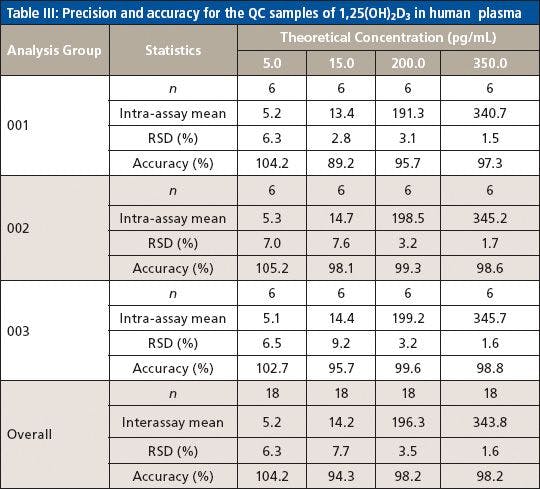
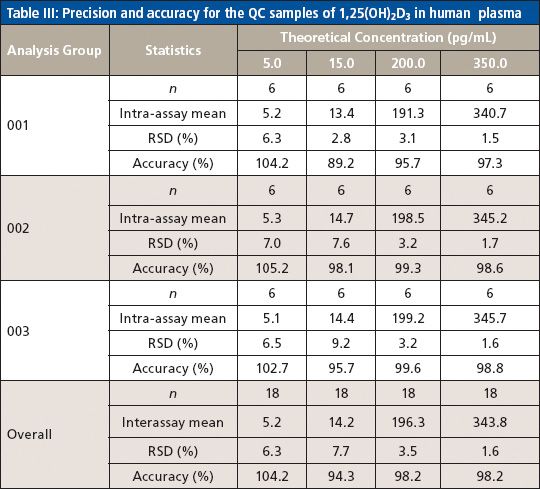
Method accuracy and precision were evaluated using quality control (QC) samples prepared by spiking 1,25(OH)2D3 into the blank plasma at four concentration levels (5.0, 15.0, 200.0, and 350.0 pg/mL) to serve as QC-LLOQ, low QC, mid QC, and high QC. Three consecutive batches were prepared and each batch contained a freshly prepared calibration curve and six replicates of QC samples at the four levels. Intra-assay precision was calculated by obtaining the relative standard deviation (RSD) of the six replicates of each QC level, and intra-assay accuracy was calculated by averaging the accuracies of six replicates of each QC level against the fresh curve. Interassay precision was calculated by obtaining the RSD of all 18 replicates at each QC level from all three batches, with overall accuracy calculated by averaging the accuracies of all 18 replicates at each QC level from all three batches. The method was found to be highly accurate and precise. The accuracy of 89.2–105.2% (of the theoretical value) and precision of 1.5–9.2% RSD for intra-assay, and accuracy of 94.3–104.2% and precision of 1.6–7.7% RSD for interassay were obtained for all QC levels including LLOQ (Table III).

The method selectivity was evaluated by assaying blank plasma sample without an internal standard. No interfering peaks were detected at the retention time of interest (Figure 3). To evaluate the recovery of the immunoaffinity step plus matrix effects, three samples were each prepared in triplicate. Sample 1 was a blank plasma sample spiked with 1,25(OH)2D3 (500.0 pg/mL) and an internal standard. Sample 2 was a blank plasma sample without IS. Sample 3 was water without IS. All three samples were processed according to the procedures described in the experimental section above; however, for samples 2 and 3, instead of adding derivatization solutions, a solution containing 1,25(OH)2D3 and the IS at concentrations that mimic the concentrations of sample 1 in the final extract were added right before being dried down for derivatization with PTAD. These samples are referred to as the postextraction spike sample (for sample 2) and the pure solution sample (for sample 3), respectively. The mean peak area counts of 1,25(OH)2D3 and the IS from three replicates of sample 1 were compared with the corresponding mean peak area counts from three replicates of sample 2 to calculate the extraction recovery. As shown in Table IV, a recovery of 83.2% for 1,25(OH)2D3 and 81.6% for the IS were achieved. Although the recovery of 1,25(OH)2D3 was lower than 100%, the percent recovery was very consistent for the three replicates performed. At the LLOQ detection limit, only the sample extracted by the immunoaffinity tubes showed a peak, which was not shown with other sample treatment methods like SPE (Figure 3). Similarly, matrix effects were calculated as follows: mean peak area from the postextraction spike samples minus the mean peak area from the pure solution samples, then divided by mean peak area from the pure solution samples and multiplied by 100. Positive values indicate percent enhancement and negative values indicate percent suppression. A matrix effect of 7.22% for 1,25(OH)2D3 and 13.42% for the IS was observed, and all three matrix lots showed very similar matrix effects. Although the matrix effect is a negative number, which indicates ion suppression for the samples treated by IAE, there was no other major interfering peak observed near the main peak (Figure 3) in the real patient sample. These data demonstrate the selectivity, robustness, and ruggedness of the method.


Conclusion
This work represents the first report to combine the advantage of IAE, PTAD derivatization, and methylamine adduction in the LC–MS-MS analysis of 1,25(OH)2D3 in human plasma. First, IAE is a key step for improving the assay sensitivity and eliminating interfering metabolites that cannot be eliminated by SPE. Second, methylamine addition in the mobile phase resulted in the same LLOQ when comparing AD alone to PTAD with methylamine. The results from PTAD are the same as that from AD. In contrast, the cost of the PTAD plus methylamine method was significantly lower than the original AD method, needing only half the run time (8 min versus 16 min). In addition, this method can be broadly adopted in a majority of LC–MS-MS laboratories. In conclusion, the PTAD plus methylamine method has significantly lower cost and greater practicality.
Acknowledgments
This research was paid for by a grant from the American Institute for Cancer Research (RTW). The authors would like to sincerely thank Dr. Subhakar Dey from AB Sciex for providing the Amplifex Diene derivatization reagent and the technical consultation for the initial development of the 1,25(OH)2D3 method on our mass spectrometry system. We also thank Dr. Curtis J. Hedman from the University of Wisconsin, Madison, for the discussion of using AD derivatization for the measurement of 1,25(OH)2D3. The authors also wish to thank Penn State College of Medicine Mass Spectrometry Core Facility for the support of instrumentation.
Jenny P. Dai is with the Department of Pharmacology at Pennsylvania State University, College of Medicine, in Hershey, Pennsylvania. Allen Xu, PhD, is Director at Keystone Bioanalytical Inc., in North Wales, Pennsylvania. Eric J. Battaglioli, PhD, is with the Department of Public Health Sciences at Pennsylvania State University, College of Medicine. Bruce A. Stanley, PhD, is director of Section of Research Resources at Penn State University, College of Medicine. Robin T. Wilson, PhD, is an associate professor of Public Health Sciences at Pennsylvania State University, College of Medicine. Direct correspondence to: pdai1211@yahoo.com
References
(1) J.I. Pedersen, Nutr. Rev.66, S165–169 (2008).
(2) A.C. Ross, C.L. Taylor, A.L. Yaktine, and H.B. Del Valle, Institute of Medicine Committee to Review Dietary Reference Intakes for Vitamin D and Calcium (The National Academies Press, Washington, DC, 2011).
(3) M.F. Holick, J. Invest. Dermatol.77, 51–58 (1981).
(4) M.F. Holick, Am. J. Clin. Nutr.80, 1678S–1688S (2004).
(5) S. Basit, Br. J. Biomed. Sci.70, 161–172 (2013).
(6) A.E. Broadus, R.L. Horst, R. Lang, E.T. Littledike, and H. Rasmussen, N. Engl. J. Med.302, 421–426 (1980).
(7) C.J. Hedman, D.A. Wiebe, S. Dey, J. Plath, J.W. Kemnitz, and T.E. Ziegler, J. Chromatogr. B953–954, 62–67 (2014).
(8) X. Duan, B. Weinstock-Guttman, H. Wang, E. Bang, J. Li, M. Ramanathan, and J. Qu, Anal. Chem.82, 2488–2497 (2010).
(9) T. Higashi, Y. Shibayama, M. Fuji, and K. Shimada, Anal. Bioanal. Chem.391, 229–238 (2008).
(10) P.A. Aronov, L.M. Hall, K. Dettmer, C.B. Stephensen, and B.D. Hammock, Anal. Bioanal. Chem.391, 1917–1930 (2008).


More Than Just Acronyms at EAS 2023
November 14th 2023Award recipient John McLean of Vanderbilt University said hybrid techniques do not exist purely as combinations of letters, slashes, and hyphens—they have been built on the shoulders of decades’ worth of analysis intended to refine and simplify workflow.

A Look at Rapid Quantification of PFAS in Non-Potable Waters
March 1st 2020The presence of per- and polyfluoralkyl substances (PFAS) in water is an important health and environmental concern. Liquid chromatography–mass spectrometry (LC–MS) has been established as the most suitable technology for monitoring these substances. A method is described, using EPA 8327, for PFAS analysis in groundwater, surface water, and wastewater.

Determination of Very Low Abundance Diagnostic Proteins in Serum Using Immunocapture LC–MS/MS
July 1st 2017There is growing interest in the determination of endogenous proteins in biological samples for diagnostic purposes, because a concentration increase or decrease of such proteins can allows us to monitor the state of a pathological condition such as cancer. Immunocapture LC–MS/MS analysis combines the workflow of conventional immunological assays with LC–MS analysis. This article describes typical challenges, such as cross reactivity and the mass spectrometer’s dynamic range, as well as the advantages of isoform differentiation and multiplexing.

Ion Mobility Spectrometers as Chromatographic Detectors
July 1st 2017Interest in connecting ion mobility spectrometry (IMS) to GC and especially to LC is now growing. One favorable property of IMS is that it can work with ambient pressure and can be easily connected to a gas or liquid chromatograph. Analytical applications of GC–MS and LC–MS are very different and encompass investigations into food, medical science, environment, drugs of abuse, chemical warfare agents, and explosives.


Quantitative Drug Metabolite Profiling without Radiolabels Using HPLC–ICP-MS
July 1st 2017In drug development, quantitative determination of a candidate drug and its metabolites in biofluids is an important step. The standard technique for quantitative metabolite profiling is radiolabeling followed by HPLC with radiodetection, but there are disadvantages to this approach, including cost and time, as well as safety and ethical concerns related to administering radiolabeled compounds to humans. Frank Vanhaecke and his research group at Ghent University have been developing an alternative technique, and he recently spoke to us about this work.

