Simplifying Measurement of D/H and 18O/16O Isotopic Ratios from Liquid Water by WS-CRDS
Wavelength-Scanned Cavity Ring Down Spectroscopy combines the real-time speed and turnkey simplicity of optical spectroscopy with the precision (<0.1 δ18O [‰], < 0.5 δD [‰]) previously only available from complex IRMS systems.
Wavelength-Scanned Cavity Ring Down Spectroscopy combines the real-time speed and turnkey simplicity of optical spectroscopy with the precision (<0.1 δ18O [‰], < 0.5 δD [‰]) previously only available from complex IRMS systems.
The fractionation of the isotopes of water that occurs during the hydrologic cycle (1) enables studies of many different processes such as climate change, ice and water flow, aquifer dynamics and landfill leaks. In addition, isotopically labeled water is used to measure metabolism processes including energy expenditure in humans (2).
WS-CRDS systems are increasingly used to measure isotopic ratios of 13C/12C, D/H, 18O/16O in atmospheric gas phase measurements (3). This application note demonstrates how a benchtop WS-CRDS instrument can simultaneously measure both δ18O and δD for liquid water samples quickly and easily without the need for special sample preparation or extensive operator training.
Experimental Setup
This study used a benchtop WS-CRDS water isotope analyzer (Picarro L1102-i) including an autosampler and vaporizer. The analyzer is equipped with a thermally controlled optical cavity with an effective path length of 20 kms. In addition, an onboard wavelength monitor ensures that the absorption lines unique to H216O, H218O, and HD16O can be scanned repeatedly and precisely, providing both δ18O and δD data in one fast measurement. The robotic sampler is configured to access a rack of liquid water samples in standard 2 ml vials. Liquid water is injected into the vaporizer and the ensuing water vapor is passed into the WS-CRDS cavity. The instrument method can be adjusted to balance throughput with precision and in this study the method is timed at 9 min to maximize precision. Experimental set-up can be easily accomplished through a .csv or similar file which presents the method and other parameters for the automated run. Data is output in a format suitable for standard processing techniques.
Results
Figure 1 shows data obtained from four different groundwater locations spanning a range of both δ18O and δD. Samples were filtered to remove particulates prior to the run. Each point represents a single 2 μl injection and 25 injections were made from each location. The first injection from each sample contained memory effects and was discarded. However, all injections were run contiguously without additional forms of purging between the different samples. As shown, the standard deviation for each location is remarkably small, especially given the change in environmental conditions over a non-stop 17 h of instrument operation. This level of repeatability with no drift confirms that a large batch of samples can be run without the need for re-calibration with reference samples, in sharp contrast to IRMS methods.

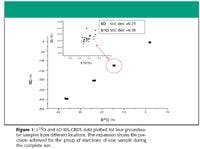
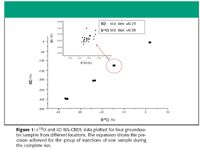
Figure 1
Conclusion
This demonstration of easy access to precise measurement of δ18O and δD should further accelerate and diversify the use of stable isotopes, in fields as diverse as water cycle studies, bird migration mapping, and metabolic activity modeling and optimization, to name just a few.
References
(1) N.L. Ingraham, in Isotope Tracers in Catchment Hydrology, C. Kendall and J.J. McDonnell, Eds. (Elsevier Science B.V., Amsterdam, 1998), pp. 87–115.
(2) D.A. Schoeller, et al., Int. J. Obesity 25(8), 1240–1245 (2001).
(3) E.R. Crosson, et al, Isotopes Environ. Health Stud. 42(1), 21–35 (2006).


Picarro, Inc.
480 Oakmead Parkway
Sunnyvale, CA 94085
Tel. (408) 962-3900, Fax (408) 962-3200
962-3200


Accurate Microplastics Analysis in Minutes, Not Hours
April 10th 2024The automated Agilent 8700 LDIR chemical imaging system lets you obtain high-quality images and spectral data faster than ever before. So, you can perform confident large-scale microplastics studies and monitoring activities.
Advancing Research of Plastics in the Environment Using the Agilent Cary 630 FTIR Spectrometer
April 10th 2024Plastic pollution has become a high-priority area of study in recent years due to the increasing prevalence of plastics in the environment. Currently, researchers have a limited understanding of the impact of plastic pollution on human health, how it affects wildlife and their habitats, and its long-term effects on the environment. An important step in overcoming this pressing global environmental issue is the advancement of research relating to the identification of plastic waste and microplastic particles.

