Spectroscopy and the Atomic Number
The history of how the atomic number came to be


The year 2013 represents the centennial of a seminal discovery about our universe. Key data that led to the discovery were obtained from — you guessed it — spectroscopy.
Ever since the enunciation of the modern atomic theory in 1803, the element has taken center stage in our understanding of matter. However, at the very beginning, elements were characterized by their atomic mass (1). John Dalton, the originator of the modern atomic theory, correctly assumed that hydrogen was the lightest element and so assigned it a relative mass of one. Masses of other substances were determined as a ratio to that of hydrogen (see Table I). Given the rather early state of the chemical sciences in the early 19th century, Dalton made several errors in his mass determinations, nor did he recognize that elemental hydrogen was a diatomic molecule. Nonetheless, the concept was sound, and it continues today with much more precise definitions of mass and instrumental techniques.

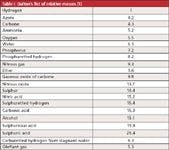

Table I: Dalton’s list of relative masses (1)
As the discovery of elements occurred through the 1800s, scientists noted similarities in the properties of the elements and began to group them together according to those similarities. According to Scerri (2), the first person to publish a chart in an attempt to systematize elements by properties was Alexandre-Emile Béguyer de Chancourtois, a French geologist. Figure 1 shows de Chancourtois's "periodic table" (my label, not his) (3). This figure, meant to be displayed on the surface of a tube so that the lines plot out a spiral, used more accurate measures of atomic mass that came out in 1858, right before the famed Karlsruhe Conference on chemistry in 1860. The work by de Chancourtois was not spotted by chemists because he published mostly in the field of geology. Over the next several years, contributions to element organization were made by Newlands, Odling, and Hinrichs (4).

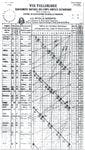

Figure 1: De Chancourtois’s organization of the known elements (as of 1862), based on atomic masses. (This media file is in the public domain in the United States [PD-US, PD-1923].)
In 1862, German chemist Julius Lothar Meyer developed a table that not only had gaps to accommodate potentially new elements, but also included at least one deviation from a strict ordering by atomic mass — tellurium (with a reported mass of 128.3 relative to hydrogen) was listed before iodine (mass of 126.8). Published as part of a chemistry text in 1864 (5), Lothar Meyer apparently felt that chemical properties trumped atomic masses, although an argument could be (and was) made that the measurements of the atomic masses were inaccurate and that atomic masses were still the fundamental organizational principle. Although Lothar Meyer was preparing a second edition of his book to be published in 1868, which would include even more accurate mass data for even more elements, the book was never published and his periodic table did not become well known until later — after he lost a historical priority dispute with Mendeleev.
In 1869, Russian chemist Dmitri Mendeleev published his version of a periodic table (6), complete with gaps and predictions for the chemical and physical properties of the elements that would fit in those gaps. An 1871 version of the table is shown in Figure 2 (7). Note a bit of revisionist science — in Figure 2, tellurium is given an atomic mass of 125 so that it appears before iodine (whose symbol is J). Mendeleev firmly believed that the atomic mass was controlling, so much so that he argued that the atomic masses of tellurium and iodine were incorrect. Because of Mendeleev's activism, his outlets of publication, and the success of his predictions in filling the gaps, he is widely (and perhaps incorrectly) recognized as the father of the modern periodic table.

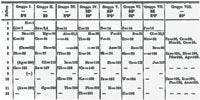

Figure 2: Mendeleev’s 1871 version of his periodic table. Note the gaps for masses 44, 68, 72, and 100. (This media file is in the public domain in the United States [PD-US].)
There things stood.
Interlude: Some Discoveries
Several seemingly unconnected discoveries then came into play.
In 1897, following some studies of cathode rays, Joseph John Thomson proposed that these rays were, instead, particles much smaller than a hydrogen atom (8). Thomson based this hypothesis in part on measurements of how far the particles traveled in air, and was able to estimate the mass-to-charge ratio, m/e, of the "corpuscles" as 1.6×10⁻⁷ (compared to about 10-4 for hydrogen atoms) He explained this in his book (8):
If the result stood by itself we might think that it was probable that e was greater than the atomic charge of atom rather than that m was less than the mass of a hydrogen atom. Taken, however, in conjunction with Lenard's results for the absorption of the cathode rays, these numbers seem to favour the hypothesis that the carriers of the charges are smaller than the atoms of hydrogen.
These "corpuscles," shown to be obtainable from all matter, were dubbed electrons.
Analogous to, but lesser known than cathode rays are anode rays. These rays travel in an opposite direction to cathode rays, and in 1907 were also shown to be deflected by a magnetic field. The problem was that different gases in discharge tubes created anode rays that had different properties — unlike cathode rays, which always had the same properties. However, the lightest known anode rays were produced by hydrogen. After the nature of the electron was understood, especially the fact that the electrons were negatively charged, it was realized that anode rays represented positively charged subatomic particles.


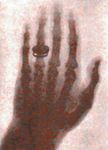
Figure 3: X-ray photograph of Anna Röntgen’s hand, taken by Wilhelm Röntgen himself only days after the discovery of X-rays.
Although it was long understood that there was very likely some positive particle to balance the electric charge of the electron, explicit experimental evidence of the existence of such a particle wasn't available until 1917, when Ernest Rutherford and his associates were studying the properties of radioactive particle emission on other matter. Rutherford's team produced hydrogen nuclei when bombarding nitrogen gas with alpha particles, leading Rutherford to conclude that hydrogen nuclei were actually a component of the nitrogen nucleus. (This is somewhat related to Prout's hypothesis, that every atom is actually a multiple of hydrogen atoms.) Knowing that hydrogen was the simplest element, Rutherford proposed that the hydrogen nucleus was the smallest possible nucleus, and that the nucleus itself was just a fundamental particle. This fundamental particle, called a proton, became one constituent of the nucleus in Rutherford's nuclear model of the atom, proposed in 1911.

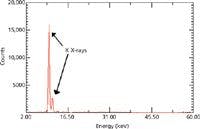
Figure 4: X-ray emission spectrum of germanium, showing characteristic emission of X-rays by the atoms.
Finally, in 1895, German physicist Wilhelm Röntgen was experimenting with cathode ray tubes when he noticed a sample of barium platinocyanide fluorescing despite the fact that he had covered the tube with cardboard. He speculated that some hitherto unknown form of radiation was being emitted by the tubes, and spent the weekend investigating and confirming their properties before publishing his work in late 1895 (9). Röntgen's discovery of "X-radiation," as he called it, revolutionized medical diagnostics (Figure 3 shows the image of Röntgen's wife's hand, wearing a ring; Anna Röntgen is reported to have been horrified by the image).


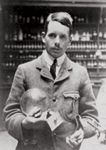
Figure 5: Henry Gwyn Jeffreys Moseley.
X-rays were also discovered as a useful tool for probing matter. Although at first Röntgen did not believe that his new radiation was a type of light (in part because it did not demonstrate obvious properties of light, like reflection and refraction), X-rays were soon shown to be a form of electromagnetic radiation. In 1913, father and son team William Lawrence Bragg and William Henry Bragg discovered that solid crystals can cause strange patterns of reflected X-rays, and they developed the Bragg equation to explain how parallel planes of atoms or ions can diffract X-rays in a way determined by their wavelengths and the angle of incidence. They were awarded the 1915 Nobel Prize in physics for the feat. X-rays also form the basis of a form of spectroscopy, something that has been discussed in this column (10,11). In one form of X-ray spectroscopy, the incoming X-rays knock out one (or more) electrons from an inner shell of an atom, depending on how energetic the X-rays are. Electrons from higher shells fall toward the nucleus to fill the gap, and in doing so emit radiation characteristic of the atom. In another form of X-ray spectroscopy, high-energy electrons bombard a sample, which emits X-radiation characteristic of the chemical makeup of the sample. Figure 4 shows an X-ray emission spectrum of an element, showing the characteristic radiation given off by this particular element. The two signals in the spectrum are labeled "K lines" based on the Siegbahn notation used in X-ray spectroscopy. The letter "K" refers to the lowest principal quantum level of electrons in an atom (in modern terms, the principal quantum number n equals 1). Essentially, the K lines in an X-ray spectrum are generated when an upper-level electron falls into the empty n = 1 level of an irradiated atom. The K is further labeled "α" if the falling electron comes from the n = 2 level of the atom, and "β" if it comes from the n = 3 level of the atom. Because the n = 1 shell is the lowest electron shell in an atom, the K lines are usually the highest-energy X-rays given off by a sample. There are also "L lines," for which the final shell number is 2, and so on.


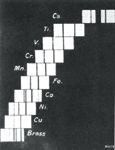
Figure 6: Photograph of the Kα and Kβ lines of a series of elements, in this case mostly the first-row transition elements. Note the regular movement toward lower and lower wavelengths (toward the left). It is also easy to see that the Co sample is contaminated with Ni, and perhaps some Fe. (This media file is in the public domain in the United States [PD-US].)
Enter Moseley
Henry Gwyn Jeffries Moseley (Figure 5) was an English physicist. Born in 1887, he entered the University of Oxford in 1906 and earned a bachelor's degree, after which he became a graduate student at the University of Manchester under Rutherford for a year before moving back to Oxford. Moseley was influenced by Rutherford's nuclear theory of the atom and by Bohr's theory of the hydrogen atom, which showed that the energy of the electron was related to the square of the positive nuclear charge — but only for hydrogen and hydrogen-like atoms with a single electron. Despite Bohr's success with predicting the spectrum of hydrogen, he was unable to predict the spectra of other elements.

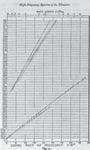
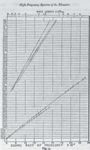
Figure 7: Moseley’s fit of the square root of the frequency of the K (lower two lines) and L (upper three lines) versus a whole number (12). Note the gaps at 43, 61, and 75; the entries between 69 and 72 are confusing, but at this time there was still significant confusion among the rare earth elements.
Moseley began studying elements using X-ray spectroscopy, and began measuring their characteristic X-ray emission spectra. He focused on the K and L lines, and devised an apparatus to use a crystal of known structure (using the Bragg technique) to determine the wavelengths of the characteristic X-ray emissions of as many elements as he could obtain. A photo of some of Moseley's results is shown in Figure 6. There is an obvious progression in the wavelengths of the lines. After tabulating his data, he was able to fit his numbers to a straight line by taking the square root of the frequency and plotting this value versus some integer (see Figure 7) (12). Mathematically, Moseley is demonstrating that


where the symbol "∝" means "is proportional to." Another way to state this is by squaring both sides of the equation to get


which is consistent with Bohr's theory of the atom, where Z is the electrical charge on the nucleus of the atom. (In actuality, Moseley fit the frequency data to (Z – 1)2; the reason for the "-1" term had to await the development of quantum mechanics.) Because we now know that the positive charges of the nucleus are carried by the protons, essentially what Moseley demonstrated was that the number of protons in the nucleus determines the frequency of characteristic X-rays emitted by any given element — rather, that the number of protons in a nucleus determines an element, a hypothesis that had already been proposed by Bohr and by Dutch physicist Antonius van den Broek in 1911. We give this number a new name: the atomic number. Thus, using X-ray spectroscopy, Moseley demonstrated that the ordering of the elements in the periodic table was based on the atomic number, not the atomic mass. (In doing so, Moseley also redesigned the periodic table by switching the positions of nickel and cobalt.) The mathematical relationship between frequency and atomic number is called Moseley's law and, in modern terms, is given by the expression

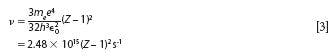

for the Kα lines, where in the final expression the values of the fundamental constants have been substituted and simplified. Moseley obtained a value of 2.47×10¹⁵ s-1 — not a bad agreement with theory! Similar expressions are available for the Kβ and L lines.
Like Mendeleev before him, Moseley also left gaps, representing elements that he could not obtain. Of those elements, four existed having atomic numbers between those of known elements. Those atomic numbers were 43, 61, 72, and 75, thus completing the periodic table between aluminum (the lightest element Moseley could detect X-rays from) and gold (the heaviest element Moseley had available to him). Of these, the first two were finally identified synthetically, as all isotopes of technetium (43) and promethium (61) are radioactive with half-lives significantly less than the age of the earth. The other two are very rare, and were eventually isolated and named hafnium and rhenium. Moseley's work pointed out that the list was now complete: There were no more missing elements between Z = 13 and Z = 79. Later scientists had to be content by discovering elements heavier than gold, sometimes using atom smashers.
We now understand the primacy of the atomic number for identifying elements and serving as the true organizing principle of the periodic table. Moseley's X-ray spectroscopy provided experimental evidence for a much more fundamental understanding of the elements.
Epilogue
On June 28, 1914, Archduke Franz Ferdinand was assassinated by Gavrilo Princip. After a month of diplomatic negotiations, on July 28, Austria declared war on Serbia, and by August 4 several other major European countries declared war on each other. Among them was Britain declaring war on Germany, and Henry Moseley volunteered for the Royal Engineers of the British Army. During the months-long Battle of Gallipoli in Turkey, Moseley was killed by a sniper on August 10, 1915. He was 27 years old. Science writer Isaac Asimov noted that, given Moseley's potential, his death might be considered the "single most costly death" of World War I (13).
References
(1) J. Dalton, Memoirs of the Literary and Philosophical Society of Manchester 1, 271 (1805).
(2) E.R. Scerri, The Periodic Table, its Story, and its Significance (Oxford University Press, 2007).
(3) A.E.B. de Chancourtois, Comptes Rendus 54, 757 (1862).
(4) E.R. Scerri, A Tale of Seven Elements (Oxford University Press, 2013).
(5) J. Lothar Meyer, Die Moderne Theoriene der Chemie (Breslaw, 1864).
(6) D. Mendeleev, Zhurnal Russkoe Fiziko-Khimicheskoe Obshchestvo 1, 60 (1869).
(7) D. Mendeleev, Zhurnal Russkoe Fiziko-Khimicheskoe Obshchestvo 3, 25 (1871).
(8) J.J. Thomson, The Electrician 39, 104 (1897).
(9) W. Röntgen, Über eine neue Art von Strahlen (Würzburg, Stahel, 1895).
(10) D.W. Ball, Spectroscopy 18(11), 36 (2003).
(11) D.W. Ball, Spectroscopy 24(6), 14 (2009).
(12) H. Moseley, Phil. Mag., 703 (1914).
(13) I. Asimov, Asimov's Biographical Encyclopedia of Science and Technology (Doubleday and Company, 1972), p. 921.
A SPECIAL THANK YOU
This marks the last installment of David W. Ball's column "The Baseline." The editors of Spectroscopy wish to thank David for all of his contributions to the magazine and to the understanding of spectroscopic techniques for the last 19 years. Although David is stepping down from his role as a regular columnist, the editors are pleased to note that he will continue to submit articles to us periodically.
Thank you, David!
David W. Ball is a professor of chemistry at Cleveland State University in Ohio. Many of his "Baseline" columns have been reprinted as The Basics of Spectroscopy, available through SPIE Press. Professor Ball sees spectroscopy from a physical chemistry perspective because that's his background. He recently served as a Distinguished Visiting Professor at the US Air Force Academy, but is now back home in Ohio. He can be reached at d.ball@csuohio.edu.


David W. Ball


Getting accurate IR spectra on monolayer of molecules
April 18th 2024Creating uniform and repeatable monolayers is incredibly important for both scientific pursuits as well as the manufacturing of products in semiconductor, biotechnology, and. other industries. However, measuring monolayers and functionalized surfaces directly is. difficult, and many rely on a variety of characterization techniques that when used together can provide some degree of confidence. By combining non-contact atomic force microscopy (AFM) and IR spectroscopy, IR PiFM provides sensitive and accurate analysis of sub-monolayer of molecules without the concern of tip-sample cross contamination. Dr. Sung Park, Molecular Vista, joined Spectroscopy to provide insights on how IR PiFM can acquire IR signature of monolayer films due to its unique implementation.


