Surface-Enhanced Raman Spectroscopy for Trace-Level Dimethoate Detection Based on a Silver Nanoparticle–Probe–Smooth Gold Film Substrate
Spectroscopy
In this paper, we demonstrate a sensitive surface-enhanced Raman spectroscopy (SERS) substrate for trace dimethoate detection. The substrate is composed of Ag nanoparticle/probe/smooth Au film stack configuration. The nanogap formed by an Ag nanoparticle and a macroscopically flat Au film is one kind of “hot site” which will dramatically increase the total “hot spots” number.
Pages 38–47
In this article, we demonstrate a sensitive surface-enhanced Raman spectroscopy (SERS) substrate for trace dimethoate detection. The substrate is composed of a silver nanoparticle–probe–smooth gold film stack configuration. The nanogap formed by a silver nanoparticle and a macroscopically flat gold film is one kind of “hot site” that will dramatically increase the total “hot spots” number.
Raman spectroscopy is a powerful analytical tool because of its nondestructive nature and high resolution fingerprinting details (1,2). However, the Raman signals are often very weak and are a hindrance to its application. Surface-enhanced Raman scattering (SERS) is a phenomenon in which the scattering cross sections of probe molecules are dramatically enhanced. In recent years, it has been widely applied in fields such as biology, sensors, and chemical detection (3–5). In the study of SERS, substrate fabrication is the key point, and it is difficult to prepare an excellent and reusable SERS substrate with good reproducibility. There are many publications focused on SERS-active metal substrate fabrication design and topics such as colloidal chemistry, electrodeposition, and template methods (6–8). In a large number of SERS substrates, silver nanoparticles are widely studied as target materials because of their excellent performance.
At present, more and more chemical pesticides are used in modern agriculture to promote crop production. Dimethoate is a typical organophosphorus pesticide used in agriculture, and crop surfaces always have dimethoate residue (9). Dimethoate causes pesticide pollution and therefore has become a serious threat to human health. Many researchers pay attention to the design and fabrication of the SERS-active substrates, but very little research has been focused on the suitable SERS substrates for the detection of trace pesticide residues (10,11).
In this article, a sensitive SERS substrate for trace dimethoate detection is demonstrated. The substrate is composed of a silver nanoparticle–probe–smooth gold film stack. The Ag nanoparticles have been prepared and used as a SERS-active substrate. The nanogap formed by a silver nanoparticle and a macroscopically flat gold film is a one kind of “hot site.” The Au film is on a freshly cleaved mica sheet, and it has a long preservation time. After the detection, the Ag nanoparticles and probe molecules can be rinsed off and the substrate can be reused. Theoretical simulations show the maximum SERS enhancement factor located at the gap between the upper spheres and lower spheres can be up to 1011, and it is not sensitive to the polarization direction of the incident radiation. The experimental results show the dimethoate pesticide can be measured at a concentration of as low as 0.1 mg/L using the Ag nanoparticle–probe–Au film stack substrate. Furthermore, the reproducibility of the Raman signal is also very good with a relative standard deviation of 25.74%.
Experiments
Dimethoate (O,O-dimethyl S-[2-(methylamino)-2-oxoethyl; 98.6% purity) was purchased from Accu-Standard, Inc. A stock solution of 100 mg/L dimethoate was prepared by dilution in high-purity methanol (Sigma-Aldrich). Mixtures of methanol and ultrapure water at a ratio of 1:1 were used to prepare a range of standard solution concentrations of 0.1, 0.5, 5, and 10 mg/L. To acquire the spontaneous Raman spectrum, solid dimethoate pesticide powder was deposited on the glass slide and then pressed to form a thin film.
A Nicolet DXR microscope Raman spectrometer (Thermo Fisher Scientific Corp.) was used to collect the confocal Raman microspectra and SERS spectra with a charge-coupled device (CCD) array detector. The excitation light wavelength was 780 nm with a maximum power of 14 mW. And this system had a high spatial resolution, better than 1 µm. The confocal depth resolution was 2 µm.
Silver nitrate (AgNO3, 99.9%) and trisodium citrate (C6H5Na3O7.2H20, 99.9%) were purchased from Aldrich. Ag hydrosol was prepared by following the modified procedure of Lee and Meisel (12). A scanning electron microscopy (SEM) image of Ag nanoparticles is shown in Figure 1. As shown in Figure 1, most of the Ag nanoparticles were spherical in shape with diameters of 40–100 nm; a few were nanorods with lengths of 200–500 nm. A macroscopically smooth Au substrate was prepared on a freshly cleaved mica sheet by vacuum evaporation. The thickness of the Au film was about 200 nm. The Au film and Ag sol were combined together to form SERS-active substrates.

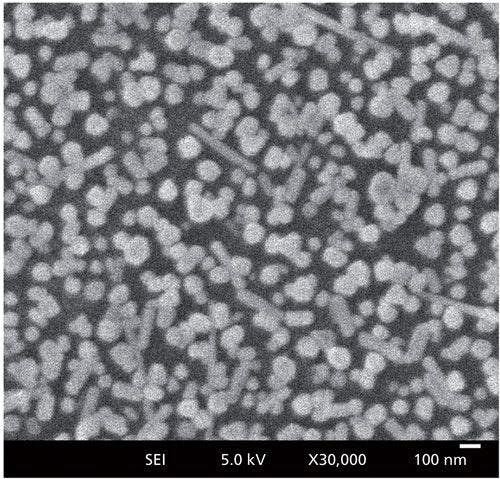
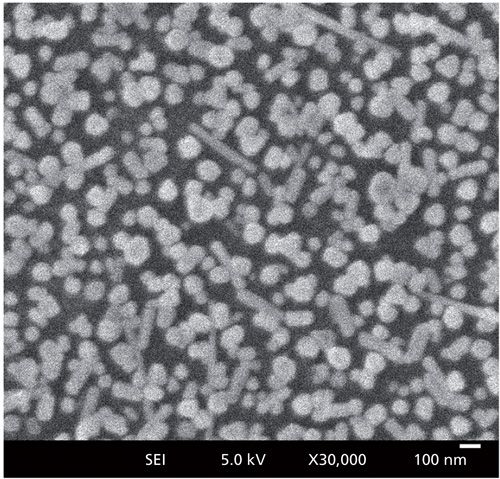
Figure 1: SEM image of Ag nanoparticles used in the experiment.
Three different SERS-active substrates were made and compared to determine which one was the best for trace dimethoate detection. The sample was first prepared by mixing 200 µL of aqueous dimethoate, 40 µL of silver sol, and 60 µL of a 160 mmol/L NaCl solution. After 10 min of homogeneous mixing, a 2-µL sample of the mixture was placed on the Au film substrate. The solvent was then evaporated to leave a thin film of analyte at the surface at room temperature, and it became a silver nanoparticle–probe–gold film stack, as shown in Figure 2a. The second SERS substrate was made of the sample aqueous solution (dimethoate solution and Ag sol) placed on a quartz plate without an Au film, shown as Figure 2b. The third SERS substrate was the Ag nanoparticle–probe–Au film sandwich configuration that was prepared by following the procedure of Kim and colleagues (13). The gold substrate was immersed in dimethoate solution (without Ag sol) overnight, followed by soaking in Ag sol for 1 h. Then it became a silver nanoparticle–probe–gold film sandwiched substrate, as shown in Figure 2c.

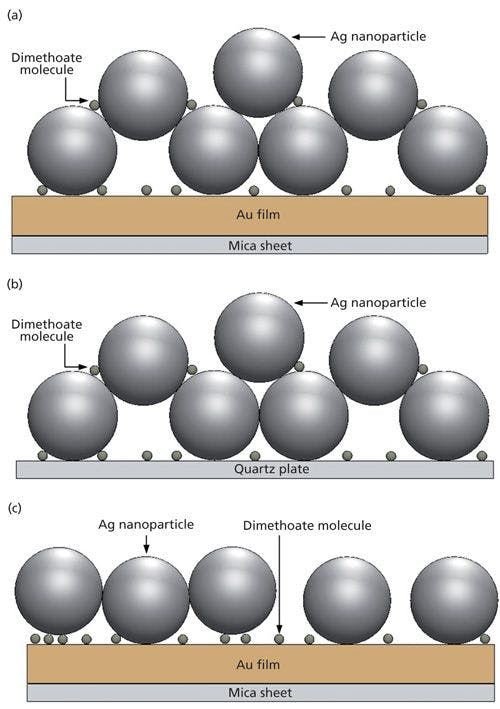
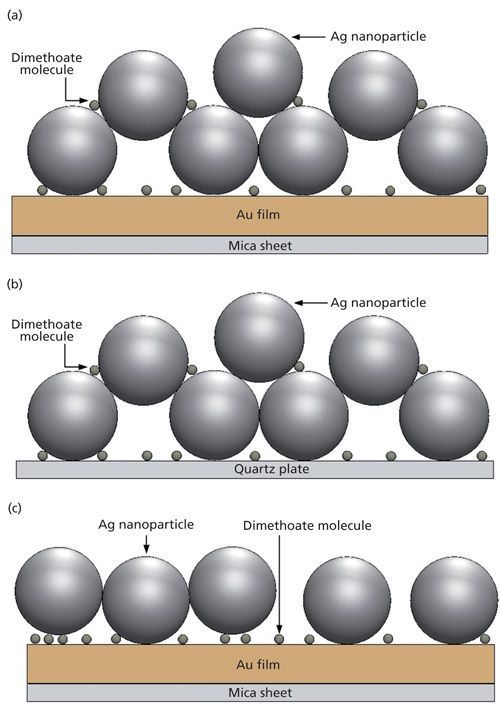
Figure 2: Schematic diagrams of (a) the silver nanoparticle–probe–gold film stack configuration, (b) the silver nanoparticle–probe configuration (without Au film), and (c) the silver nanoparticle–probe–gold film sandwiched configuration.
Next, 15 Raman spectra of dimethoate were collected at different locations on each substrate. For every substrate, four dimethoate solutions with concentrations of 10, 5, 0.5, and 0.1 mg/L were used. Spectral data were collected using Omnic software (Thermo Nicolet Corp.). In the experiments, all Raman spectra were collected from 200 to 2000 cm-1 under the same conditions (12 mW laser power, 5 cm-1 resolution, and 5 s exposure time).
Results and Discussion
Three-dimensional finite-different time-domain (3D-FDTD) electrodynamics simulations of the three different substrates were carried out. For the Ag nanoparticle–probe–Au film stack substrate, a nanostructure composed of several Ag spheres with a diameter of 80 nm and a flat gold film was modeled with some Ag spheres laid on the gold substrate and others laid on the spheres, as shown in Figure 2a. Figure 3 shows the 3D-FDTD results obtained using 80-nm Ag spheres laid on Au substrate when it was irradiated by 780 nm light. When the perpendicularly polarized light, whose electric field E was perpendicular to the surface of the Au film (its wave vector K was parallel to the surface of the Au film), was used as the incident light, taking account of the fact that the Raman scattering enhancement could be represented as |E/E0|4 (E and E0 are the local and input fields, respectively) (14,15), the maximum enhancement factor (EF) was as large as 2.3 × 10¹¹. When the incident light was parallel-polarized with the electric field E parallel to the surface of the Au film (its wave vector K was perpendicular to the surface of the Au film), the maximum EF was about 1.6 × 10¹¹. As opposed to an isolated nanoparticle dimer (16,17), in this study one upper nanosphere was often supported by two or more lower nanospheres. The exciting electric field vector was not perfectly polarized along or across any interparticle axis. Because of the inclined angle variation between the electric field E and the interparticle axis, the FDTD simulation results showed the EFs located at the gaps between the upper spheres and the lower spheres were negligibly different when the incident light was polarized perpendicular or parallel to the substrate surface.

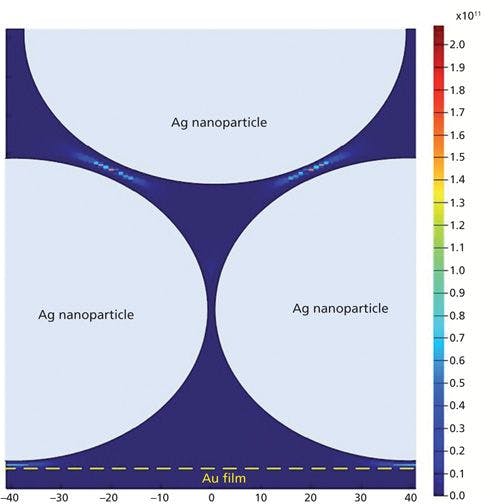

Figure 3: Intensity distribution (|E/E0|4) near Ag spheres and Au film, calculated by the 3D-FDTD method with the electric field directed perpendicular to the surface of the Au film.
Under the actual experimental conditions with a microscope, the laser beam was directed along the normal to the sample and the electric field of the incident light was considered mostly to be parallel-polarized to the substrate surface. But because the microscope lens had a high numerical aperture, the laser beam would be highly refracted, especially at the edge, which would result in the incident light having two kinds of component whose electric field was parallel or perpendicular to the substrate, respectively. In this situation, the maximum EF values were located at the gaps between the upper spheres and lower spheres that were greater than the EFs at other locations, such as at the gaps between the spheres and the Au film, and the gaps between two spheres in the same layer. Based on this situation, the maximum EF of the Ag nanoparticle–probe–Au film substrate was not sensitive to the polarization direction of the incident radiation. In addition, the calculated results showed that the nanogap formed by the Ag nanoparticle and a macroscopically flat Au film, another type of “hot site,” had an EF that can be as large as 5.2 × 10⁹, two orders of magnitude less than that between particles.
When using the sample aqueous solution (Ag sol and dimethoate solution mixture) laid on the quartz plate with 780-nm incident light, the intensity of the induced electric field was also not sensitive to the polarization direction of the incident radiation. FDTD simulation results showed that the maximum EFs were located at the gaps between the upper spheres and the lower spheres with values of up to 1010 when the incident light was a perpendicular-polarized light or parallel-polarized light. Different from the Ag nanoparticle–probe–Au film stack substrate, here there were no “hot sites” between the Ag nanoparticles and Au film because there was no Au film. So, in this condition, the surface enhancement effect was weaker than the Ag nanoparticle–probe–Au film stack substrate.
We also studied the FDTD results using the Ag nanoparticle–dimethoate–Au film (sandwich configuration) with 780-nm incident light for comparison. The gap distance between the Ag sphere and Au film was fixed at 1 nm. In this situation, there were only “hot spots” formed by the Ag sphere and Au film. The intensity of the induced electric field was extremely sensitive to the polarization direction of the incident radiation, consistent with the simulation result obtained by Kim and colleagues (13,14,18). A strong electric field was thus induced at the gap between the Ag sphere and Au film and the maximum EF value could be as large as 7.1 × 10⁹ when a perpendicularly polarized light was used as the incident light. But when parallel-polarized light was used the maximum EF value was only 4.0 × 10⁵.
Figure 4 shows the molecular structure and Raman spectrum of solid dimethoate. In the Raman spectrum of solid dimethoate, major peaks were located at several positions: 498 cm-1 caused by CH3 rotation, 650 cm-1 caused by P=S stretching, and 407 cm-1, 766 cm-1, 913 cm-1, 1166 cm-1, 1338 cm-1,1449 cm-1, and so on (19,20). The Raman spectrum and the SERS spectrum of dimethoate solution at 10 mg/L were studied without and with the SERS substrate, respectively. A strong Raman signal could be found in the SERS spectra, but no detectable signal was found at 10 mg/L of dimethoate solution without substrates. This is the result of the low sensitivity of Raman spectroscopy.

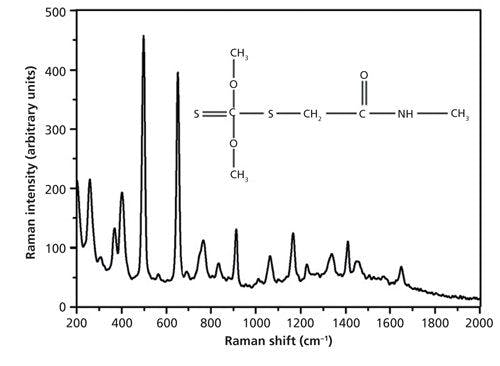

Figure 4: Spontaneous Raman spectrum and the molecular structure of dimethoate.
Figure 5 shows the SERS spectra of dimethoate with the Ag nanoparticle–probe–Au film stack substrate at different concentrations. It was reported that the peak splitting observed at 407, 498, 650, and 1166 cm-1 for dimethoate can be respectively assigned to P-O-C deformation, CH3 torsion vibration, P=S stretching vibration, and C-C stretching vibration (19,20). The characteristic peaks at around 662 cm-1 that were splitting from the 650 cm-1 peak in the solid dimethoate Raman spectrum could be discerned at a concentration of as low as 0.1 mg/L. The other characteristic peaks at around 407, 498, 766, 913, 1166, and 1449 cm-1 were very weak at a concentration of 0.1 mg/L. In general, the intensity of prominent SERS peaks increased with an increase of dimethoate solution concentration, but for different adsorption bands the increase rate was different. As shown in Figure 5, there were major peaks, at 407, 498, 662 (650), 913, 1166, and 1449 cm-1 that were prominent in both the Raman and SERS spectra. However, there were also some peaks in the Raman spectrum of dimethoate, such as at 766 and 1338 cm-1, that were not prominent in the SERS spectra.

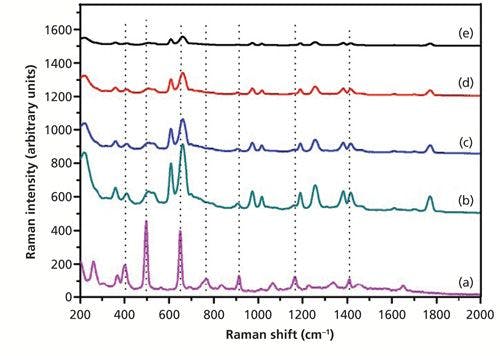
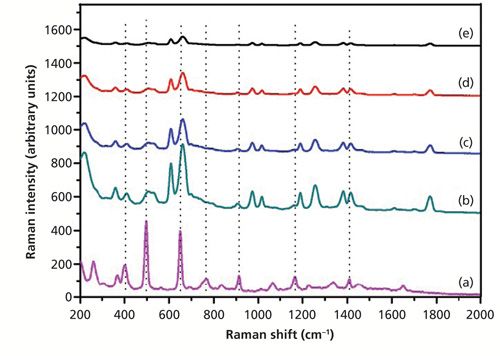
Figure 5: (a) The spontaneous Raman spectrum of solid dimethoate, and SERS spectra of dimethoate solutions with concentrations of (b) 10 mg/L, (c) 5 mg/L, (d) 0.5 mg/L, and (e) 0.1 mg/L (Ag nanoparticle–probe–Au film stack as the SERS substrate).
Figure 6 shows the SERS spectra of dimethoate with only Ag sol substrate at different concentrations. As shown in Figure 6, the peak at 650 cm-1 was not enhanced, but the peaks at 766 and 1320 cm-1 (near 1338 cm-1) were enhanced. The characteristic peaks at around 766 cm-1 and 1320 cm-1 could be discerned at a concentration of as low as 0.5 mg/L. At the concentration of 0.1 mg/L, there were some small signals, but they were difficult to discern. So the Ag nanoparticle–probe–Au film stack substrate had a stronger SERS enhancement factor than the Ag nanoparticle alone because of the “hot sites” formed by Ag nanoparticles and the macroscopically flat Au substrate, which increased the number of the substrate “hot spots.” Figure 7 showed the SERS spectra of dimethoate with the Ag nanoparticle–probe–Au film sandwiched substrate at different concentrations. As shown in Figure 7, the peaks at 498 and 650 cm-1 were also not enhanced, but the peaks at 766 and 1320 cm-1 (near 1338 cm-1) were enhanced. The characteristic peak at around 1320 cm-1 (near 1338 cm-1) in the solid dimethoate Raman spectrum could be discerned at a concentration of as low as 0.5 mg/L. The concentration of 0.1 mg/L produced some small signals that were also difficult to discern.


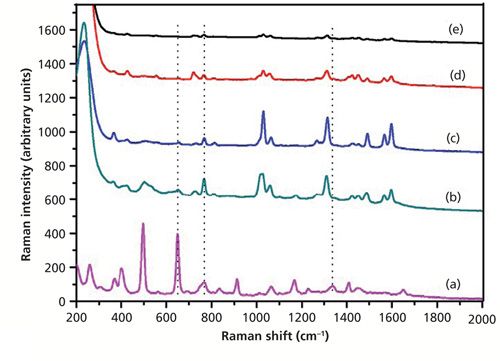
Figure 6: (a) The spontaneous Raman spectrum of solid dimethoate, and SERS spectra of dimethoate solutions with concentrations of (b) 10 mg/L, (c) 5 mg/L, (d) 0.5 mg/L, and (e) 0.1 mg/L (only Ag sol as the SERS substrate).

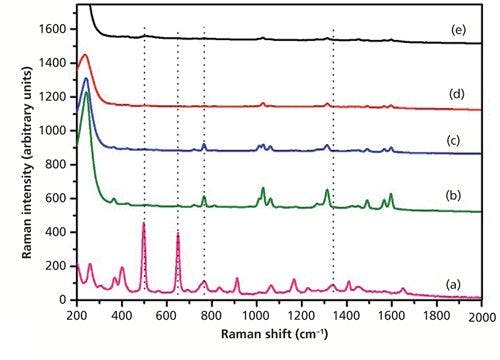
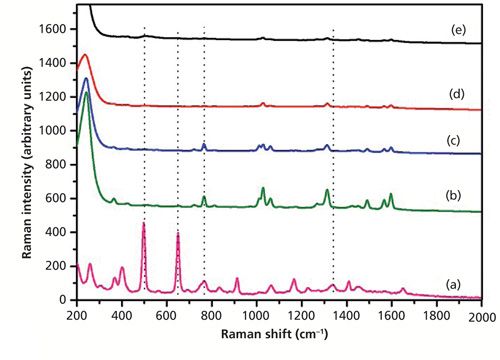
Figure 7: (a) The spontaneous Raman spectrum of solid dimethoate, and SERS spectra of dimethoate solutions with concentrations of (b) 10 mg/L, (c) 5 mg/L, (d) 0.5 mg/L, and (e) 0.1 mg/L (the SERS substrate is in the Ag nanoparticle–probe–Au film sandwich configuration).
The SERS spectral differences in Figures 5, 6, and 7 were relevant to the binding mechanisms between the dimethoate molecule and the Ag nanoparticle or Au film. As shown in Figure 2, the configurations of the SERS-active substrates were different. There was only one kind of “hot site” in Ag nanoparticle–probe substrate (without Au film) or in the Ag nanoparticle–probe–Au film sandwiched substrate, such as the “hot site” formed by two Ag nanoparticles or the “hot site” formed by Ag nanoparticles and Au film. But there were both kinds of “hot sites” in Ag nanoparticle–probe–Au film stack configuration. The dimethoate molecules might be adsorbed onto the Au film and the Ag nanopaticles at different orientations. And the types of adsorption sites also varied. These contributed to the broadening of the surface-enhanced Raman signals and also affected the wavenumbers of the Raman signals (21).
The reproducibility of the Ag nanoparticle–probe–Au film stack substrate for SERS detection was also studied. The reproducibility of the SERS signal is demonstrated by the Raman intensities of dimethoate with concentration of 10 mg/L at 662 cm-1 from 40 spots of SERS data that are shown in Figure 8. The relative standard deviation (RSD) of the dimethoate Raman intensity (662 cm-1) on the stack substrate was 25.74%. The Raman intensity variation might be attributed to the inhomogeneous distribution of the Ag nanoparticle laid on the Au film, and it could also result from the loosely coupled system of Ag nanoparticles and dimethoate molecules.

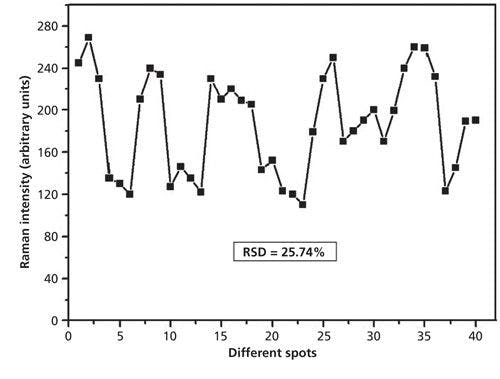

Figure 8: 40-spot SERS spectra intensity of dimethoate solution (at 10 mg/L) at 662 cm-1 collected using the Ag nanoparticle–probe–Au film stack substrate.
Conclusion
Surface-enhanced Raman spectroscopy for trace dimethoate pesticide detection based on three different substrates is demonstrated in this paper. Because the “hot spots” formed by stack Ag nanoparticles and the macroscopically flat Au substrate are different from those formed by isolated particle dimers, the SERS EF of the Ag nanoparticle–probe–Au film stack substrate is not sensitive to the polarization direction of the incident light and it has stronger SERS enhancement effect than the Ag sol alone or the Ag nanoparticle–probe–Au film sandwich substrate. Using this Ag nanoparticle–probe–Au film stack substrate, we obtained the Raman spectra of dimethoate pesticide and were able to measure the pesticide at a concentration of as low as 0.1 mg/L. The results indicate that SERS with the stack substrate has the potential for the detection and analysis of trace organophosphorus and other pesticide residues. The substrate could also be used for other potential applications, such as in microfluidics and biochemical sensors where the Raman signals can be increased to a level for practical analysis.
Acknowledgments
This work was supported by the Youth Science Foundation of Jiangxi Province (Grant No. 20132BAB211029) and the National Natural Science Foundation of China (Grant No. 61505073).
References
- M.J. Pelletier, Analytical Applications of Raman Spectroscopy (Blackwell Science Ltd., Oxford, UK, 1999).
- E. Smith and G. Dent, Modern Raman Spectroscopy-A Practical Approach (John Wiley & Sons Ltd., Chichester, UK, 2005).
- S. De Vitis, M.L. Coluccio, F. Gentile, N. Malara, G. Perozziello, E. Dattola, P. Candeloro, and E. Di Fabrizio, Optics and Lasers in Engineering76, 9–16 (2016).
- X. Zhao, J. Xue, Z. Mu, Y. Huang, M. Lu, and Z. Gu, Biosens. Bioelectron. 72, 268–274 (2015).
- Y. Cao, D.-W. Li, L.-J. Zhao, X.-Y. Liu, X.-M. Cao, and Y.-T. Long, Anal. Chem.87(19), 9696–9701 (2015).
- B. Wang, L. Zhang, and X. Zhou, Spectrochim. Acta, Part A121, 63–69 (2014).
- J.-Hua Tian, B. Liu, X. Li, Z.-L. Yang, B. Ren, S.-T. Wu, N. Tao, and Z.-Q. Tian, J. Am. Chem. Soc. 128(46), 14748–14749 (2006).
- W.-D. Li, F. Ding, J. Hu, and S.Y. Chou, Optics Express19(5), 3925–3936 (2011).
- Y. Liu, B. Ye, C. Wan, Y. Hao, Y. Lan, and A. Ouyang, Transactions of the ASABE56(3), 1043–1049 (2013).
- L. Zhang, Appl. Surf. Sci.270, 292–294 (2013).
- Y. Pan, X. Guo, J. Zhu, X. Wang, H. Zhang, Y. Kang, T. Wu, and Y. Du, Microchim. Acta182, 1775–1782 (2015).
- P.C. Lee and D. Meisel, The Journal of Physical Chemistry86(17), 3391–3395 (1982).
- K. Kim, J.-Y. Choi, H. B. Lee, and K. S. Shin, The Journal of Chemical Physics135, 124705(1-9) (2011).
- K. Kim, H. B. Lee, and K. S. Shin, Spectrochim. Acta, Part A100, 10–14 (2013).
- E. Le Ru and P. Etchegoin, Principles of Surface Enhanced Raman Spectroscopy and Related Plasmonic Effects, 1st Edition (Elsevier, Amsterdam, The Netherlands, 2009).
- M. Moskovits, J. Raman Spectrosc. 36, 485–496 (2005).
- C.E. Talley, J.B. Jackson, C. Oubre, N.K. Grady, C.W. Hollars, S.M. Lane, T.R. Huser, P. Nordlander, and N.J. Halas, Nano Letters5(8), 1569–1574 (2005).
- K. Kim, D. Shin, H. B. Lee, and K. S. Shin, Chem. Commun.47, 2020–2022 (2011).
- D. Lin-Vien, N.B. Colthup, W.G. Fateley, and J.G. Grasselli, The Handbook of Infrared and Raman Characteristic Frequencies of Organic Molecules (Academic Press, San Diego, California, 1991).
- L.C. Thomas, Interpretation of the Infrared Spectra of Organophosphorus Compounds (John Wiley and Sons, Mississauga, Ontario, Canada, 1974).
- E.J. Bell Steven and M.S. Sirimuthu Narayana, Chem. Soc. Rev. 37(5), 1012–1024 (2008).
Zhijing Wu is a doctor and lecturer with the College of Mechatronics Engineering at East China Jiaotong University in Nanchang, the People’s Republic of China.
Xianping Wang is a doctor and lecturer with the Department of Physics at Jiangxi Normal University, in the Key Laboratory of Optoelectronic and Telecommunication of Jiangxi Province, in Nanchang,the People’s Republic of China.
Yunheng Wang is an undergraduate student in the College of Mechatronics Engineering at East China Jiao Tong University in Nanchang, the People’s Republic of China.
Jian Wu is a doctor and lecturer with the college of Optoelectric Science and Engineering of National University of Defense Technology in Changsha, Hunan, the People’s Republic of China. Direct correspondence to: peterwuzhijing@163.com


Nanometer-Scale Studies Using Tip Enhanced Raman Spectroscopy
February 8th 2013Volker Deckert, the winner of the 2013 Charles Mann Award, is advancing the use of tip enhanced Raman spectroscopy (TERS) to push the lateral resolution of vibrational spectroscopy well below the Abbe limit, to achieve single-molecule sensitivity. Because the tip can be moved with sub-nanometer precision, structural information with unmatched spatial resolution can be achieved without the need of specific labels.


