A Targeted Approach to Detect Controlled Substances in Suspect Tablets Using Attenuated Total Internal Reflection Fourier-Transform Infrared Spectroscopic Imaging
Attenuated total internal reflection Fourier-transform infrared imaging confirms the presence of drug components in illicit tablets.
Suspect "ecstasy" tablets have been analyzed using attenuated total internal reflection Fourier-transform infrared (ATR-FT-IR) spectroscopic imaging to confirm the presence of several controlled substances that were first identified using liquid chromatography-electrospray ionizaion mass spectrometry (LC-ESI-MS). The ATR-FT-IR method was a targeted approach that involved searching standard FT-IR spectra (of the components already detected by LC-ESI-MS) against each spectrum contained in an ATR-FT-IR image. The method potentially can be used in the future both as an initial screen and as a confirmatory method for other analytical techniques.
Ecstasy tablets have traditionally been associated with the schedule I controlled substances 3,4-methylenedioxymethamphetamine (MDMA) and 3,4-methylenedioxyamphetamine (MDA). However, recent seizures have involved "ecstasy mimic" tablets that contain a host of other controlled substances, active pharmaceutical ingredients (APIs) and inert materials (excipients). To be more specific, approximately 15 different cases involving ecstasy mimic tablets were listed in the December 2009 edition of the Drug Enforcement Administration's Microgram Bulletin (1). Consequently, a screening procedure that can detect multiple controlled substances (not just MDMA and MDA) and other drug components is often required when these tablets are encountered.
The United States Food and Drug Administration's (FDA) Forensic Chemistry Center (FCC) has historically implemented screening procedures for these types of samples using gas chromatography with mass spectrometry detection (GC–MS) or liquid chromatography–electrospray ionization mass spectrometry (LC–ESI-MS) (or both). Although the chromatographic screening procedures are extremely versatile for detecting APIs, toxins and controlled substances, there are several limitations to these techniques. First, the sample must be dissolved and cannot be examined in its solid state. Second, the methods are primarily used for the detection of APIs and controlled substances in a given tablet and are not typically used for the identification of excipients. Even though excipients are, by their nature, inert, adverse reactions to these materials have been documented (2–4). Further, confidence in linking two or more tablets to a common source increases as the points of comparison increase, which is why it is important to develop information on as many components as possible within a given formulation.
Demand is increasing for analytical techniques that complement MS-based screening methods. Fourier-transform infrared (FT-IR) spectroscopy is one such technique because it does not require the sample to be dissolved and because it is highly selective toward most APIs and excipients. An added benefit of this method includes the ability to detect subtle crystallinity differences. FT-IR spectroscopy has been employed for both macroscopic (nonimaging) attenuated total internal reflection (ATR)-FT-IR spectroscopy (5,6) and microscopic ATR-FT-IR imaging applications (7). Recently, Lanzarotta and colleagues (8) compared the performance of macroscopic ATR and micro ATR imaging for the detection and characterization of counterfeit pharmaceutical tablets. They concluded that the micro ATR-FT-IR imaging method was more effective for characterizing counterfeit tablets due to several limitations of the macro ATR-FT-IR method. First, the ability of the macro ATR-FT-IR method to detect small amounts of material is compromised by the need to blend the sample, which is often performed to provide representative sampling. Second, the technique often requires spectral subtractions to determine the composition of multicomponent samples. The subtraction process can only be effective until spectral artifacts dominate the spectrum, which can make comparison to a standard difficult using the macro technique. They employed micro ATR-FT-IR imaging to overcome some of these characteristic limitations. First, the particle sizes are larger than the detector sizes (high pixel resolution), which provides a better chance of finding low concentration components. Second, the spectra are often characteristic of nearly pure compounds, which increases the confidence in the identification of unknown materials (8). This spectral purity was achieved by sampling the tablets in such a way that would allow the individual component particles to remain spatially isolated; the tablets were embedded in an epoxy mold and cross-sectioned with a microtome. Despite these advantages, a major sampling limitation is introduced when this embedding–microtome approach is employed. For example, Lanzarotta and colleagues reported that the sample mass–to-tablet mass ratio can be in the part-per-billion range. Although this limitation was shown to be of little significance for well blended tablets, it may be extremely problematic for poorly manufactured tablets, such as street drugs. To provide more representative sampling for these types of samples, the tablets can be ground or blended. However, grinding and blending the tablets may decrease the selectivity of the ATR-FT-IR imaging technique because the individual component particles may blend together.
The objective of the current study was to determine if suitable ATR-FT-IR imaging results can be generated on blended tablets and demonstrate the potential for using the ATR-FT-IR imaging technique as a supplemental tool to other tablet screening methods such as LC–ESI-MS.
Experimental
Materials and Solvents: The syringe filters used were 25-mm PTFE, 0.2-μm pore size (National Scientific, part of Thermo Fisher Scientific, Rockwood, Tennessee), or equivalent. The solvents used were HPLC-grade acetonitrile and HPLC-grade water with 0.1% formic acid (Fisher Scientific, part of Thermo Fisher Scientific, Pittsburgh, Pennsylvania). The microcrystalline cellulose reference standard was obtained from FMC Corporation (Philadelphia, Pennsylvania) and reference standards of 1-benzylpiperazine dihydrochloride (BZP di-HCl), methylenedioxymethamphetamine hydrochloride (MDMA HCl), caffeine and procaine hydrochloride were obtained from Sigma-Aldrich (St. Louis, Missouri).
Sample Preparation: One tablet was ground with a mortar and pestle. For the LC–ESI-MS analysis, approximately one-tenth of the mass of a dosage unit was weighed and transferred to a glass scintillation vial. The sample was extracted using 10 mL of 50:50 acetonitrile–water. A portion of the extract was filtered and further diluted 1:10 with acetonitrile before analysis. For the ATR-FT-IR imaging analysis, a small amount (~50 mg) of the ground composite was compacted into a pellet (twice pressed at 10,000 psi) using a Carver Two Post manual hydraulic press (Carver Inc., Wabash, Indiana) and a Specac 13-mm die (Specac Ltd, Slough, United Kingdom). The cylinder from the die, which contained the pellet on its surface, was placed underneath the ATR accessory on the microscope stage. The accessory was then lowered to allow the internal reflection element (IRE) to make contact with the sample.
Instrumentation: LC–ESI-MS analysis was performed using a Finnigan LCQ Deca XP Plus Ion-Trap mass spectrometer (Thermo Fisher Scientific, Waltham, Massachusetts) coupled to an Agilent 1100 Series capillary high performance liquid chromatography (HPLC) system (Santa Clara, California). Xcaliber Version 1.3 software (Thermo Fisher Scientific) was used for both data acquisition and processing. The instrument was calibrated according to manufacturer specifications. The instrument was tuned using the manufacturer's calibrant at m/z 524 in the positive ion mode. A Phenomenex Luna Phenyl Hexyl (150 mm × 2.1 mm, 3.0-μm dp) analytical column (Torrance, California) was employed. The mobile phase was an acetonitrile–water (with 0.1% [v/v] formic acid) gradient with a flow rate of 0.2 mL/min. Gradient method: 0–15 min linear 5–95% acetonitrile, 15–25 min isocratic 95% acetonitrile; postrun equilibration time: 6 min.
ATR-FT-IR images were collected on a PerkinElmer Spotlight 400 imaging system (Waltham, Massachusetts) outfitted with a germanium hemisphere ATR imaging accessory (400 μm × 400 μm image area, 1.56 μm × 1.56 μm pixel size, 1 scan per data point, 16-cm-1 spectral resolution, and 13.3-min collection time). The imaging data were processed with Spectrum Image-Spotlight software version 400 R1.6.4.0394 (PerkinElmer). With the exception of 1-(3-trifluoromethylphenyl)piperazine (TFMPP), all standard spectra were collected on a PerkinElmer Spectrum 100 main bench FT-IR spectrometer outfitted with a Universal Diamond ATR accessory (32 scans, 16-cm-1 spectral resolution). The TFMPP standard spectrum was provided to the FCC by the Drug Enforcement Administration's North Central Laboratory (Chicago, Illinois), which was collected on a Nicolet 6700 main bench FT-IR spectrometer (Thermo Fisher Scientific) outfitted with a Smart DuraScope (SensIR Technologies, Danbury, Connecticut) diamond ATR accessory (16 scans, 4-cm-1 spectral resolution).
Results and Discussion
LC–ESI-MS: The LC–ESI-MS chromatogram can be viewed in Figure 1. The product ion spectra of [M+H]+ for each of the four components detected are provided in Figure 2 and demonstrate the presence of MDMA, procaine, TFMPP, and benzylpiperazine (BZP) in the tablet. The results of the LC–ESI-MS analysis have been provided in Table I.


Figure 1: Separation of BZP (peak A), procaine (peak B), MDMA (peak C), and TFMPP (peak D).
ATR-FT-IR Imaging: ATR-FT-IR total absorbance images were collected in triplicate on the pressed pellets to ensure reproducibility; the same components were detected in each replicate. After an image was collected, a principal component analysis (PCA) was performed using the Spectrum Image-Spotlight software, which assigned a similar color to pixels with similar scores on the first three principal components. This procedure helped highlight major components in the image and was only used to provide an initial assessment of the tablet composition. A representative PCA image has been provided in Figure 3a. The red, blue, dark green and bright green areas in the image correspond to caffeine, microcrystalline cellulose, BZP di-HCl, and TFMPP, respectively. The abundance of red in Figure 3a demonstrates that caffeine was present at a relatively large concentration, which was a significant finding because caffeine was not retained under the chromatographic conditions selected for the MS analysis. Single-pixel FT-IR spectra from each of these areas have been provided in Figure 3b along with the corresponding standard spectra. The sample spectra show better sensitivity in the low-wavenumber region, which can be attributed to the longer depth of penetration at these wavelengths (8).


Figure 2: Mass spectra for BZP, procaine, MDMA, and TFMPP.
The agreement between the peak positions in the image spectra and standard spectra was sufficient enough to determine that the suspect tablet was consistent with the presence of caffeine, microcrystalline cellulose, BZP di-HCl, and TFMPP. In several instances, spectral contamination can be observed in the sample spectra. For example, the shoulder at 1694 cm-1 in the BZP di-HCl sample spectrum (indicated with an arrow in Figure 3b), which is not present in the BZP di-HCl standard spectrum, can be attributed to caffeine (C=O stretching vibration). This type of spectral contamination is typically more prevalent when lower-concentration components (BZP di-HCl in this example) are in the presence of more-concentrated components (caffeine in this example). This spectral contamination may also be due to the fact that the sample was ground before analysis. The grinding process may cause components to blend together, which can result in sample spectra that are a combination of two or more components. A more consistent agreement between sample and standard spectra can be achieved if the sample is examined in its native state (not ground or blended) (8). However, significant preparation is required and a much less representative portion of the sample may be interrogated using this approach, which can be especially problematic for either poorly blended tablets or tablets of unknown quality. Despite the reduced spectral purity, the best course of action for this type of sample would therefore be to grind or blend the tablet before analysis.


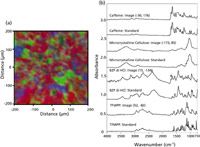
Figure 3: (a) ATR-FT-IR image of the ground and pressed (pellet) suspect tablet core. (b) The caffeine, microcrystalline cellulose, BZP di-HCl, and TFMPP HCl spectra were taken from the red, blue, dark green, and bright green areas in the image, respectively.
The four colors in the image indicated that the PCA analysis was able to separate four unique components. However, due to the fundamental limitations associated with statistical reduction methods, this PCA process can not be relied upon to detect low-concentration components. As a consequence, additional data interpretation measures are often needed to completely determine the composition of an unknown tablet. Although data analysis methods such as band ratios can be employed to locate lower concentration components for targeted applications, these techniques can be tedious and time-consuming. A more simplistic method involves implementing a library searching approach. Instead of using spectral libraries in a traditional fashion where an unknown spectrum is searched against known spectral libraries, a backwards searching technique can be applied. For example, in the case of procaine and MDMA, a standard spectrum of each compound (procaine HCl and MDMA HCl) was searched (between 4000 and 750 cm-1) against the 65,536 spectra (400 μm × 400 μm image divided by 1.56 μm × 1.56 μm spatial elements corresponded to 256 × 256 pixels) in the image. The correlation images using the procaine HCl and MDMA HCl standard spectra have been provided in Figures 4a and 4b, respectively. The brighter areas represent a higher correlation to the corresponding standard. A spectrum from the bright region at (–79, 199) in Figure 4a (top edge) and a spectrum from the bright region at (–66, –130) in Figure 4b has been provided in Figure 4c. Each sample spectrum can be viewed along with the corresponding standard spectrum.

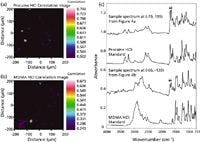
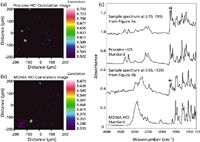
Figure 4: Correlation images were created by searching a standard spectrum of (a) procaine HCl and (b) MDMA HCl against the suspect tablet image. (c) Sample spectra taken from the images can be viewed along with standard spectra.
Just as with the BZP di-HCl sample spectrum, spectral contamination from caffeine can be expected in the sample spectra from Figures 4a and Fig. 4b (indicated with arrows in Figure 4c) because the relative concentrations of these components are low (see Figure 1). Despite this contamination from caffeine, the sample spectrum from Figure 4a corresponds well with the procaine HCl standard spectrum. On the other hand, the sample spectrum from Figure 4b contains additional spectral differences with respect to the MDMA HCl standard spectrum. In addition to the spectral differences between 3100 and 2400 cm-1, the primary amine HCl salt peak, which can be seen in the standard spectrum at approximately 2040 cm-1, is absent in the sample spectrum. Spectral differences in these regions have been related to polymorphic differences between isomeric MDMA hydrochloride salts by Bailey, Legault, and Verner (9–11) and related to a different salt form of the drug (that is, MDMA phosphate) by Chappell (12) and later by Cheng and colleagues (13). Without a standard spectrum for comparison, it could not be determined if these spectral differences were due to a different polymorph or a different salt form of the drug. As a result, it could only be concluded that an MDMA salt was detected in the suspect tablet. The results of the ATR-FT-IR imaging analysis have been provided in Table I.


Table I: Components detected using the LCâESI-MS and ATR-FT-IR imaging techniques
Advantages: This analysis demonstrates the benefits of using ATR-FT-IR imaging as a complementary, confirmatory technique for a more well-established LC–ESI-MS screening method. The results of this study do not indicate that this technique is suitable for replacing current routine methods. Instead, the results demonstrate that ATR-FT-IR imaging can be used in conjunction with routine methods to confirm the presence of drug components and to provide additional information about a given sample. For example, the ATR-FT-IR imaging approach not only confirmed the presence of MDMA, procaine, TFMPP, and BZP, but also determined that MDMA, procaine, and BZP were present as the salt form of each drug. Further, two additional components were detected by the ATR-FT-IR imaging technique that were not observed under the conditions used for the LC–ESI-MS analysis — one major component (caffeine) and one minor component (microcrystalline cellulose). Based on these results, it can be concluded that the composition of a suspect sample can be more completely and accurately characterized using ATR-FT-IR imaging.
Limitations: To allow reasonable acquisition times (minutes vs. hours), a decreased spectral resolution and number of scans are often employed (16 cm-1 vs. 4 cm-1 resolution and one scan vs. 32 scans or more). The decreased resolution and signal-to-noise ratio (S/N) may hinder the effectiveness of this technique when attempting to differentiate similarly structured molecules such as analogues or polymorphs. When the results from the fast high resolution–low S/N image are insufficient, the data can at least be used to provide a preliminary assessment of the sample. At this point more selective and time-consuming analyses can be tailored to the detection and quantitation of those components that were thought to be present according to the initial ATR-FT-IR screen. Such analyses may include acquiring a high resolution–high S/N image of the same sample or employing chromatographic or selective solvent extraction schemes specific to the targeted compounds. In this example, the detection of caffeine by the ATR-FT-IR imaging technique may direct analysts to quantitate the level of caffeine using another method.
The detection limit of LC–ESI-MS is generally lower than that of ATR-FT-IR imaging and, as a consequence, trace-level components detected by LC–ESI-MS methods may not be detected by the ATR-FT-IR imaging approach. The results of the current study have demonstrated the use of this technique only for targeted applications, where a component can usually be detected much more easily compared to nontargeted applications. Although the presence of TFMPP and BZP di-HCl would have been easily detected regardless of whether the analysis was targeted or nontargeted, MDMA HCl and procaine HCl were readily detected only because LC–ESI-MS provided this information.
If the sample detailed in this study had been received as a complete unknown and ATR-FT-IR imaging was used as the initial screening technique (nontargeted detection), the MDMA HCl and procaine HCl could still be detected several different ways. First, the analyst could manually examine each of the 65,536 pixels for unique spectral signatures, at which point MDMA HCl and procaine HCl eventually would have been detected. However, this process can be extremely tedious and prohibitively time-consuming for most applications. Second, advanced chemometric methods could be employed such as those described by Marcott and colleagues (14), where outlier pixels in the PCA score plots were used to determine the presence of low concentration components within a given image. Another more novel method to reduce the time associated with this type of analysis scheme would be to customize an automated spectral searching algorithm. In this approach, a queue of several targeted components such as common APIs, controlled substances, and excipients, could each be sequentially searched against the 65,536 spectra within an unknown image. A preliminary report could then be automatically generated and the analyst could later comprehensively examine the data to determine which of the targeted compounds were actually detected in the image. The results of this approach, of course, would still be limited to the detection of only the targeted components listed in the queue.
Conclusions
Advantages and limitations have been presented for using ATR-FT-IR imaging as a complementary technique to LC–ESI-MS for the analysis of substances in illicit tablets. The ATR-FT-IR imaging method confirmed the presence of four components that were already detected using an LC–ESI-MS screen and determined that each was present as the salt form of the drug. Further, two additional components were detected, which proved that the ATR-FT-IR imaging technique can be extremely useful for fully characterizing a tablet formulation.
Acknowledgments
The authors would like to thank Fred Fricke, director of the FCC, Dr. Duane Satzger, director of the Organic Branch at the FCC, and Dr. Douglas Heitkemper, director of the Inorganic Branch at the FCC.
Adam Lanzarotta is an Interdisciplinary Scientist, Trace Examination Section, Samuel Gratz is a Supervisory Interdisciplinary Scientist, Separations Section II, Thomas Brueggemeyer is a Supervisory Interdisciplinary Scientist, Separations, Spectroscopy & Molecular Biology Section, and Mark Witkowski is a Supervisory Interdisciplinary Scientist, Trace Examination Section, all with the United States Food and Drug Administration, Forensic Chemistry Center, Cincinnati, Ohio. Direct correspondence to Adam.Lanzarotta@fda.hhs.gov.
References
(1) MicrogramBulletin 42, 89–102 (2009).
(2) J.M. Smith and T.R.P. Dodd, Adverse Drug React Acute Poisoning Rev. 1, 93–142 (1982).
(3) I.R. Edwards and J.K. Aronson, The Lancet 356, 1255–1259 (2000).
(4) S. Pawar and A. Kumar, Pediatric Drugs 6, 371–379 (2002).
(5) N.J. Harrick, Phys. Rev. Lett. 4, 224–226 (1960).
(6) J. Fahrenfort, Spectrochimica Acta 17, 698–709 (1961).
(7) A.J. Sommer, L.G. Tisinger, C. Marcott, and G.M. Story, Appl. Spectrosc. 55, 252–256 (2001).
(8) A. Lanzarotta, Ph.D. Thesis Chapter 6 [Online], Miami University, Oxford, OH, May 2010. http://etd.ohiolink.edu/view.cgi?acc_num=miami1272740376.
(9) K. Bailey, D. Legault, and D. Verner, Journal of the Association of Official Analytical Chemists 57, 70–78 (1974).
(10) K. Bailey, D. Legault, and D. Verner, Journal of the Association of Official Analytical Chemists 57, 1134–1143 (1974).
(11) K. Bailey, D. Legault, and D. Verner, Journal of the Association of Official Analytical Chemists 58, 62–69 (1975).
(12) J.S. Chappell and M. Lee, Microgram Journal 32(4), 143 (1999).
(13) W. Cheng, N. Poon, and M. Chan, J. Forensic Sci. 48, 1–11 (2003).
(14) C. Marcott, G.M. Story, A.E. Dowrey, J.T. Grothaus, D.C. Oertel, I. Noda, E. Margalith, and L. Nguyen, Appl. Spectrosc. 63, 346A–354A (2009).


Measurement of Ammonia Leakage by TDLAS in Mid-Infrared Combined with an EMD-SG Filter Method
April 9th 2024In this article, tunable diode laser absorption spectroscopy (TDLAS) is used to measure ammonia leakage, where a new denoising method combining empirical mode decomposition with the Savitzky-Golay smoothing algorithm (EMD-SG) is proposed to improve the signal-to-noise ratio (SNR) of absorbance signals.


