Toward Quantitative Imaging Mass Spectrometry
Special Issues
The main limitations of quantification using MALDI imaging are discussed and the different approaches used for quantitative measurement in MSI are evaluated.
Mass spectrometry imaging (MSI) is a common technique to detect the localization of molecules (drugs and their metabolites, peptides, proteins, and lipids) directly on the surface of biological tissues without labeling. Today, several ionization modes are used to perform MSI experiments, such as desorption electrospray ionization (DESI), secondary ion mass spectrometry (SIMS), laser ablation electrospray ionization (LAESI), and the most commonly used matrix-assisted laser desorption–ionization (MALDI). In this report, we describe the main limitations of quantification using MALDI imaging and evaluate the different approaches applied for quantitative measurement in MSI.
The combination of quantitative and distribution data in the same experiment provides valuable and precise information about the behavior of a compound in the organism (for example, pharmacokinetics, toxicity, or efficiency). Traditionally, this type of experiment is performed using quantitative whole-body autoradiography (QWBA), magnetic resonance imaging (MRI), positron emission tomography (PET), or liquid chromatography coupled with mass spectrometry (LC–MS) after organ dissection. However these techniques require some extensive and time-consuming preparation. Mass spectrometry imaging (MSI) has therefore been introduced to address these issues, enabling the label-free study of several compounds of interest simultaneously on the same tissue section.
First introduced by Caprioli in 1997 (1), MSI has undergone an evolution during the past decade to reach the same level as "traditional" imaging techniques. Advances in technology and methods have led to increased robustness, sensitivity, lateral resolution, and class of compounds detected through this technique. Today, several ionization modes are used to perform MSI experiments, such as desorption electrospray ionization (DESI), secondary ion mass spectrometry (SIMS), laser ablation electrospray ionization (LAESI), and matrix-assisted laser desorption–ionization (MALDI), which is the most commonly used mode. MSI offers several advantages (such as specificity and lateral resolution) compared to other techniques, but it does not provide robust quantitative information within molecular distribution studies yet. Recently, numerous studies have dealt with the growing interest in combining quantitative and distribution analyses using MSI, particularly with applications for evaluating small molecule local concentration in early pharmaceutical discovery. Despite this, the difficulty in obtaining an absolute quantification of experimental data remains one of MSIs major limitations. As mentioned by Stoeckli and colleagues in 2007 (2), quantification by MSI using the MALDI technique requires consideration of several fundamental aspects. First, the tissue-specific ion suppression is dependent on the surrounding environment and interactions taking place in the biological sample. Secondly, a molecule has a specific ionization yield in MALDI. Finally, the detected signal is highly dependent on the matrix deposition, its properties, and extraction capacity. Several methods addressing these issues are described in literature (3–9), but none have universal applications. The three types of approaches in quantitative MSI are depicted in Figure 1.


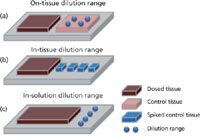
Figure 1: An overview of the three different approaches used to provide quantitative information using mass spectrometry imaging (MSI).
These include the use of a dilution range deposit on a control tissue section, a dilution range mixed with targeted tissue and then reconstituted to obtain a matrix matched material, and additional information about ion suppression in tissue and an in-solution dilution range. This short review will focus on the new development of quantitative MSI, specifically for the MALDI imaging technique.
Sample Preparation
Carrying out quality sample preparation that is both reproducible and robust represents a key challenge in MSI analyses (10). First, the tissue of interest, which can be a single organ, a tissue biopsy, or an entire animal, is collected and conditioned. In quantitative experiments, biological sample replicates must be used to compare MSI results to other techniques (QWBA or LC–MS). Second, the tissue is sectioned and mounted onto a conductive slide. The tissue is prepared using a cryomicrotome operating at a temperature between -20 °C and -25 °C, depending on the sample. The thickness of the section is adapted to the sample type or size: For example, a thickness of 20 µm is suitable for whole-body studies, whereas 10 µm is the optimal single-organ section thickness. Next, the tissue section is mounted on an indium tin oxide (ITO)–coated glass slide or steel target plate, while verifying the flatness of the section. A pretreatment of the tissue sample can be performed to improve chemical information, to provide an increase in signal intensity or decrease in ion suppression effect, especially for peptides and proteins (11). Salt or lipids can be removed by washing with an optimized solvent composition. The last preparation step is one of the most critical in MALDI imaging experiments: the matrix deposition on sample.
The quality of MS images is highly dependent on the matrix application. Aspects such as homogeneity and reproducibility of applied matrix layer, optimal molecule extraction through tissue section, wetting, and speed, are important factors to take into account for quantitative analysis. In recent years, this approach has evolved from the manual sprayer device to laboratory-built (12) or commercial automatic depositions systems. In our molecular imaging department, we compared the reproducibility of an automatic (SunCollect) and a manual thin layer chromatography (TLC) matrix sprayer. A drug standard (propranolol) at known concentration (10 pmol/µL) mixed with matrix solution (2,5-dihydroxybenzoic acid [DHB] at 40 mg/mL) was used to cover tissue sections (10-µm-thick rat liver tissue) mounted onto an ITO glass slide. Optical images of each matrix layer obtained by microscope are shown in Figure 2a and 2b. The matrix crystal size appears significantly smaller (less than 40 µm) when an automatic sprayer is used. Then, an MSI experiment was performed and the distribution of the standard molecule was visualized for the two matrix deposition methods (Figure 2c and 2d). The distribution of the standard ion appears more homogeneous with the automatic sprayer, which is confirmed by a relative intertissue standard deviation of signal intensity calculated at 3% compared to the manual device at 30%. The signal intensity of this ion is also stronger on tissue using the automatic system. The automatic sprayer device enables a high degree of matrix deposition reproducibly and homogeneity in accordance with quantitative experiment requirements.

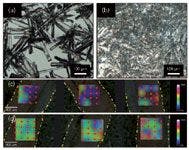
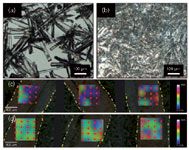
Figure 2: Optical image of 2,5-dihydroxybenzoic acid matrix layer on glass slide deposited with (a) a manual TLC sprayer and (b) an automatic sprayer. MS image (200 µm of spatial resolution) of the distribution of propranolol (m/z 260.16) mixed with matrix on tissue deposited with (c) a manual TLC sprayer and (d) an automatic sprayer. Dashed yellow lines indicate outline of tissues on the slide.
Matrix Matched Standard
MSI quantitation requires a suitable dilution series. The dilution series must accurately represent the signal obtained from the sample while taking into account the tissue suppression effect that is specific to MSI. The quantitative possibility of whole-body autoradiography was justified by Schweitzer and colleagues in 1987 (13) by generating a calibration curve from a dilution series of labeled target molecule in blood for QWBA. Since then, numerous quantitative MSI experiments have applied this strategy of "matrix matched standard."
The first example of this approach was established by Nilsson and colleagues (7) in 2010 and corresponds to the method in Figure 1a. The aim of this study was to assess the concentration of an inhaled reference compound, tiotropium, within the lungs of dosed rats. A dilution series of the analyte was deposited on top of the tissue section and a calibration curve was then obtained (Figure 3). Dosed and spotted control tissues were simultaneously imaged in MS and MS-MS modes. Three regions of interest corresponding to high, medium, and low intensity areas are outlined. The average values of each region of interest (ROI) are matched with the calibration curve. The amount of drug evaluated by MS and MS-MS analyses correlated very well with LC–MS quantification data, which demonstrated the robustness of the method. Another approach was reported by Koeniger and colleagues in 2011 (6). In this method, a dilution series was created from a range of rat liver dosed with increasing amounts of a drug (olanzapine from 0–100 mg/kg). Serial sections of dosed tissue divided into two groups were analyzed in parallel using MSI and LC–MS. A proportional response was observed between LC–MS and MSI over two orders of magnitude, which proves the complementarity of the two techniques for quantification.

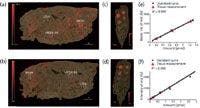
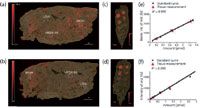
Figure 3: On-tissue dilution range approach: assessment of drug concentration in lung tissue from rats dosed with tiotropium (a, b) by comparison to drug standard samples (from 20 fmol/µL to 10 pmol/µL) spotted on control tissue (c, d) in MS (top) and MS-MS mode (bottom) and related calibration curves (e, f) with a linearity over two orders of magnitude. Adapted from reference 7.
The second method used for quantification using MSI involves the generation of a dilution series directly inside a tissue (Figure 1b). Tissue homogenates are created to mimic the behavior of a compound in a complex environment. Consequently, it takes into account the ion suppression effect specific to the type of tissue. The workflow of the method is reported in Figure 4. Becker and colleagues (14,15) extensively described this methodology to analyze atomic species by laser ablation inductively coupled plasma ionization–mass spectrometry (LA-ICP-MS) imaging. A dilution series of the analyte was mixed with tissue homogenate from different origins (slugs [14] and rat brain [15]), reconstituted by fast freezing, sectioned, mounted next to the corresponding dosed tissue, and finally, analyzed by MSI. Signal intensities from the dilution series were then correlated to dosed signal data to obtain a relative concentration of the atomic species. This matrix matched standard strategy demonstrated promising results in quantification by MSI.

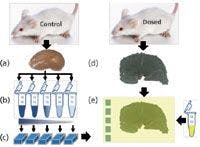
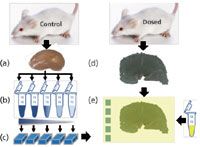
Figure 4: Quantification process by mass spectrometry imaging using in-tissue dilution range approach: (a) Kidney is removed from biological sample and then ground; (b) dilution series of standard are spiked in tissue homogenates; (c) matrix matched tissues are reconstituted by fast frozen and sectioned; (d) dosed kidney is sectioned and mounted on a slide; (e) matrix solution is deposited on dosed and matrix matched standard sections before MS imaging experiment.
To further develop this approach, we used MALDI imaging for analysis. In this method, drug mixed into tissue homogenate must be spread homogeneously throughout the entire mixture, especially after the fast frozen phase, to be reproducible. MALDI imaging of transversal and longitudinal cross sections were carried out to follow the distribution of spiked drug in the tissue. An adequate homogeneity was observed with an intertissue mean signal variation of 15%. This strategy is well-adapted to a homogenous single organ drug distribution study as it is adapted to a specific tissue type. However, generating a matrix standard for each organ or tissue in a whole body tissue section containing more than 20 heterogeneous histological areas (for example, the eye or brain), remains time consuming and requires a large number of tissues.
Ion Suppression Effect
The main limitation in MALDI imaging is the high dependence of the MS signal on the chemical and biological environment, also known as the ion suppression effect. Unlike an isolated drug in a solution deposit on a steel target, a molecule trapped in a tissue undergoes many noncovalent interactions, both strong and weak (such as, hydrogen or van der Waals bindings). Molecules also experience the ionization competition phenomenon linked to other compounds present in its immediate environment that have higher ionization yield (2). An MSI comparison of analyte response on a whole body section might be significantly different if tissue and analyte suppression effects are not evaluated. Several papers report the use of an internal standard to address this issue (9–16). In these studies, a labeled version of the analyte (9) or an analog compound (16) is deposited on a dosed tissue section. The normalization of the analyte signal also can be performed, therefore reducing the specific ion suppression caused by the heterogeneity of the target tissue (for example, lung biopsy or brain section).
We developed a new method for quantitation by MSI based on the specificity of ion suppression effect that does not require a labeled version or an analog of the target compound. Figure 5 depicts the global workflow of our method and corresponds to the third approach in Figure 1c. The first step (Figure 5a) involves the determination of the tissue extinction coefficient (TEC). A control section is covered homogenously by a mixture of target molecule (in blue) at a known concentration and the matrix solution (in yellow). MSI is then performed on the tissue section and support. ROIs are selected on each type of organ or tissue (T1, T2, and T3 in Figure 5) and on support corresponding to the reference area. This allows calculation of TEC values for each type of tissue (more than 20 in a whole-body) and mass filter (signal corresponding to standard mixed with matrix) by dividing the signal of standard on tissue region by the same signal on the reference area. Secondly, a dilution series of target compound is spotted near the dosed tissue section (Figure 5b) and matrix solution is deposited on the entire sample (Figure 5c). From this dilution series of target molecule analyzed by MSI, mean intensity values can be extracted and correlated to the amount of drug per surface unit. The best calibration curve model, a mathematical equation and a correlation coefficient are also defined. Finally, a molecular image of dosed tissue is used to estimate the amount of drug in gram per gram of tissue. The spectral values of the drug related to a specific organ are normalized by the corresponding TEC value then inserted into the calibration equation for quantification taking into account the mass of the tissue and molecular weight of the compounds.

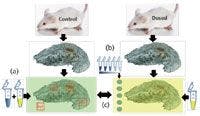
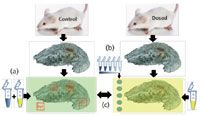
Figure 5: Quantification process by MSI using the tissue extinction coefficient (TEC) approach.
This approach had been applied in several studies and has produced promising results, particularly in whole body drug distribution studies. For example, propranolol was quantified in whole body sections of dosed mice using our approach (18) and then was compared to QWBA results (17). A strong correlation (standard deviation inferior to 10%) was observed between quantitative MSI (qMSI) and QWBA results for different organs as shown in Table I.

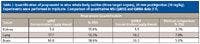
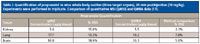
Table I: Quantification of propranolol in mice whole body section (three target organs), 20 min postinjection (10 mg/kg). Experiments were performed in triplicate. Comparison of quantitative MSI (qMSI) and QWBA data (17).
Conclusion
In this review, we discussed the recent advances in quantification by MSI and also all of the parameters to consider when carrying out robust experiments, especially in sample preparation. Many strategies have been, and continue to be, tested in order to the address limitations in qMSI. MSI experiments also generate large sets of data, which in turn involves significant data treatment and signal normalization. For this reason, suitable software must be developed to interpret complex imaging data produced by quantification experiments. In the coming years, more applications will be developed for qMSI, especially in the discovery and development of new drugs. Continued qMSI instrument and method development will be integrated into preclinical and clinical research to accelerate distribution and quantification studies.
Gregory Hamm, PhD, is a research engineer, David Bonnel, PhD, is a project manager, Christine Michel is an account executive, Raphael Legouffe is a study engineer, Fabien Pamelard is an IT manager, Guillaume Hochart is a study engineer, and Jonathan Stauber, PhD, is CEO and CSO. They are all with the MALDI imaging service department at ImaBiotech, in Parc Eurasanté, Loos, France. Please direct correspondence to: hamm.gregory@imabiotech.com.
References
(1) R.M. Caprioli, T.B. Farmer, and J. Gile, Anal. Chem. 23, 4751–4760 (1997).
(2) M. Stoeckli, D. Staab, and A. Schweitzer, Int. J. Mass Spectrom. 2–3, 195–202 (2007).
(3) R.J.A. Goodwin, C.L. Mackay, A. Nilsson, D.J. Harrison, L. Farde, P.E. Andren, and S.L. Iverson, Anal. Chem. 24, 9694–9701 (2011).
(4) M.L. Reyzer, Y. Hsieh, K. Ng, W.A. Korfmacher, and R.M. Caprioli, J. Mass Spectrom.10, 1081–1092 (2003).
(5) J. Bunch, M.R. Clench, and D.S. Richards, Rapid Commun. Mass Spectrom. 24, 3051–3060 (2004).
(6) S.L. Koeniger, N. Talaty, Y. Luo, D. Ready, M. Voorbach, T. Seifert, S. Cepa, J.A. Fagerland, J. Bouska, W. Buck, R.W. Johnson, and S. Spanton, Rapid Commun. Mass Spectrom. 4, 503–510 (2011).
(7) A. Nilsson, T.E. Fehniger, L. Gustavsson, M. Andersson, K. Kenne, G. Marko-Varga, and P.E. Andren, PLoS One 7, e11411 (2010).
(8) L. Signor, E. Varesio, R.F. Staack, V. Starke, W.F. Richter, and G. Hopfgartner, J. Mass Spectrom. 7, 900–909 (2007).
(9) E.J. Clemis, D.S. Smith, A.G. Camenzind, R.M. Danell, and C.H. Borchers, Anal. Chem. (2012).
(10) R.M.A. Heeren, B. Kükrer-Kaletas, I.M. Taban, L. MacAleese, and L.A. McDonnell, Appl. Surf. Sci. 4, 1289–1297 (2008).
(11) R. Lemaire, M. Wisztorski, A. Desmons, J.C. Tabet, R. Day, M. Salzet, and I. Fournier, Anal. Chem. 20, 7145–7153 (2006).
(12) D.L. Baluya, T.J. Garrett, and R.A. Yost, Anal. Chem. 79, 6862–6867 (2007).
(13) A. Schweitzer, A. Fahr, and W. Niederberger, Inter. J. of Radiat. App.Instru. 5, 329–333 (1987).
(14) J.S. Becker, A. Matusch, C. Depboylu, J. Dobrowolska, and M.V. Zoriy, Anal. Chem. 79, 6074–6080 (2007).
(15) J.S. Becker, M.V. Zoriy, C. Pickhardt, N. Palomero-Gallagher, and K. Zilles, Anal. Chem. 10, 3208–3216 (2005).
(16) B. Prideaux, V. Dartois, D. Staab, D.M. Weiner, A. Goh, L.E. Via, C.E. Barry III, and M. Stoeckli, Anal. Chem. 83, 2112–2118 (2011).
(17) V. Kertesz, G.J. Van Berkel, M. Vavrek, K.A. Koeplinger, B.B. Schneider, and T.R. Covey, Anal. Chem. 13, 5168–5177 (2008).
(18) G. Hamm, D. Bonnel, R. Legouffe, F. Pamelard, J.-M. Delbos, F. Bouzom, C. Piveteau, N. Willand, B. Déprez, I. Fournier, M. Salzet, and J. Stauber, "Could Mass Spectrometry Imaging be a Drug Quantification Technique?" presented at the 59th ASMS Denver, Colorado (2011).


Synthesizing Synthetic Oligonucleotides: An Interview with the CEO of Oligo Factory
February 6th 2024LCGC and Spectroscopy Editor Patrick Lavery spoke with Oligo Factory CEO Chris Boggess about the company’s recently attained compliance with Good Manufacturing Practice (GMP) International Conference on Harmonisation of Technical Requirements for Registration of Pharmaceuticals for Human Use (ICH) Expert Working Group (Q7) guidance and its distinction from Research Use Only (RUO) and International Organization for Standardization (ISO) 13485 designations.


