Trace Elemental Determination in Residual Fuel Oils Using ICP-MS
The determination of elements in oils and petroleum products is important to refineries, industrial processes, machinery, and transports. This article explores the analysis of fuel oils using ICP-MS for the routine determination of elements at low concentration levels in both clean and dirty fuel oil samples.
The determination of elements in oils and petroleum products is important to refineries, industrial processes, machinery, and transports. The knowledge of elemental levels is required for production (effects on catalysts and corrosion problems), performance (lube oils characteristics), and emission regulations (environmental impact of the combustion processes).
The analytical samples include crude oil, lubricating oils, and fuel oils, to name a few. The elements of importance depend upon product type, source, and use. In crude oils, S, Ni, V, and alkali elements must be measured to characterize oil quality and prevent the poisoning of catalysts during the refining process. In lubricating oils, the analysis of wear metals (for example, Al, Cu, Ni, and Fe) and additives (such as Ca, Mg, P, and Zn) are required to monitor wear levels of any oil-wetted engine parts and check for oil performances. In fuel oils, the important elements are usually Ni, V, Fe, Na, and As, but also Al and Si can be significant; these elements indicate performance during combustion and allow for evaluation of environmental impact.
Fast, accurate, and precise measurements can be a requirement for the petrochemical industry. Several techniques can be utilized to analyze oils and petroleum products, with each one having different performance characteristics. The most commonly used techniques are atomic absorption spectroscopy (AAS, flame, and furnace), inductively coupled plasma–optical emission spectroscopy (ICP-OES and arc/spark), and X-ray fluorescence (XRF) (1–3).
Among these techniques, ICP-OES has the ability to monitor multiple elements simultaneously, provide a wide linear dynamic range, and offer detection limits in the milligram-per-kilogram range. However, the analysis of organic samples by ICP-OES can be difficult. For example, solvent loading of the plasma can change sensitivity or even extinguish the plasma. As a result, the sample introduction system must be properly selected, and spectral background interferences must be evaluated carefully, especially for concentrations close to detection limits. In spite of these possible difficulties, many official methods for oil and fuel analysis use ICP-OES.
In the energy field, residual fuel oils play an interesting role. These oils consist of the remnants after petroleum feedstock distillation. Fuel oils are available in various grades, and their elemental content, including toxic elements, can be significant or very limited. Burning fuel oils for energy production can impact the plant, due to corrosion effects and environmental concerns, because of metals released into the atmosphere. Routine industrial fuel tests usually have detection limits in the milligram-per-kilogram range, which might not be sufficient for a proper fuel oil characterization. ICP-mass spectrometry (MS), compared to ICP-OES, provides better detection limits and much more information, such as isotopic ratios and speciation capabilities (4). For these reasons, laboratories are moving from ICP-OES to ICP-MS, even though the analysis of organic samples can be a little more challenging.
The availability of the cell technology (reaction and collision cells) to ICP-MS has provided improved performance for many matrices, including organics. The cell helps in eliminating or reducing the spectral interference problem, thus allowing improved accuracy and detection limits (5).
This article will report on fuel oils analysis by ICP-MS for the determination of elements at low concentration levels. Fuel oils were analyzed directly for Ni, V, Fe, Na, and As, after a simple dilution in organic solvent.
Analyses were performed by using the ICP-MS in standard and Dynamic Reaction Cell modes (Dynamic Reaction Cell, PerkinElmer, Waltham, Massachsuetts) to evaluate possible spectral interferences. The same samples were also analyzed by ICP-OES as a comparison technique to confirm the results.
Experimental
Reagents and Sample Preparation: Samples for analysis were diluted in organic solvent due to their high viscosity. Subsamples were taken after heating at 70 °C and homogenization. A dilution factor of 1:24 (w/v) was selected as a compromise between sample loading and elemental concentrations. The dilution solvent was made of 25% (v/v) xylene (mixed isomers) and 75% (v/v) low odor kerosene (both from Sigma Aldrich, St. Louis, Missouri). This mix was selected to improve fuel oil dissolution, as it is sometimes difficult to dissolve in kerosene. Another advantage of the xylene–kerosene mix is a lower rinsing time between samples: since fuel oils can contain many fine particulates that can stick to the sample introduction system, xylene has better rinsing capabilities than kerosene.
Standards at 25, 100, and 200 µg/L (As at 25, 50, and 100 µg/L) were prepared in the xylene–kerosene mix by serial dilution of multielement standard (S-21, 500 mg/kg in oil, Conostan, Champlain, New York) and As single-element standard (100 mg/kg in oil, Conostan). An internal standard (Co, 5000 mg/kg in oil, Conostan) was added to all solutions to compensate for any possible matrix effect caused by different viscosities or matrix change. Base oil (Conostan) was also added to the blank and standards (4 % [w/v]) to improve viscosity matching between standards and samples.
Instrumental Conditions
Analyses were performed on an ICP-MS instrument (NexION 300D, PerkinElmer, Inc.), equipped with a cooled glass baffled cyclonic spray chamber (PC-3 Peltier, Elemental Scientific Inc. Omaha, Nebraska) and a type-K glass concentric nebulizer (Meinhard Glass Products, Golden, Colorado). To avoid clogging of the sampler and skimmer cones by carbon deposition, a typical problem when running organic solvents on cone-based systems, a small amount of oxygen was added (via a mass flow controller) between the spray chamber and the injector base.

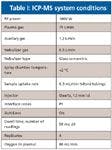
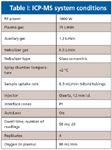
Table I: ICP-MS system conditions
Elements were determined in standard and dynamic reaction cell (DRC) modes. Instrumental parameters used for analysis are reported in Table I, while isotopes and DRC mode cell parameters are reported in Table II.

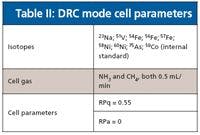
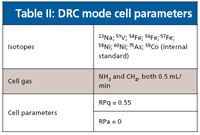
Table II: DRC mode cell parameters
For confirmation of results, samples were also analyzed by an ICP-OES system (Optima 7000 DV, PerkinElmer Inc.) using axial mode (Na was evaluated also in radial mode); conditions and wavelengths are reported in Table III. Sample preparation for ICP-OES was similar to that for ICP-MS, with the exception of a 1:9 (w/v) dilution factor and a calibration range of 50, 100, and 500 µg/L.

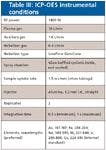
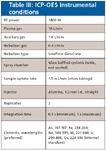
Table III: ICP-OES instrumental conditions
Results and Discussion
Several customer-supplied fuel oil samples were utilized for method development and performance evaluation. The concentrations of the elements to be determined were expected to be ≤1 mg/kg for all elements.
An external calibration with a linear-through-zero equation was used to calibrate the ICP-MS. Calibration curves for all isotopes had correlation coefficients better than 0.999, which is acceptable, taking into account the matrix analyzed and that the working and intermediate standard solutions were prepared in disposable test tubes by using micropipettes.
Oxygen addition between the spray chamber and plasma, required to avoid carbon deposition on the cones, was easy to optimize due to the wide, full-color plasma observation window available on the ICP-MS system (Figure 1): the oxygen flow was increased until the green carbon channel in the center of the plasma disappeared.

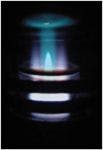
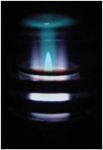
Figure 1: The ICP-MS system full color plasma observation window showing the carbon channel in the center of the plasma before optimizing the oxygen flow.
Results are shown in Tables IV and V. Table IV shows the ICP-MS results for all isotopes measured in all modes. Precision is good, with RSD values in the range of 1–5% at the 10–50 µg/L level. Because no certified reference materials were available to evaluate method performance, multiple isotopes were measured in multiple modes: if the same concentration is measured at multiple isotopes in multiple modes, then there is high confidence that the reported value is correct, as the data in Table IV demonstrate. Although the results indicate that DRC mode is not required for the measurement of the elements in this work, DRC mode will be beneficial for other elements important in petrochemical analyses which suffer from interferences, such as Al, Cr, and Zn (6).

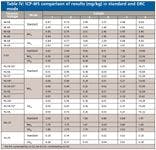
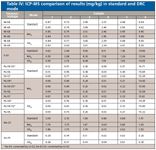
Table IV: ICP-MS comparison of results (mg/kg) in standard and DRC mode
Additional tests were performed to verify the results, including analysis by ICP-OES. Table V displays the results obtained by both ICP-MS and ICP-OES for the samples and shows equivalent concentrations for all the elements. Because both techniques give the same results, there is high confidence that the results are correct. To further test for accuracy, one of the samples was also spiked with 50 µg/L of all elements, except As, which was spiked at a lower level (25 µg/L). The spike recoveries for all elements were 80–120%, indicating accuracy. Precision was demonstrated by analyzing Sample 6 in duplicate; the consistency between results (shown in Table V) indicates reproducibility.

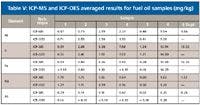
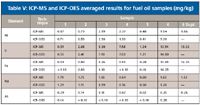
Table V: ICP-MS and ICP-OES averaged results for fuel oil samples (mg/kg)
To check for stability, a calibration check standard (concentration at the midpoint of the calibration curve) and check blank were analyzed throughout the run: right after the calibration standards, halfway through the samples, and at the end of the run. The blank stability was very good, and the check standard recovered between 90–110% each time, thus demonstrating stability.
Finally, detection limits were measured for both ICP-MS and ICP-OES by multiplying the standard deviation of the blank by three. Table VI shows the detection limits and demonstrates that the lower levels can be measured by ICP-MS than ICP-OES.


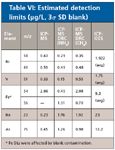
Table VI: Estimated detection limits (µg/L, 3Ï SD blank)
Conclusions
This work demonstrates the ability of ICP-MS to measure low levels of important elements in fuel oil matrices with a simple sample preparation scheme that only requires dilution in a mixed organic solvent. Accuracy has been shown by measurement of multiple isotopes in multiple modes and comparison with results obtained by ICP-OES. Although both ICP-OES and ICP-MS successfully analyzed these samples, the advantage of ICP-MS over ICP-OES is the potential for measuring lower levels, as indicated by the estimated detection limits. Based upon this work, ICP-MS is a promising technique for the low-level measurements of elements in both clean and dirty fuel oil samples.
Riccardo Magarini is with PerkinElmer, Inc., Monza, Italy.
References
(1) D3605-00 Trace Metals in Gas Turbine Fuels by Flame-AAS/AES (direct).
(2) D-5185 Additive Elements, Wear Metals and Contaminants in Used Lubricating oils and Selected Elements in base Oils by ICP-AES (direct).
(3) DIN 51790 Testing of Liquid Fuels - Determination of the V and Ni Content - Part 3 GF-AAS (incineration); Part 4 Flame-AAS (incineration); Part 6 ICP-OES (direct); Part 7 WD-XRF (direct).
(4) ASTM Special Technical Publication 1468, Elemental Analyses of Fuel and Lubricants: Recent Advances and Future Prospects, R.A.K. Nadkarni Ed. (2005).
(5) S.D.Tanner, V.I. Baranov, and D.R. Bandura Spectrochimica Acta: Part B 57, 1361–1452 (2002).
(6) M. Bolchi, R. Magarini, and S. Smith, PerkinElmer Application Note 009159A_01 (2010).
(7) W. Barger, Analysis of Petroleum Products with the ELAN DRC ICP-MS, PerkinElmer FAR 007971_01 (2007).


Inside the Laboratory – The Petrochronology Group at University of California, Santa Barbara
January 29th 2024In this edition of “Inside the Laboratory,” John Cottle, PhD, a professor of geology at the University of California, Santa Barbara, and a member of Spectroscopy’s Editorial Advisory Board, discusses his group’s most recent work using “laser ablation split steam” analysis to measure elemental concentrations and isotopic ratios in rocks and minerals.


