The Use of Portable Near-Infrared Spectroscopy for Authenticating Cardiovascular Medicines
Spectroscopy
Portable NIR spectroscopy is demonstrated as a rapid and mobile analysis method for authenticating cardiovascular medicines in critical situations, and to indicate whether formulations are counterfeit or substandard.
Medicine counterfeiting is a public health threat that contributes to morbidity and mortality worldwide. In cardiovascular disease in particular, counterfeit medicines can lead to unpredicted adverse effects, especially among patients who take multiple medicines to treat multiple conditions. Therefore, a rapid approach for authenticating cardiovascular medicines would be ideal. This work used portable near-infrared (NIR) spectroscopy to authenticate eight different cardiovascular medicines. Thirty-five products of these medicines, purchased from eight different counties worldwide, were tested. NIR spectra were processed using spectral pretreatment combined with correlation in wavelength space (CWS) and principal component analysis (PCA). For the CWS method, an r value of 0.95 was considered to be the threshold. CWS provided a quick answer regarding the authenticity of the test products, showing that five products passed (r values > 0.95) and three failed, possibly indicating that failed products were counterfeit or substandard. The latter results were confirmed by PCA, where clear clusters were distinct between the reference and test products of the three medicines that did not meet the CWA threshold. This study demonstrates that portable NIR spectroscopy potentially offers a quick and mobile method for authenticating cardiovascular medicines that is useful in critical situations.
Medicine counterfeiting represents a global expanding problem that affects all countries worldwide. Counterfeit medicines are those that are deliberately or fraudulently mislabeled in relation to their identity or source (1,2). They may contain no active pharmaceutical ingredient (API), or insufficient amount of API, or the wrong API entirely. On the other hand, substandard medicines are those that fail to match the manufacturer's specification or quality standards. The public health impact resulting from counterfeit or substandard medicines can range from treatment ineffectiveness to lethality (3).
Medicine counterfeiting is not exclusive to a specific class of medicines (4). However, the harmful effects within the class known as lifesaving medicines could be more pronounced, especially among patients with non-communicable diseases (NCDs). NCDs are defined by the World Health Organization (WHO) as long-term diseases that have no permanent cure, but can be controlled by modification of diet and lifestyle factors (5). NCDs include cardiovascular diseases (CVDs), diabetes, respiratory diseases, and cancer. CVDs are diseases associated with the heart or blood vessels, and contribute to morbidity and mortality worldwide (6). According to the WHO, CVDs contribute to 31% of global deaths. Patients with CVDs often have multiple morbidities, and thus take multiple medicines that could result in drug–drug interactions or drug–disease interactions (7).
Subsequently, having the wrong API or the wrong dose in a cardiovascular medicine not only can interfere with treatment effectiveness, but also can cause adverse effects, drug–drug interactions, and drug–disease interactions. Cardiovascular (CV) medicines can be encountered anywhere across the supply chain, including in patients' homes, hospitals, and pharmacies. Therefore, a portable approach that carries the laboratory to the sample would be ideal (8,9), especially where a life-threatening situation is encountered. Portable near- infrared (NIR) spectroscopy offers the advantage of being mobile, rapid, and nondestructive, features that are ideal in medicine authentication (10,11). NIR spectroscopy has a further advantage over other techniques in detecting not only the chemical constituents of a sample, but also the physical properties that are important for spotting a counterfeit or substandard medicine, especially in cases of organized crime, where a medicine of the sample source may be distributed in different countries worldwide (12).
Therefore, this work aimed to evaluate portable NIR spectroscopy for authenticating CV medicines obtained from different countries worldwide. Moreover, the work further assessed the potential of portable NIR spectroscopy for detecting differences in physical properties among authentic products of different manufacturers.
Experimental
A total of 35 individual products of eight different cardiovascular medicines were evaluated in this study (Table I). Reference products were purchased from the UK. Test products were purchased from nine different countries: Australia, Egypt, France, India, Lebanon, Saudi Arabia, Syria, Turkey, and the UK. The medicines were of four pharmacological classes, and of three types of cardiovascular medicines: antiarrhythmic, anticoagulant, and antihypertensive. The pharmacological classes of the medicines were angiotensin converting enzyme inhibitor (n = 2), angiotensin receptor blockers (n = 3), beta blockers (n = 2), and P2Y12 platelet inhibitor (n = 1). Angiotensin converting enzyme inhibitors used were captopril and enalapril. Receptor blockers were losartan, olmesartan, and valsartan. The two beta-blockers used were atenolol and propranolol. The P2Y12 platelet inhibitor used was clopidogrel. The concentration of the API in the measured medicines ranged from 8.4 to 48.4% m/m, where % m/m is percentage mass per mass.


The aforementioned products were tablets, and were measured "as received" from both sides by rotating or flipping the tablet after each measurement using the PerkinElmer Spectrum Two N FT-NIR spectrometer with the Near-Infrared Reflectance Module (NIRM). Each spectrum was the sum of 32 scans over the range 10000–4000 cm-1.
NIR spectra were exported into Matlab 2014b, where spectral pretreatment and treatment were applied. Spectral pretreatment algorithms used were multiplicative scatter correction-first derivative (MSC-D1), and spectral treatment algorithms used were correlation in wavenumber space (CWS) and principal component analysis (PCA). For CWS method, the correlation coefficient (r) value of each test product was compared against the reference product. CWS method yields theoretical correlation values in the range of -1 to +1, where -1 indicated that the compared products were completely dissimilar, and +1 indicated they were identical. The threshold taken for authenticity was r value greater than 0.95. Note that PCA scores allowed visualization of clusters among reference and test products. Thus, the first two PCA scores of reference and test products were plotted, and clusters of the products were compared.
Results and Discussion
The evaluated medicinal products were chosen on the basis of being used for critical cardiovascular conditions, including arrhythmia, hypertension, ischemic heart disease, and myocardial infarction. As patients with CVDs often have polypharmacy and suffer from multiple comorbidities, substandard or counterfeit medicines encountered will negatively affect the treatment outcome. It is also noteworthy to mention that the medicinal products had wide variations in color, shape, and percentage of API. The percentage of API in the aforementioned medicinal products was in the range 8.14–48.4% m/m. The number of excipients in the medicinal products ranged between 3 and 12 excipients. Yet, the most common excipients encountered were lactose, maize starch, and microcrystalline cellulose (MCC). Having the excipients alongside the API was key information for authenticating the medicinal products as part of the physicochemical fingerprinting of the products.
NIR spectroscopy offered the advantage of inspecting the physicochemical properties of medicinal products nondestructively. Having a portable NIR device offered further benefits in mobility, so the instruments could be carried to the sample without the need for distinctive laboratory settings. Additionally, obtaining a spectral signature required a few seconds, up to minutes. The software allowed spectra to be exported to external software, where offline analysis could be applied.
Spectral Evaluation of Reference Products
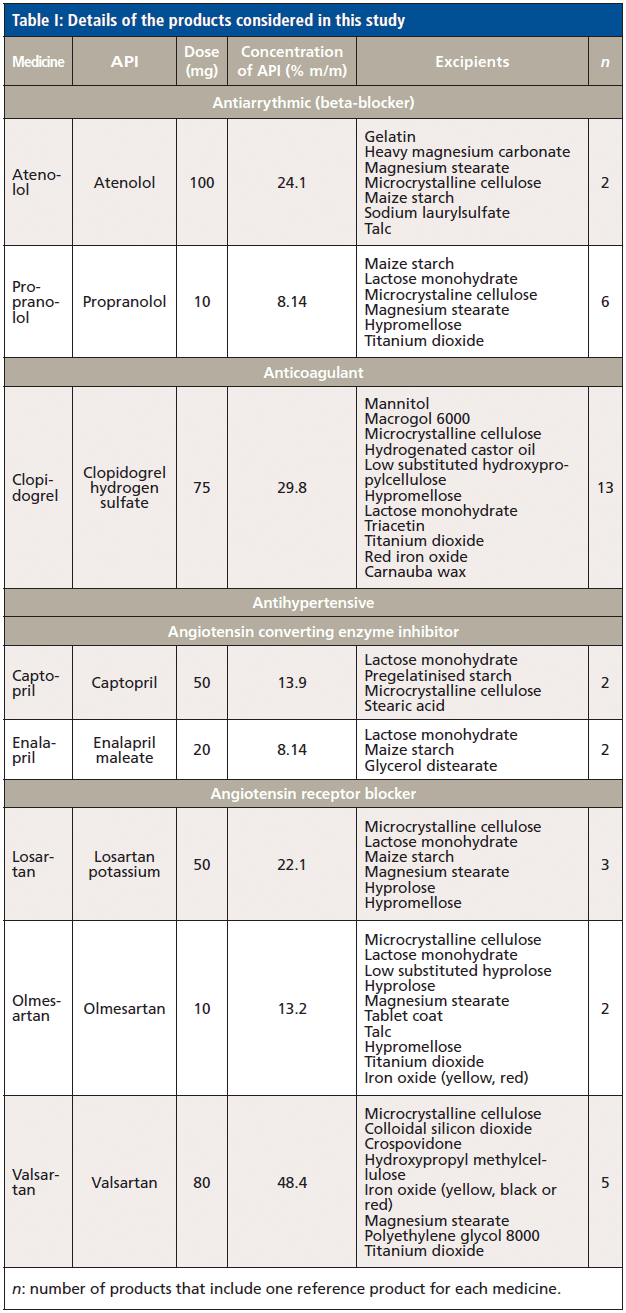
In this respect, the spectra of the reference medicinal products were compared against the spectra of the main excipients within each product (Figure 1). Often, spectra matched their main excipient, especially among products with the lowest percentage m/m of API. Therefore, propranolol has the lowest percentage of API (8.14% m/m) among the evaluated medicinal products, and gave higher values for lactose, hypromellose, and MCC that corresponded to 0.82, 0.76, and 0.72, respectively. However, none of the aforementioned values could be considered, because they were below the threshold of 0.95. High correlation values were also observed for additional products with low percentage m/m of APIs (< 20%). In this respect, captopril (API of 13.9% m/m) and olmesartan (API of 13.2% m/m) gave correlation (r) values of 0.71 and 0.70 for lactose, and 0.79 and 0.88 for MCC, respectively. As the percentage m/m of API in a product increased, the correlation (r) values against the excipients decreased, but high correlation (r) values were still observed for some of the excipients. Hence, losartan, clopidogrel, and atenolol had percentage m/m of APIs of 22.1, 24.1, and 29.8% m/m, respectively. Losartan gave correlation (r) values of 0.79, 0.74, and 0.84 against hypromellose, lactose monohydrate, and MCC. Clopidogrel that had higher percentage m/m of API showed lower correlation (r) values for the aforementioned three excipients that were 0.71, 0.66, and 0.77, respectively. Atenolol had very low correlation (r) values against all excipients that were below 0.51. Likewise, valsartan had 48.4% of API, and gave correlation (r) values below 0.65 for all excipients.


Figure 1: Multiplicative scatter correction-first derivative (MSC-D1) treated NIR spectra of (a) lactose, (b) maize starch, (c) microcrystalline cellulose, (d) talc, (e) atenolol, (f) propranolol, (g) clopidogrel, (h) captopril, (i) enalapril, (j) losartan, (k) olmesartan and (l) valsartan measured using an FT-NIR spectrometer with near-infrared reflectance module (NIRM).
Because the reference medicinal products had common excipients, CWS was applied to observe any type I or type II errors that could be encountered in identification of the aforementioned medicines. A type I error occurs when a product is misidentified as itself (giving a correlation [r]value < 0.95 against its own reference spectra). A type I error would conclude that product A is not A. A type II error occurs when a product is misidentified as another product (gives a correlation [r] value > 0.95 as compared to another product's spectra). A type II error would conclude that product B or C (not A) is product A. In this respect, no type I error was observed for individual tablets of each reference product. However, a type II error was observed for propranolol spectra that were identified as olmesertan (r = 0.95). This could be due to the common excipients among both products.
Tracking Authenticity of Products
Subsequently, CWS was adopted to evaluate the authenticity of test products. In this respect, the spectra of the test medicinal products were compared against the reference products and actual or potential constituents within each product (Table II). Only one test product was evaluated for atenolol, captopril, and enalapril, but the three products passed against the reference and gave a correlation (r) value of 0.9999. On the other contrary, match failures were seen among losartan, propranolol, and clopidogrel test products, and that could indicate the presence of counterfeit or substandard products. Two out of three losartan test products failed against the authentic reference, and gave r values of 0.9189 and 0.8349. Only one propranolol product (P3) passed with an r value of 0.9503. The remaining propranolol products gave r values in the range 0.8917–0.9111. Only four clopidogrel products passed and gave r values in the range 0.9859–0.9949. The remaining clopidogrel products that failed gave r values in the range of 0.7016–0.9365. Two of the failed clopidogrel products (P2 and P3) had close r values against the reference product (0.7016 and 0.7226), and similar r values against each other (r = 0.9746). When the spectrum of P3 was compared to the authentic product spectra, they were quite dissimilar (Figure 2). It is noteworthy to mention that the P3 spectrum showed a peak at 7196 cm-1 corresponding to talc, which was not an excipient in reference clopidogrel product (Figure 2).


The r value matches among clopidogrel products was also reflected in the correlation map that compared the r values of the 13 different clopidogrel products. Figure 3 shows the details of the correlation map, with colors ranging from dark blue (r values 0.64–0.73), light blue (0.74-0.80), green (0.80–0.85), yellow (0.85–0.89), orange (0.89–0.95), and red (0.95–1.0). Therefore, the darkest color indicated highly similar products, and showed that those products had the same matrix of APIs and excipients. High matches were not only observed among the two potential counterfeit clopidogrel products (P2 and P3), but also among authentic products. P4 and P6 had r values above 0.99 against each other, and against P1 (reference product). Also, P8 had r values above 0.98 against the aforementioned authentic products, and that indicated authenticity of the products relating to their physicochemical properties.

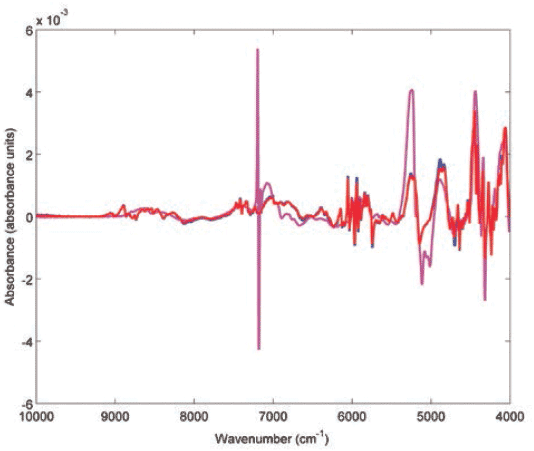

Figure 2: Multiplicative scatter correction-first derivative (MSC-D1) treated NIR spectra of clopidogrel reference product (blue), authentic test product (red, r = 0.9931) and counterfeit test product (magenta, r = 0.7227) measured using an FT-NIR spectrometer with near-infrared reflectance module (NIRM).
Tracing Physicochemical Properties of Products
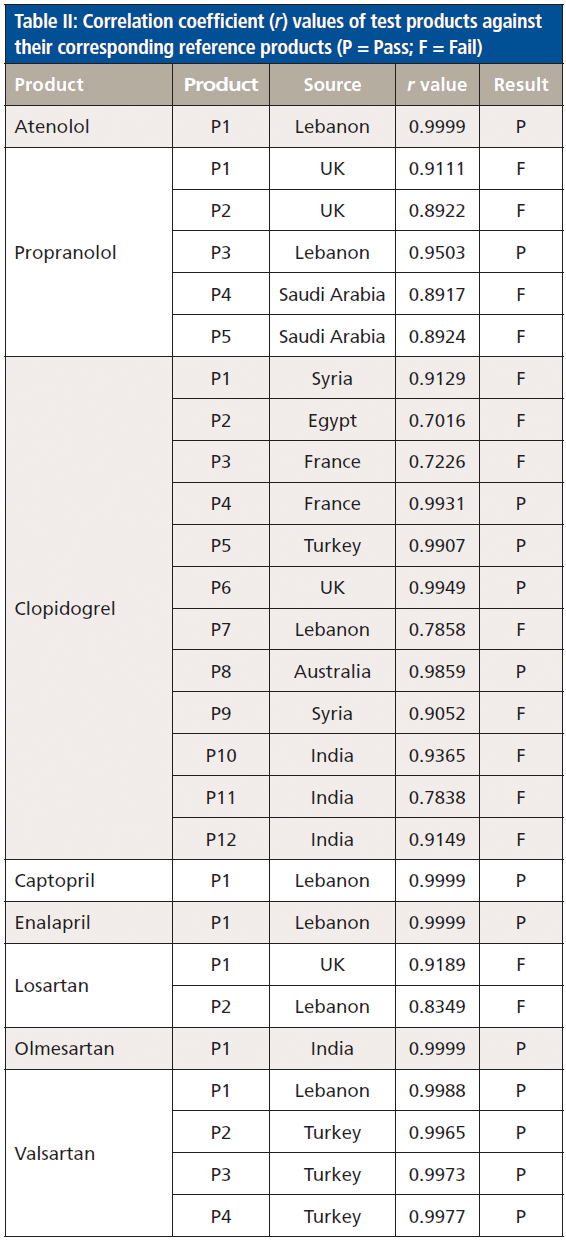
Physicochemical properties among the products were further confirmed when PCA was applied to the products with authentic and potential counterfeit or substandard samples. Figure 4 shows the PCA scores plots of propranolol, clopidogrel, losartan, and valsartan. For clopidogrel, the PC scores reflected the results obtained by the CWS method, where authentic product scores were grouped together and separated from counterfeit product scores. It is noteworthy to mention that the PCA results did not always match the CWS method, and this could be due to the different manufacturing sources of the individual products or suitability of the PCA model. Two clusters were seen for propranolol products, possibly due to lack of accuracy of the model. For instance, all valsartan products were confirmed authentic using the CWS method (r values between 0.9965–0.9988), but they showed three distinct clusters when measured using the PCA method, and this could indicate different manufacturing sources. Three distinct clusters were also seen among the three losartan products that were obtained from three sources (India, Lebanon, and the UK). Hence, the PCA method showed classified spectra according to variances rather than comparing the whole spectra, taking into account both physical and chemical differences reflected within spectra. Therefore, PCA on its own may not indicate authenticity, where different manufacturing sources of products were involved.

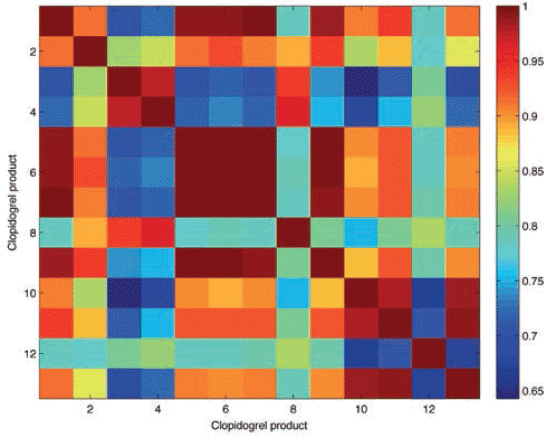

Figure 3: Correlation map of clopidogrel products including reference product and test products being P1 (Syria), P2 (Egypt), P3 (France), P4 (France), P5 (Turkey), P6 (UK), P7 (Lebanon), P8 (Australia), P9 (Syria), P10 (India), P11 (India) and P12 (India) respectively. The correlation map shows r value range between 0.6 (dark blue) up to 1.0 (dark red).
Conclusion
Portable NIR spectroscopy offers a rapid, mobile and cost-effective method for authenticating cardiovascular medicines and could serve as alternative to laboratory-based instruments where different laboratory settings are involved. The CWS method was successful in authenticating a cardiovascular product and raising alertness for potential counterfeit or substandard products. However, PCA was shown to be complementary to CWS in authenticating products where it demonstrated variability relating to physicochemical differences among individual products, whether they were authentic or counterfeit.

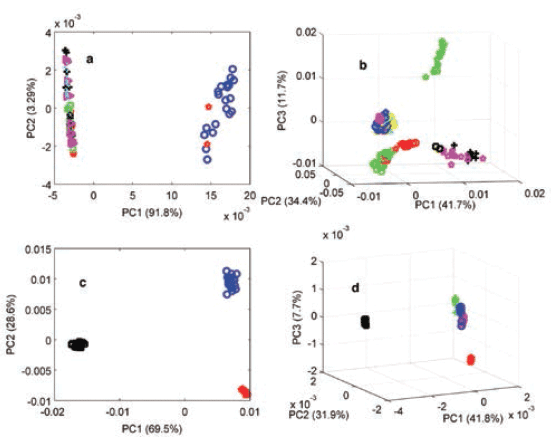

Figure 4: Principal components analysis (PCA) scores plot of the MSC-D1 NIR spectra of authentic (blue) and test products of (a) propranolol, (b) clopidogrel, (c) losartan, and (d) valsartan medicines measured using an FT-NIR spectrometer with the near-infrared reflectance module (NIRM).
References
(1) World Health Organization (WHO), Substandard and Falsified Medical Products (2018). http://www.who.int/news-room/fact-sheets/detail/substandard-and-falsified-medical-products.
(2) European Medicines Agency (EMA). Falsified Medicines Directive (2018): http://www.ema.europa.eu/ema/index.jsp?curl=pages/special_topics/general/general_content_000186.jsp&mid=WC0b01ac058002d4e8.
(3) T.K. Mackey and B.A. Liang. J Pharm. Sci. 100(11), 4571–4579 (2011).
(4) A.C. Moffat, S. Assi, and R.A. Watt, J. Near Infrared Spectrosc. 18(1), 1–5 (2010).
(5) World Health Organization (WHO), Preventing Chronic Diseases: A Vital Investment (2005). http://www.who.int/chp/chronic_disease_report/en/.
(6) World Health Organization (WHO), Cardiovascular Diseases (CVDs) (2017). http://www.who.int/news-room/fact-sheets/detail/cardiovascular-diseases-(cvds).
(7) M. Abolbashari, T.E. Macaulay, T.F. Whayne, D. Mukherjee, and S. Saha, Cardiovasc. Hematol. Agents Med. Chem. 15(1), 31–39 (2017).
(8) P.Y. Sacré, E. Deconinck, T. De Beer, P. Courselle, R. Vancauwenberghe, P. Chiap, and J.O. De Beer, J. Pharm. Biomed. Anal. 53(3), 445–453 (2010).
(9) S. Assi, R.A,. Watt, and T. Moffat, Spectroscopy S6, 36–47 (2011).
(10) S. Assi, R.A. Watt, and A.C. Moffat. Anal. Methods, 3(10), 2231–2236 (2011).
(11) S. Assi, Am. Pharm. Rev. 19(3), 1–12 (2016).
(12) T. Moffat, R.A. Watt, and S. Assi, Spectrosc. Eur. 22(5), 6–10 (2010).
Sulaf Assi is with the faculty of Pharmacy and Biomolecular Sciences at Liverpool John Moores University, in Liverpool, United Kingdom. Thomas Coombs and Jacob McEachran are with the Faculty of Science and Technology at Bournemouth University, in Dorset, United Kingdom. Ian Robertson and Kieran Evans are with Perkin Elmer, in Buckinghamshire, United Kingdom. Direct correspondence to: s.assi@ljmu.ac.uk


Measurement of Ammonia Leakage by TDLAS in Mid-Infrared Combined with an EMD-SG Filter Method
April 9th 2024In this article, tunable diode laser absorption spectroscopy (TDLAS) is used to measure ammonia leakage, where a new denoising method combining empirical mode decomposition with the Savitzky-Golay smoothing algorithm (EMD-SG) is proposed to improve the signal-to-noise ratio (SNR) of absorbance signals.


