FT-IR Search Algorithm – Assessing the Quality of a Match
The beginning of the age of Fourier transform infrared (FT-IR) spectroscopy meant the availability of digital spectra and opened the possibility of using computers to compare a single spectrum against a reference database containing thousands of spectra, thereby allowing enormous efficiency gains in the comparison of unknown spectra to reference materials. Various algorithms can be used to create a hit quality index (HQI), which is a measure of how well the query spectrum compares against each reference spectrum.
The beginning of the age of Fourier transform infrared (FT-IR) spectroscopy meant the availability of digital spectra and opened the possibility of using computers to compare a single spectrum against a reference database containing thousands of spectra, thereby allowing enormous efficiency gains in the comparison of unknown spectra to reference materials. Various algorithms can be used to create a hit quality index (HQI), which is a measure of how well the query spectrum compares against each reference spectrum. However, HQI does not tell the whole story and specifically does not tell us much about the quality of the match between query and reference spectra. In a ranked list of database hits, the difference, or gap in the HQI between two successive hits appears to be a good indicator of the quality of a match. The presence or absence of a significant gap between the first two or more hits has implications for match quality. While intuitively we might consider the highest ranked hit to be the "best" match, several similar HQI scores followed by a significant gap can mean a cluster of hits that are similar but not exact matches. This article looks at the possibility of using an assessment of the gap between hits to determine the quality of a match, what represents a significant gap, and when this assessment can fail.
Spectral searching is a tool commonly used to identify unknown materials and is occasionally used to help classify or interpret unknown materials. Algorithms are used to make a comparison between the unknown spectrum and each spectrum in the reference database. The algorithms return a number called the hit quality index (HQI) and the results are ranked by their HQI. Different software packages use different numbering systems for their HQI, even when the same algorithm is used. For example, the Euclidean distance search generates a HQI of 0.0 for the best possible match and the square root of 2 for the worst possible match. Many companies rescale these numbers to make 100 represent the best possible match and 0 equal to the worst match. For this article, we will use 100–0 as our scale, with 100 being the best possible match. How the algorithms work is not part of this article, but the nature of the algorithms means that each reference spectrum matches the unknown spectrum to some degree. There is no chemical intelligence built into the algorithms; they simply generate an HQI for each comparison and rank the results by HQI. This means there is always a best match, regardless of whether the unknown material is represented in the database or not.
Because we always have a number one match, the presence of a number one match is of no value in determining the quality of a match. To determine the quality of a match, we have relied on either the actual value of the HQI or on a visual comparison of the sample and reference spectra. There are potential problems with both methods. The actual value of the HQI can be misleading because there are a number of factors (1) that can significantly reduce the value of the HQI. Common factors include baseline problems, purge problems, and the presence of other components in the sample. In addition, a high HQI value is not necessarily an indication of an exact match because there is always the possibility of several compounds in the database that are similar to the unknown, but not an exact match. Those who compare the sample and reference spectra can also be misled, particularly if they see the first hit does a good job at matching their unknown and they fail to look at any additional hits. There is always the possibility that you have a good match, but if there are several similar compounds in the database and they all match well, then the match is more likely to mean the unknown has been classified rather than having found an exact match.
To evaluate any search results we should always compare several spectra from the top matches to our unknown spectrum.
This article will look at another measure to evaluate the search results, specifically the gap or difference between successive HQIs.
Experimental
Databases used include ST Japan's Aldrich/ICHEM complete ATR FT-IR library (36,639 compounds) and EPA-NIST Vapor Phase library (5228 compounds).
Sample spectra were acquired from various sources. The search software used was ACD/Labs Spectrus Optical Workbook and UVIR Manager.
Algorithms used were the Euclidean distance and first derivative Euclidean distance.
Each IR spectrum was searched by Euclidean distance and by the first derivative Euclidean distance. A total of 18 spectra were searched resulting in 36 total search results. Of the 18 spectra, eight were pure compounds run in a laboratory, six were vapor-phase spectra, and four were mixtures. The mixtures were created by digitally adding two spectra together.
Results and Discussion
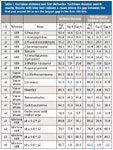
Three sets of numbers were looked at for each result: the actual HQI number, the gap in HQI between two successive hits (gap = HQIn – HQI[n+1]), and the gap % in the HQI between successive hits using the HQI of the first hit and the hundredth hit as the range to calculate the percentage (gap % = (HQIn – QHI[n+1])/(HQI1 – QHI100). Table I shows the results for the 36 searches.
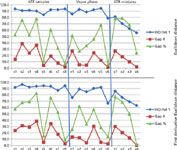
For the Euclidean distance algorithm the actual HQI numbers ranged from 93.5 to 55.7. The gaps for all samples ranged from 38.6 to 1.0, while the gap % ranged from 78.7% to 5.7%.
For the first derivative Euclidean distance algorithm the actual HQI numbers ranged from 96.3 to 63.2. The gaps for all samples ranged from 38.1 to 0.4, while the gap % ranged from 85.2% to 2.0%.
All of the pure spectrum searches resulted in the first hit being the correct match, except for the sixth vapor-phase sample, which is not in the database. For all of the mixture spectra, the first match was one of the components in the mixture. The entries with blue text in Table I indicate a search result where the difference or gap between the first and second hit is not the largest difference found in the first 100 hits.
Figure 1 shows a graph of the three sets of numbers for each search. In all of the searches, the correct match is the first hit, except for sample v6 which is not in the EPA-NIST database.

Figure 1: Three sets of numbers for both the Euclidean distance results and the first derivative Euclidean distance. Shown are the ATR samples (s1âs8), the vapor-phase samples (v1âv6 ), and the mixtures (x1âx4). HQI hit 1 is the HQI number of the first hit, gap # is the difference in the HQI between the first hit and the second hit, and gap % is the percent difference in the gap between the first hit and the second hit.
Pure ATR Samples
Looking at the pure ATR samples and the Euclidean distance results, the highest HQI is 93.5, given for sample s8 polyvinyl acetate. However, both the gap (1.8) between the first and second hits and the gap % (7.2%) are the second lowest values. Only v6, a compound which was not found in the database has a lower gap or gap %. If we look at a graph (Figure 2) of the HQI values for the Euclidean distance results for polyvinyl acetate, we see the largest gap occurring after the fourth hit. So, although the actual HQI of 93.5 tells us this is a good match, the graph tells us there are several similar compounds in the result. In this case, there are several polyvinyl acetate spectra in the database.

Figure 2: Graph of Euclidean distance HQIs for sample s8 (polyvinyl acetate).
A similar case exists for sample s5, 1,2,3,4-tetrahydronaphthalene (tetralin). This time the actual HQI value is down to 84.3. Looking at the graph for sample s5 (Figure 3) we can see the largest gap is between hits three and four. In this case, although the first hit is the correct hit, the gap and percent gap are relatively small between the first and second hits which suggests that a close inspection of the results is necessary. Hits one through three all have similar spectra and the structures are all ortho-substituted rings.

Figure 3: Search results and graph for 1,2,3,4-tetrahydronaphthalene (tetralin).
Vapor-Phase Samples
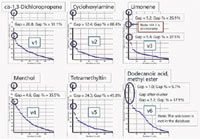
The results for the vapor samples are shown in Figure 4. For the samples found in the database, the HQI values range from 94.3 to 85.2, while the gaps range from 26.8 to 4.6. So neither the actual HQI nor the size of the gap seems to be a reliable indicator of just how unique the match is. In contrast, the gap % ranges from a low of 26.9% to a high of 68.4%. The size of the gap % is not reliant on the size of the gap. Just look at the difference between v1 and v2. v2 has a smaller gap than v1, while showing a greater gap %. While even the low gap % for sample v3 is a result of two forms of limonene in the database.

Figure 4: Vapor-phase spectra Euclidean distance results.
In sample v6 (dodecanoic acid methyl ester), the search result shows a cluster of hits separated by 17.9 gap %, even though the sample is not present in the database. This size of this gap % gives us a strong indication we have found several compounds similar to the unknown, and in this case the cluster at the top of the list is composed of several long-chain acid esters.
Mixture Samples
The four mixture samples were all created by taking the s4 spectrum, 2-bromopropane, and digitally adding 0.2, 0.4, 0.6, and 0.8 of the s2 spectrum, 2-acetylpyridine. For the Euclidean distance algorithm, we can see from Table I the HQIs drop from 80.8 to 55.7 with increasing amounts of the s2 spectrum. At the same time, we see a decrease in the gap from 27.1 to 1.9 units, while the gap % decreases from 78.2% to 24.0%.

Table I: Euclidean distance and first derivative Euclidean distance search results. Results with blue text indicate a result where the gap between the first and second hit is not the largest gap in the first 100 hits.
A similar change is seen in the first derivative results, although the last result, m4, has the smallest gap and gap % of all of the results. In this case, the first two hits are the two components of the mixture, followed by a gap of 8.4 and a percent gap of 47.9%.
While a Euclidean distance HQI of 62.7 for sample m3 cannot be considered a good match by itself and a gap of 10.1 is only possibly significant, the gap % of 65.8% is almost certainly a significant gap and warrants serious consideration for an exact match.
Conclusion
The HQI value itself is not a great indication of the quality of a match. We can see where high values may be questionable because of similar compounds present in the database and low values may still be very good in the presence of a mixture.
Similarly, the gap itself is not the best way to evaluate the quality of a match. This is because of several reasons, including the fact that the HQIs generated by the Euclidean distance algorithm do not decrease linearly. This means that a gap of 5 units near 90 has a different meaning than a gap of 5 units near 60. In addition, the presence of impurities (mixtures) can have a significant effect on this value.
The gap % appears to be the best indication of the quality of the match. Although no hard numbers can be derived from this limited study, percent gaps as low as 10% or 20% are possibly significant enough to indicate a cluster that warrants a close investigation of the results.
Unfortunately, there is no software available today to give us the gap %. There are a couple of software programs that can present a graph of the results and several that can export the HQI values in a form that can be imported into a program which can then create a graph. But even in the absence of a graph view or exporting data to another program, it is not difficult to see the approximate size of the gap as you step through several results of the search, so this method can be used with any software available today that displays HQI values.
In all cases, the diversity of the database and the quality of the spectra in the database will play a significant role in the size of the gap and gap %. The presence or absence of a significant gap should never replace the actual comparison of the sample and several reference spectra, but it can indicate that a close comparison of several spectra is required.
Michael Boruta is an Optical Spectroscopy Product Manager with Advanced Chemistry Development, Inc. (ACD/Labs), in Toronto, Ontario, Canada. Direct correspondence to: michael.boruta@acdlabs.com.
References
(1) ASTM E2310 - 04(2009) Standard Guide for Use of Spectral Searching by Curve Matching Algorithms with Data Recorded Using Mid-Infrared Spectroscopy.

Measurement of Ammonia Leakage by TDLAS in Mid-Infrared Combined with an EMD-SG Filter Method
April 9th 2024In this article, tunable diode laser absorption spectroscopy (TDLAS) is used to measure ammonia leakage, where a new denoising method combining empirical mode decomposition with the Savitzky-Golay smoothing algorithm (EMD-SG) is proposed to improve the signal-to-noise ratio (SNR) of absorbance signals.