LC–HRMS Determination of Anticancer Drugs as Occupational Contaminants Applied to Photocatalytic Degradation of Molecules of Different Stability
Here, degradation compounds similar to those formed in metabolic or environmental pathways were generated by adopting a photocatalytic process, quantified in environmental samples by liquid chromatography with multiple-stage mass spectrometry (LC–MSn) analysis using an orbital trap instrument with an electrospray interface, and then identified in indoor environments alongside parent compounds.
The occurrence of toxic drug residues is a hot topic concerning emerging environmental contaminants. The occupational exposure to anticancer drugs could be severe for health-care personnel and general public attending potentially polluted areas (such as oncology departments of hospitals) because of high therapeutic concentrations. The aim of this work was to generate degradation compounds similar to those formed in metabolic or environmental pathways by adopting a photocatalytic process and to identify them in indoor environments alongside parent compounds. A photodegradation model was applied to cyclophosphamide and mitomycin C. Studied substances and degradants were quantified in environmental samples by liquid chromatography with multiple-stage mass spectrometry (LC–MSn ) analysis using an orbital trap instrument with an electrospray interface. Various oxidative degradants were formed using the photocatalytic simulation model of degradation of antineoplastic drugs, beside some hydrolysis and molecule breakdown subproducts. High resolution MSn spectra were used to identify and confirm the proposed structures. Kinetics of formation of the main degradation products were also studied.
The frequency of recognition of toxic drug residues is an important issue concerning emerging environmental contaminants. This problem is also exacerbated by the low therapeutic index of drugs used in cancer chemotherapy. The occupational exposure to residues of anticancer drugs must be kept under strict control by safety managers because it could be severe for health care personnel and general public attending potentially polluted areas (such as oncology departments and pharmacies of hospitals) because of high therapeutic concentrations. In addition, urinary elimination by patients represents a source of contamination. The monitoring of drug residues is necessary to guarantee occupational safety and the absence of pollution. The presence of anticancer drug residues in environmental water samples has been reported (1–3). Looking closer at the structural features of these compounds, it is possible to see that the majority of chemotherapeutic drugs hold molecular structures with a high chemical reactivity (4). As a consequence of this great aptitude to undergo chemical transformation, it could be difficult to record measurable levels of some of these drugs. As an example, in a previous study (5) we found evidence of the difficulty to recover traces of mitomycin C because of its low stability. The aim of this work is to generate degradation compounds similar to those formed in metabolic or environmental pathways by adopting a photocatalytic process and to identify them in indoor environments. An additional purpose of this study is to develop a selective and sensitive method as a tool to detect drug transformation and degradation products and to quantify them in biological and environmental samples, beside parent compounds.
In this work, two anticancer drugs were studied: the N-mustard cyclophosphamide (N,N-bis(2-chloroethyl)-1,3,2-oxazaphosphinan-2-amine 2-oxide) and the aziridine mitomycin C ([(1aS,8S,8aR,8bS)-6-amino-8a-methoxy-5-methyl-4,7-dioxo-1,1a,2,4,7,8,8a,8b-octahydroazireno[2',3':3,4]pyrrolo[1,2-a]indol-8-yl]methyl carbamate). We chose cyclophosphamide and mitomycin C because of the popular use of these drugs and because of their different stability. The photodecomposition of drugs was carried out by heterogeneous photocatalysis, using titanium dioxide in water as previously reported (6,7). By this process, the photodecomposition of drugs could be due to either oxidative species or reductive conduction band electrons (8,9).
A highly sensitive method was developed to measure the degradation products in wipe samples that allows detection of parent drugs at the nanogram level (5). Occupational exposure monitoring of these drugs shows frequent cyclophosphamide positive measurements but no significant mitomycin C determination. The high instability of the mitomycin molecule is probably the main cause of these findings. One of the targets of this work is to identify new possible markers of mitomycin in environmental pollution. Identification and characterization of degradation compounds could contribute significantly to the development of more effective analytical methods to monitor occupational exposure.
High performance liquid chromatography (HPLC) coupled to mass spectrometry (MS) via an electrospray ionization (ESI) interface is a powerful tool to identify and measure anticancer drugs in the environment (10), especially in health care settings (11). However, liquid chromatography—mass spectrometry (LC–MS) analysis performed in full-scan mode is not sensitive enough to detect and characterize metabolites at trace levels and the excellent sensitivity provided in multiple reaction monitoring (MRM) mode suffers from a lack of structural information to characterize the huge number of potential degradants formed from drug compounds.
For this reason, we developed a sensitive liquid chromatography–high-resolution mass spectrometry (LC–HRMS) methodology using orbital trap technology (12) with the purpose of exploiting the potential of untargeted analysis for which it is fitted. From the analysis of spectra acquired at high resolving power, it was possible to hypothesize the structure of the main degradation products observed in the photocatalysis simulation model.
Experimental
Chemicals and Materials
LC–MS-grade acetonitrile was purchased from VWR (VWR International PBI). Extra-pure formic acid was purchased from Fluka (Sigma-Adrich). Cyclophosphamide was from Baxter and mitomycin C was purchased from ProStrakan. Experiments were carried out using TiO2 Degussa P25 as the photocatalyst. Methanol, trichloroacetic acid, heptafluorobutanoic acid, and ammonia were purchased from Sigma-Aldrich at a purity ≥99%. HPLC-grade water was obtained using a MilliQ System Academic system (Millipore).
Irradiation Technique
Irradiation was performed using a Philips TLK/05 lamp (40 W/m2 ) with maximum emission at 360 nm. Irradiation experiments were carried out in Pyrex glass cells containing the studied drug (20 mg/L) and titanium dioxide (200 mg/L) in ultrapure water. The temperature reached during irradiation was 38 ± 2 °C.
Liquid Chromatography
Chromatographic separation followed by MS analysis was run on a 150 × 2.0 mm, 3-µ dp Phenomenex Luna C18 column preceded by a Luna C18 guard column, using a Dionex Ultimate 3000 HPLC instrument (Thermo Fisher Scientific). The injection volume was 20 µL and the flow rate was 200 µL/min. Mobile-phase A was 0.1% formic acid in water, and mobile-phase B was acetonitrile. After a 2-min isocratic run at 5% B, a gradient to 100% B was concluded at 20 min. A column wash with 100% B (3 min) was followed by equilibration with 5% B starting at 25 min and maintained until 30 min. All injection volumes were 20 µL, the column temperature was 30 °C, and the flow rate was 0.2 mL/min. The wash solvent was 1:2 (v/v) water–acetonitrile.
High-Resolution Mass Spectrometry
An LTQ Orbitrap mass spectrometer (Thermo Scientific), equipped with an atmospheric pressure interface and an ESI ion source, was used. Analyses were carried out in both the positive and negative ion modes. The LC column effluent was delivered to the ion source using nitrogen as both sheath and auxiliary gas. The source voltage was set to 4.4 kV (-4.0 kV in the negative ion mode). The heated capillary temperature was maintained at 275 °C. The nitrogen flows as sheath gas and auxiliary gas were set at 20 and 10 (arbitrary units), respectively. The acquisition method used had previously been optimized in the tuning sections for the parent compound (capillary, magnetic lenses, and collimating octapoles voltages) to achieve maximum sensitivity. The main tuning parameters adopted for the ESI source in the positive ion mode were 24 V for capillary voltage and 65 V for tube lens and -15 V and -54 V in the negative ion mode, respectively. Full scan spectra were acquired in the range 50–1000 m/z. Multiple-stage mass spectrometry (MSn ) spectra were acquired in the range between ion trap cut-off and precursor ion m/z values. Spectra were acquired with the resolution R = 30000 (full width at half maximum [FWHM]). Mass accuracy of recorded ions (vs. calculated) was ± 0.001 u (without internal calibration). Calibration curves for cyclophosphamide and mitomycin C were constructed from five calibration points for each compound in the range 0.10–50.0 µg/mL.
Results and Discussion
Cyclophosphamide and Mitomycin C MS-MS Study
The MS2 and MS3 fragmentation study of the studied compounds showed some characteristic losses that were considered in identifying the unknown compounds formed during the photo-induced degradation of the drugs. The product ions generated from protonated molecular ions are shown in Figures 1 and 2. MSn fragment identification was confirmed by the high resolution study of neutral losses. The main product ions of cyclophosphamide were formed through an ethylene molecule loss or three different phosphoric ring breakings respectively leading to the formation of aziridine (106.0423 m/z), amine (142.0182 m/z), or imine (140.0034 m/z) nitrogen mustard structures. The successive fragmentation of these ions mainly involve simple HCl elimination (Figure 1).

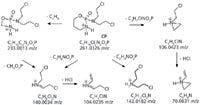

Figure 1: Cyclophosphamide MH+ MS2 proposed fragmentation pathways.
The protonated ion of mitomycin C generates a single product ion (242.0930 m/z) by concerted loss of methanol and carbamic acid. The main MS3 losses involve CO, HCN, and ammonia elimination (Figure 2). The MS4 converging losses of CO and NH3 to give the common product ion at 197.0708 m/z is noteworthy.

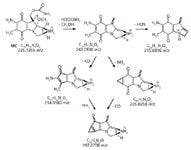
Figure 2: Mitomycin C MH+ MS2 and MS3 proposed fragmentation pathways.
In the negative ion mode, cyclophosphamide does not ionize in a noticeable way, whereas mitomycin C originates at a [M-H]– ion, about 10 times less intense than the corresponding MH+ ion formed in the positive ion mode. This deprotonated ion, by MS-MS fragmentation, again gives a single product ion eliminating HCNO (43.0073 u).

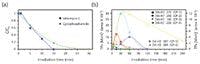
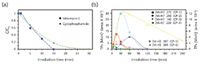
Figure 3: Plots of the kinetics of (a) parent compound decrease and (b) formation of main cyclophosphamide transformation products (TPs).
Laboratory Simulation
Laboratory simulation was initially performed on cyclophosphamide and mitomicyn C in ultrapure water, in the presence of titanium dioxide as photocatalyst. The parent drugs were easily degraded and completely disappeared within 30 min of irradiation (Figure 3a). In parallel with the disappearance of parent drugs, a number of transformation products were identified. Their sequential evolution is shown for cyclophosphamide in Figure 3b and will be discussed in the characterization of transformation products section. Transformation products were characterized by different m/z ratios of the precursor ions as well as by MS3 analysis in the case of hydroxylated isomers, as shown in Figure 4. This finding is in agreement with the nonselectivity of the active species involved in the photocatalytic process, that is, OH radicals (13).

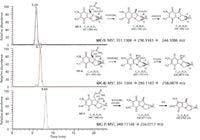

Figure 4: LCâESI HRMSn chromatograms of MC-5, MC-6, and MC-7 degradation products (after 5 min of irradiation) together with hypothesized fragmentation pathways that are able to justify the main MS3 (for isomers MC-5 and MC-6) and MS2 fragments.
Several species have been detected along with the cyclophosphamide and mitomycin C disappearance. The intermediates were characterized by taking into account their chromatographic behavior and kinetics of evolution, coupled with the exact mass information, an accurate analysis of MS and MSn spectra and a comparison with parent drug fragmentation pathways. Retention times, m/z values, and elemental composition of HRMSn observed ions are reported in Table I.


Table I: Parent drugs, degradation compounds, and LCâHRMSn parameters
Characterization of Cyclophosphamide Transformation Products from Irradiation Study
Six main species were detected within cyclophosphamide degradation. Extracted chromatograms at 2 ppm mass tolerance level are shown in Figure 5. We evaluated both the formation of known metabolites and the generation of new unknown photocatalytic degradation products. The isotopic abundance pattern was used as a powerful additional constraint for identification of unknowns.

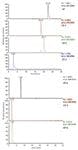

Figure 5: LCâHRMS chromatogram of the cyclophosphamide photocatalytic degradation mixture after 15 min of irradiation (positive ion mode; on the top) and 30 min of irradiation (negative ion mode; on the bottom).
The cyclophosphamide degradation study showed both the formation of previously known human metabolites (14,15) (CP-1, CP-2, and CP-3 shown in Figure 6) and the generation of three new degradants whose potential structures were reported in Figure 6 (CP-4, CP-5, and CP-6). Compound CP-1 matches with the main known metabolite 4-ketocyclophosphamide whereas the quantitatively most abundant compound on the bases of peak areas obtained was the compound CP-3, known as NOR-nitrogen mustard. The maximum survival time in the presence of titanium dioxide and light was 240 min (appearance and disappearance kinetics are shown in Figure 3). For example, MS2 spectrum (CP-1) is shown in Figure 7. In this study, the acquisition of positive and negative ions spectra was crucial because CP-2 and CP-3 were detectable as positive ion only when CP-4, CP-5, and CP-6 negative ions.

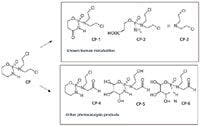
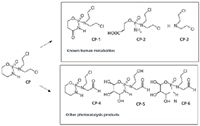
Figure 6: Cyclophosphamide degradation products detected after heterogeneous photocatalysis decomposition.
Characterization of Mitomycin C Transformation Products from Irradiation Study
The degradation pattern of mitomycin C looks simpler than the cyclophosphamide one. Three species were recognized and their chromatograms are shown in Figure 4.

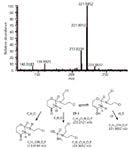
Figure 7: MS2 spectrum of degradation product CP-1 together with the hypothesized fragmentation pathway.
The mitomycin C degradation study did not show any appreciable trace of known degradants. The formation of such transformation products, named mitosanes and mitosenes, is well known in the literature (16,17) (MC-1, MC-2, MC-3, and MC-4, Figure 8). On the contrary, three new compounds were obtained by heterogeneous photocatalysis (MC-5, MC-6, and MC-7; Figure 8). The first two products are formed by hydroxylation and are isomers; the last one comes from a hydroxylation and oxidation process. To hypothesize the structures reported in Figure 4, besides the corresponding chromatograms, a high resolving power multistage MS study was performed. We hypothesized the structures shown in Figure 2 and Figure 4 for the couple of isomers named MC-5 and MC-6 because of the different MS3 fragmentation observed. The elimination of methanol that characterizes MC-5 MS3 behavior suggested that we leave the methoxy moiety unmodified and position the OH group on C-8 to explain the simple formamide loss. On the contrary, MC-6 was identified as 8a-hydroxymethoxy-derivative to justify the MS3 base peak formed by H2CO2 elimination. Also, in this case, we considered the more probable OH attack on the methoxy group than on the 5-methyl substituent because the MS2 behavior was different from the parent drug one. The two MS3 example spectra are displayed in Figure 9.

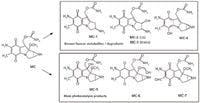
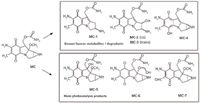
Figure 8: Mitomycin C degradation products detected after heterogeneous photocatalysis decomposition (bottom box) in comparison with the known metabolites (16) (top box).
Conclusions
In a workplace environment, just like in vivo, exogenous compounds go through many chemical and bio-transformations; however, most of these transformations could not be detected by current methods applied to metabolism studies or targeted on a specific drug molecule (18,19). In the present study, we demonstrated how low-abundance drug metabolites and unknown degradation products could be successfully detected, analyzed, and characterized. Chemical structures of these detected metabolites were proposed, based on MS and MSn spectra. The described methodology was applied in heterogeneous photocatalysis experiments in which two anticancer drugs were artificially decomposed. The photocatalytic degradation model identified new transformation products from two anticancer drugs, cyclophosphamide and mitomycin C. In the case of cyclophosphamide, the simulation model gives a broad scenario of the formation of degradants including known human metabolites. In contrast, the same model does not permit the formation of known degradation products of mitomycin C, formed both in vivo and in spontaneous decomposition, probably because of the very different reaction kinetics.

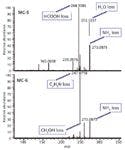
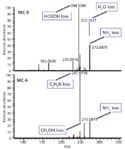
Figure 9: HRMS3 spectra of isomeric compounds MC-5 and MC-6.
From the analytical point of view, LC–HRMS methodology can greatly help drug residue monitoring together with the untargeted analytes identification, and, combined with photocatalysis, could be a suitable tool to simulate biological and chemical transformations through photochemical laboratory experiments. This suggests that new structures for future metabolic and environmental studies are possible.
References
(1) E. Zuccato , S. Castiglioni, and R. Fanelli, J. Hazard. Mat. 122, 205–209 (2005).
(2) M. Gros, M. Petrovic, and D. Barceló, Anal. Bioanal. Chem. 386, 941–952 (2006).
(3) Y. Valcárcel, S. González Alonso, J.L. Rodríguez-Gil, A. Gil, and M. Catalá, Chemosphere 84, 1336–1348 (2011).
(4) C. Avendano and J.C. Menendez, Medicinal Chemistry of Anticancer Drugs (Elsevier, Amsterdam, The Netherlands, 2008).
(5) C. Medana, C. Baiocchi, F. Dal Bello, V. Scarpino, and E. Davoli, unpublished research.
(6) C. Medana, P. Calza, V. Giancotti, F. Dal Bello, M. Pasello, M. Montana, and C. Baiocchi, Drug Test. Anal. 3, 724–734 (2011).
(7) P. Calza, C. Medana, E. Padovano, V. Giancotti, and C. Minero, Rapid Comm. Mass Spec. 26, 1687–1704 (2012).
(8) M.R. Hoffmann, S.T. Martin, W. Choi, and D.W. Bahnemann, Chem. Rev. 95, 69–96 (1995).
(9) D.W. Bahenmann, J. Cunningham, M.A. Fox, E. Pelizzetti, P. Pichat, and N. Serpone, in Aquatic and Surface Chemistry, G.R. Helz, R.G. Zepp, and D.G. Crosby, Eds. (Lewis, Boca Raton, Florida, 1994), pp. 275–278.
(10) N. Negreira, M. Lòpez de Alda, and D. Barcelò, J. Chrom. A 1280, 64–74 (2013).
(11) C. Sottani, B. Porro, M. Imbriani, and C. Minoia, Toxicol. Lett. 213, 107–115 (2012).
(12) M. Scigelova and A. Makarov, Bioanalysis 1, 741–754 (2009).
(13) A. Kunai, S. Hata, S. Ita, and K. Sasaki, J. Am. Chem. Soc. 108, 6012–6016 (1986).
(14) C. Fenselau, J. AOAC 59, 1028–1036 (1976).
(15) L.A. Vanaerts, J.H. Copius Peereboom, and J. Stegeman Noordhoek, Toxicol. In Vitro 9, 677–684 (1995).
(16) J.H. Beijnen and W.J.M. Underberg, Int. J. Pharm. 24, 219 (1985).
(17) M.M.L. Fiallo, H. Kozlowski, and A. Garnier-Suillerot, Eur. J. Pharm. Sci. 12, 487–494 (2001)
(18) M. Holcapek, L. Kolarova, and M. Nobilis, Anal. Bioanal. Chem. 391, 59–78 (2008).
(19) M.J. Nozal, J.L. Bernal, M.T. Martìn, J. Bernal, R.M. Torres, and J. Merayo, J. Pharm. Biomed. Anal. 40, 100–104 (2006).
Claudio Medana, Federica Dal Bello, and Claudio Baiocchi are with the Department of Molecular Biotechnology and Health Sciences at the Università degli Studi di Torino in Torino, Italy. Paola Calza is with the Department of Chemistry and the NIS Centre of Excellence at the Università degli Studi di Torino. Direct correspondence to: claudio.medana@unito.it


Getting accurate IR spectra on monolayer of molecules
April 18th 2024Creating uniform and repeatable monolayers is incredibly important for both scientific pursuits as well as the manufacturing of products in semiconductor, biotechnology, and. other industries. However, measuring monolayers and functionalized surfaces directly is. difficult, and many rely on a variety of characterization techniques that when used together can provide some degree of confidence. By combining non-contact atomic force microscopy (AFM) and IR spectroscopy, IR PiFM provides sensitive and accurate analysis of sub-monolayer of molecules without the concern of tip-sample cross contamination. Dr. Sung Park, Molecular Vista, joined Spectroscopy to provide insights on how IR PiFM can acquire IR signature of monolayer films due to its unique implementation.


Deep Level Transient Spectroscopy Reveals Influence of Defects on 2D Semiconductor Devices
April 25th 2024A recent study used deep level transient spectroscopy to investigate the electrical response of defect filling and emission in monolayer metal-organic chemical vapor deposition (MOCVD)-grown materials deposited on complementary metal-oxide-semiconductor (CMOS)-compatible substrates.

