A Brief Look at Optical Diffuse Reflection (ODR) Spectroscopy
In this short overview, we consider use cases for diffuse reflection spectroscopy and introduce the Kubelka-Munk diffuse reflectance formula. We conclude by comparing diffuse transmittance, diffuse reflectance, logarithmic transforms of both, and the Kubelka-Munk transform for mid-infrared spectroscopy of the same sample.
Diffuse reflection (DR) is a process in which light penetrates the front surface of a substance, scatters inside its volume, and exits back through the front surface. Light reflected from the exterior of the substance can be either specular (mirror-like) or diffuse depending on the smoothness of the front surface; this surface component of reflectance is not usually of interest to an analytical spectroscopist. Light emerging diffusely from the interior (or volume) of the substance carries recognizable spectroscopic signatures of the substance and is useful for a variety of analytical purposes.
We concern ourselves here with solid analytes having a single crystalline form measured with light of ordinary optical wavelengths, from the visible region through the mid-infrared region, with wavelengths in the range 400–25,000 nm (0.4–25 μm). In principle, optical spectroscopy of any substance over any wavelength range can be performed using the DR technique, provided (a) light can enter and exit through the same face of a sample, (b) light is not completely attenuated inside the substance, and (c) the substance contains sufficient scattering centers in its volume to produce a measurable diffuse volume reflectance. DR provides a sampling method for many real-world applications that are challenging for conventional transmission methods. Figure 1 gives an overview of some typical scenarios for DR measurements in the visible, near-infrared and mid-infrared spectral domains.

 light interacting with gloss paint containing pigments, some of which may absorb strongly in the visible wavelength region, (b) light interacting with a pure or mixed powder of crystalline organic materials with weak near-infrared absorption properties, and (c) light interacting with a mixture of mid-infrared-absorbing particles diluted in KCl or KBr.")
FIGURE 1: Illustrations of (a) light interacting with gloss paint containing pigments, some of which may absorb strongly in the visible wavelength region, (b) light interacting with a pure or mixed powder of crystalline organic materials with weak near-infrared absorption properties, and (c) light interacting with a mixture of mid-infrared-absorbing particles diluted in KCl or KBr.
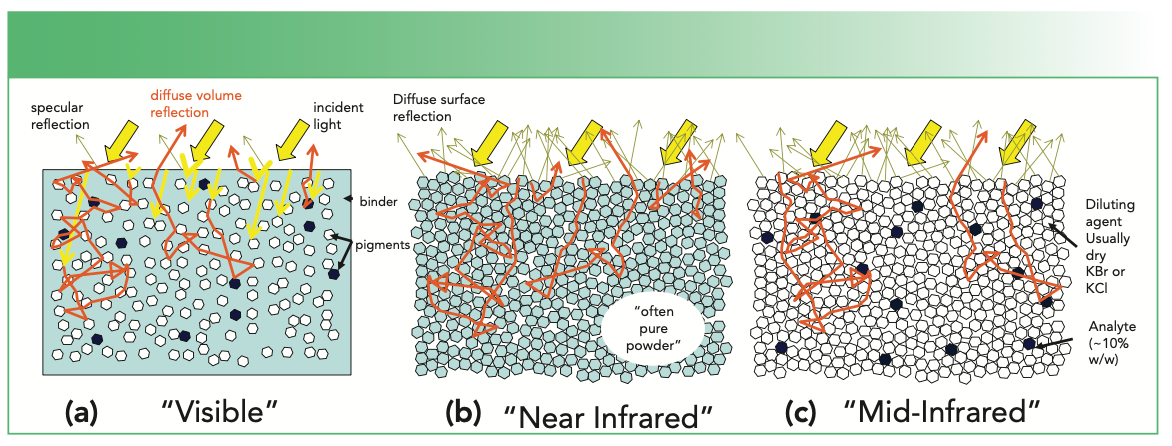
Figure 1a is a schematic for a visible paint-type application. An organic binder suspends particles of pigment that provide coverage and coloration. We may, in many cases, ignore the absorption properties of the binder, while colored pigments may have quite strong and wavelength-dependent absorption characteristics. While the paint can be formulated to achieve either a gloss or matte finish, a gloss finish characterized by a specular surface component to the reflection is illustrated here. This surface reflection will mostly carry information about the organic binder through the dispersion of its refractive index, but is difficult to use analytically. For example, even a deep red gloss paint on a sports car will produce a glare from the sun that is essentially the color of the sun’s rays rather than the pigments. In general, we prefer to avoid the surface component of reflection for this reason. Fortunately, a specular reflection of this type is relatively easy to distinguish from the diffuse volume component of reflection because it is strongly directional (like the sun’s glare), while the diffuse volume component occupies a wide angular distribution.
On the schematic in Figure 1, yellow arrows indicate incident rays and rays refracted into the medium before they are scattered, while darker yellow rays represent the specular reflection of the surface, and orange rays represent rays after interacting with a pigment particle. These rays can scatter multiple times through tortuous paths until they return to the surface and escape over a wide range of angles. Some of these rays encounter colored pigment particles; a fraction of these rays are absorbed during these encounters, resulting in visibly colored diffuse reflection. Non-absorbing white pigments (for example, titanium dioxide and zinc oxide) are added to increase the scattering inside the paint layers for better coverage and to adjust the color density of the paints. In many cases of the study of paints, measurements may be made on a finished product if appropriate equipment is available, or on witness samples produced specifically for measurement. The DR measurements themselves are non-destructive.
Figure 1b is a schematic illustrating a near-infrared powder (for example, pharmaceutical, mineral or food product) application. Particularly in the short-wavelength region of the near-infrared, most organic substances have relatively low absorption strengths (many orders of magnitude lower than the relatively strong absorption of visible pigments). In this case, the sample is often a pure powdered substance, although a mixture of powders is also common. These samples tend to have microscopically rough front surfaces even when packed, resulting in a diffuse surface component to reflection that is difficult or impossible to separate from the diffuse scattering volume component. In this case, it is desirable to ensure that the volume component of diffuse reflection is strong enough that the surface component is minor in comparison.
In a closely packed powder, the penetration depth of light before encountering a particle is very small, so no penetrating refracted rays are illustrated in Figure 1b, and we can assume that all rays begin taking a tortuous path immediately after entering the volume of the substance. Particle sizes vary, but particles in the 5–20 μm size range are not uncommon. For industrial or pharmaceutical applications, control of particle size is often important for controlling dissolution and other chemical and physical properties. Control of particle size is also important for reproducible DR spectroscopy of these types of samples because scattering occurs at particle interfaces, and the particle interfacial area per unit weight of a substance increases rapidly as its particle size decreases. Smaller particles lead to increased scattering, reducing the depth of penetration of light and increasing the volume component of diffuse reflection.
This near-infrared application is sometimes of a product nearing the final stages of production, and is non-destructive.
Figure 1c illustrates the application of mid-infrared DR, also known as DRIFTS (diffuse reflection infrared Fourier transform spectroscopy), to spectral identification and spectral matching of unknown compounds. Unlike the previous examples, this particular application of mid-infrared DR spectroscopy usually requires an extra sample preparation step in which the sample, often a strongly mid-infrared-absorbing crystalline organic powder, has been diluted 10x or more in a nominally non-absorbing salt such as KBr or KCl. These two materials will commonly have been mixed and ground together in a mortar and pestle in a research laboratory before measurement. This approach may have been used in forensic laboratories to identify unknown substances in the past, although many modern forensic samples are highly variable complex mixtures for which more elaborate analytical measurements are better suited. Although technically non-destructive, mixing the substances for DR measurement requires a separation step to recover the organic material being studied, and this might not be worthwhile unless the material is scarce, valuable, or both.
The Kubelka-Munk Model of Diffuse Reflection
Mathematical models of DR are beyond the scope of this article, but the most commonly used transformation of DR is based on the one-dimensional Kubelka-Munk (KM) model. The transformation itself is obtained from reflectance, R, as shown in equation 1 (1):


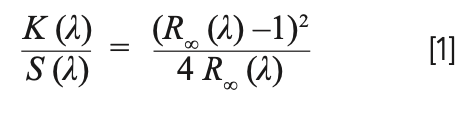
The subscript ∞ on R∞ in equation 1 indicates reflectance from an infinitely thick diffusely reflecting material. In practice, a finite thickness of a few mm (for example, 2–8 mm) is often adequate to approximate infinite thickness. The factor K/S on the left is the ratio of absorption to scattering in the medium, and it is evaluated from the measured reflectance spectrum. If we assume scattering is independent of wavelength, then this ratio is proportional to absorption.
The important assumptions in the derivation of equation 1 are:
- Surface reflections are ignored,
- Scattering is considered isotropic,
- Samples are infinitely thick, and
- A one-dimensional model describes the diffuse reflection process
Although not included in the derivation, the typical application of the KM model also assumes that the scattering factor, S, is independent of wavelength and is consistent between samples, giving six significant assumptions that we should understand before applying the KM model.
Turning to the first assumption, ignoring surface reflections could be perfectly acceptable if the front surface of the medium is polished or mirror-like, and if optics can be used that take advantage of its directionality to remove the specular reflection. Rough surfaces, on the other hand, do not allow for this experimental approach. In this case, we can assume that most organic materials and many inorganic materials will produce a surface component of diffuse reflection that amounts to several percent of the incident light intensity, with limited exceptions. In an unpolarized, steady-state DR experiment this surface scattering cannot be removed or even minimized, so ignoring surface scattering is not strictly possible. The best compromise is to generally ensure the volume component of scattering is at least an order of magnitude greater than the surface scattering. When the measured reflectance falls below 40–50% at any wavelength, noticeable distortion of absorption bands is often unavoidable due to surface scattering when using equation 1. In this case, dilution, or grinding the material into a more finely divided state, can be used to increase the reflectance.
The assumption of isotropic scattering is also not strictly true. A number of models of light scattering exist for different wavelength ranges, particle compositions, particle shape and particle sizes, but none of them predict isotropic scattering from a single interaction between light and particles as a general case. On the other hand, if a system exhibits multiple scattering events per absorption event, the sum effect of multiple scattering events can perhaps approach the isotropic limit. This suggests that dilution or grinding particles into a more finely divided state is preferred for diffuse reflection measurements using the KM interpretation to increase the amount of scattering relative to absorption. This is also consistent with the need described above to keep overall reflectance high.
The assumption that samples are infinitely thick is never true, but in many cases, samples can have an optical thickness so great that the difference is negligible. As with the preceding assumptions, this is easier to do when the particle size is small and scattering is large, as the effective path length can become many times larger than the physical thickness of a sample. The depth of penetration of light into a sample determines whether a sample can be considered optically thick or not—if the physical thickness is a significant multiple of the depth of penetration, then this is a convenient assumption. One challenge is that the depth of penetration is not fixed in diffuse reflection, but is a function of both the absorption and scattering coefficients. In particular, low absorption leads to larger depths of penetration. In practice, a reasonable sample thickness on the order of several mm (for example, 2–8 mm) can be adequate if scattering is strong and absorption is low to moderate. If the sample thickness is marginal, it is the very weakest absorption bands that the KM model predicts would be lost first. Marginal sample thicknesses can be a source of irreproducibility and interlaboratory discrepancies in DR spectroscopy.
The simplification of a diffusely reflecting medium into a one-dimensional model seems, on its face, questionable. Reference 1, however, shows that a three-dimensional model gives the same formula as equation 1 under specific conditions.
The wavelength dependence of scattering depends strongly on the wavelength region. Scattering of light by small particles is caused by the discontinuity of the refractive index at interfaces. For particles separated by air gaps, dispersion of the refractive index of condensed matter can produce anomalous behavior, and this dispersion is most pronounced around strong absorption features. The assumption of wavelength independence is best for typical visible and near-infrared applications as described in Figures 1a and 1b, where transparent binders and white pigments are responsible for most scattering in paints, and where near-infrared absorption features are weak. The assumption of wavelength independence is perhaps poorest for mid-infrared applications of DR spectroscopy when particles of the analyte are responsible for a large portion of all scattering. This situation is once again improved by dilution of the analyte in dry, finely-ground infrared-transparent KBr or KCl. Once again, the conditions that result in relatively high reflectance are also the conditions for better quality spectroscopy and interpretation using the KM model.
Consistency of scattering is also often needed for quality analytical applications of DR spectroscopy. This consistency of scattering is strongly dependent on consistent particle sizing and consistent compression, packing and preparation of the sample. Variations in particle size and preparation of the sample for DR measurements provide yet more sources of interlaboratory variability in DR measurements.
MIR DR Spectroscopy of 1,4-Dichlorobenzene in KBR
In this section we give example infrared spectra of a simple crystalline solid, 1,4-dichlorobenzene (14DCB), diluted to a concentration of 10% w/w in KBr powder. This 14DCB sample was ground in a mortar and pestle then pressed into a white, optically dense pellet using a pellet press. The resulting pellet was ~3 mm thick and measurements of both diffuse transmission (DT) of the pellet in the transmission arrangement and DR were recorded. All spectra here were recorded against a reference pellet of powdered KBr, and all have been manually baseline corrected.
This non-linear 12-atom molecule has D2h symmetry in the gas phase, but crystallizes in a form with 2 molecules per lattice basis point, each of which is in a crystal site having Ci (centrosymmetric or inversion) symmetry. The free molecule has 13 infrared active fundamental vibrations, but, in the lower symmetry of the crystal, 15 vibrations could be infrared active; the presence of two molecules per basis point means that these bands could potentially split into 30 modes that all represent fundamental vibrational transitions in crystals of the main isotopic form of 14DCB, and that could be observable in the infrared DR spectrum. We expect three significant isotopic permutations of 14DCB due to the two major Cl isotopes in a proportion of ~1:6:9, and two different potentially detectable isotopic forms due to mono-substitution of 13C for 12C, one of ~2% and the other of ~4% relative intensity (we can ignore greater levels of C substitution), giving a total of ~6 notable isotopic forms. Several of these substitutions remove the center of symmetry of the molecule and allow vibrations to gain infrared activity that normally have only Raman activity. Numerous weak 2- and 3-quanta combination bands are also expected to be potentially observable, with intensities up to ~10% and ~1% of the strongest bands, respectively. Most of these minor bands would be undetectable in ordinary solution transmission measurements because of the higher symmetry environment and their low intensity, but they could become observable in DR spectroscopy. The actual infrared spectra at 4 cm-1 resolution of the diluted solid sample are shown in parts a–c of Figure 2, which are stacked above one another for ease of comparison.

 of 1,4-dichlorobenzene 10% w/w in KBr powder. (a) Blue: baseline corrected transmission (DT) through the pellet relative to a pure KBr pellet; red: log(1/DT). (b) Blue: baseline corrected diffuse reflectance (DR) spectrum of the same pellet relative to a pure KBr pellet; red: log(1/DR). (c) Blue: log(1/DT); red: KM transform of DR.")
FIGURE 2: Mid-infrared spectroscopy of a pressed pellet (approximately 1 cm diameter, 3 mm thickness) of 1,4-dichlorobenzene 10% w/w in KBr powder. (a) Blue: baseline corrected transmission (DT) through the pellet relative to a pure KBr pellet; red: log(1/DT). (b) Blue: baseline corrected diffuse reflectance (DR) spectrum of the same pellet relative to a pure KBr pellet; red: log(1/DR). (c) Blue: log(1/DT); red: KM transform of DR.
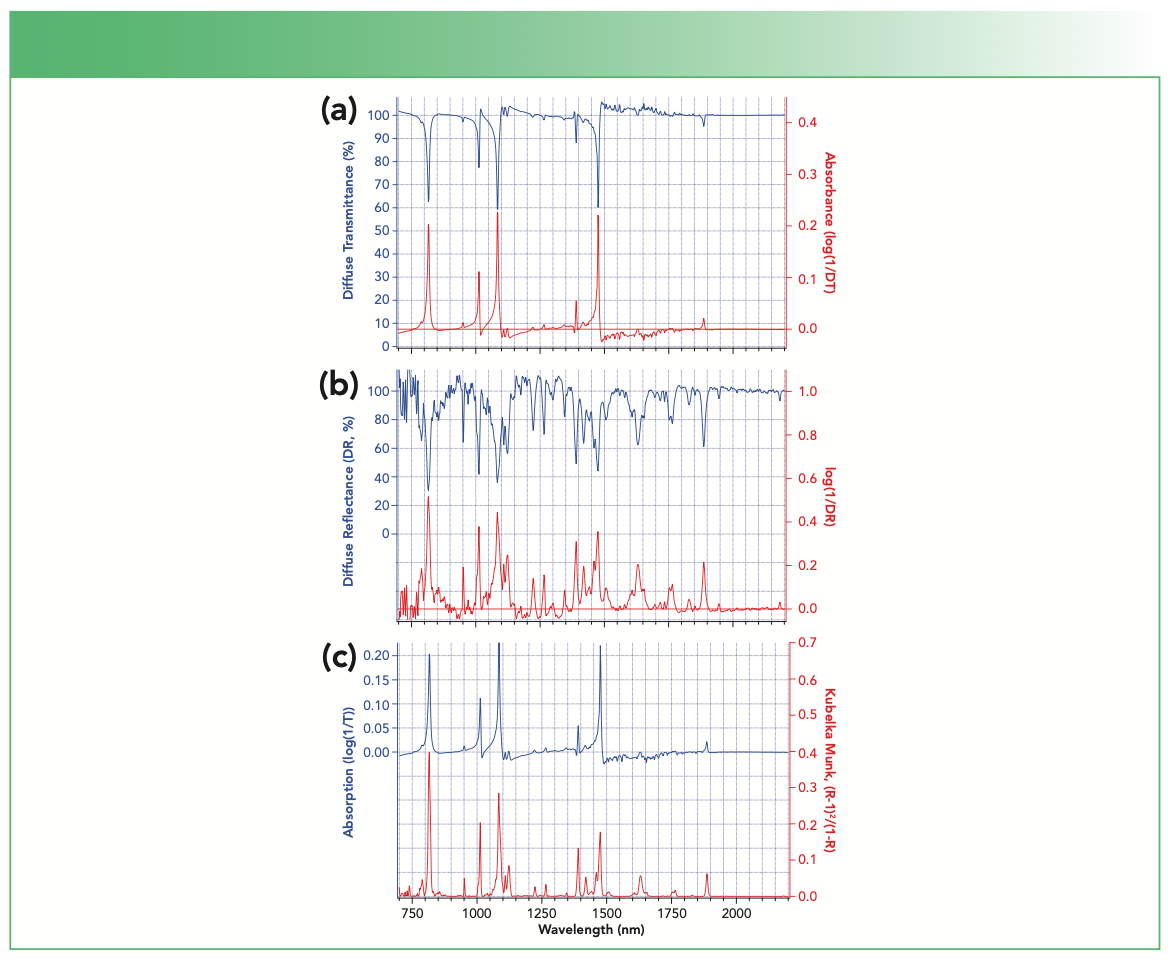
The DT spectrum shown as the blue curve in Figure 2a is closest in appearance to an ordinary transmission spectrum of 14DCB in solution or vapor. The ordinary logarithmic transformation into “absorbance” is illustrated in red in Figure 2a. Both transmission and absorption presentations show minor contamination by water vapor in the 1400–1800 cm-1 region. More instructively, each of the absorption bands in the spectra are distorted by dispersion artifacts caused by the refractive index profile of the 14DCB crystals around the molecular infrared absorption bands of 14DCB. These artifacts typically cause the high energy side of the absorption bands to be abrupt, with tailing of each peak on the low frequency side, and are expected to change with particle size in a way that can make measurements irreproducible. DT spectra of solids, while having some similarities to ordinary transmission spectra in solution, can become hard to recognize under some conditions as peak positions may shift slightly and the apparent intensity of bands may become distorted by strongly sloping baseline artifacts.
The exact same pellet used for the measurements of Figure 2a was also used to measure DR, shown as the blue curve in Figure 2b. Because the sample exhibits a minimum reflectance close to 30%, further dilution would probably improve the quality of these spectra. However, the most obvious differences between the blue curves of Figures 2a and 2b are: (a) there are many more bands observed in the DR spectrum than in the DT spectrum, and (b) the dispersion artifacts present in DT are not present or are minor in DR. The reason that more bands appear is simple. According to the KM model, the penetration depth and effective path length in DR increases when there is weak absorption. The increased path length allows weak peaks to gain significant strength in DR relative to a conventional transmission measurement where the path length is nominally independent of absorption. Close inspection reveals that minor bands observed in Figure 2a obtain significant intensity in Figure 2b, while minor bands observed in Figure 2b are too small to be observed in Figure 2a. In an ordinary absorption measurement, we usually expect isotopic and combination bands to be distinctly weaker than strong fundamental absorption bands of the major form. This is not always so clear-cut in DR spectroscopy, which may emphasize many weaker peaks as shown in Figure 2b.
It is relevant to note here that most spectrometers provide the ability to calculate either the log(1/DR) pseudo-absorption spectrum or the KM transformation of the DR spectrum. For those unfamiliar with the KM transformation and model, it can be tempting to use or present the log(1/DR) form (the red spectrum in Figure 2b) as if it were a true absorption spectrum. However, this transformation has no meaning or significance in DR spectroscopy. It does not produce a spectrum that follows the Beer-Lambert law, for instance, and it does a poor job even approximating the actual absorption spectrum of the material being studied. This transformation is included here purely to make the point that the log(1/DR) transformation has no theoretical foundation, purpose or usefulness in DR spectroscopy at all.
Figure 2c repeats the absorption transform of the diffuse transmission spectrum in blue together with the KM transform of the DR spectrum in red. The KM transform provides a spectrum that more closely resembles the absorption spectrum above it than the log(1/DR) transform. The KM transformed spectrum has band intensities that are somewhat different from, but provide a much better representation of, the true absorption spectrum compared to the log(1/DR) transformed spectrum, while avoiding the significant dispersion artifacts observed in the diffuse transmission spectrum.
DR spectroscopy is a convenient approach to measuring many types of solid samples that are not well suited to ordinary transmission measurements, and consequently is widely utilized. The most common interpretation of DR spectra uses the KM transformation, which we have shown is improved when scattering is relatively strong for a variety of reasons. If the KM transformation has too many assumptions and uncertainties for the user’s tastes, it would be preferable to present the untransformed experimental reflectance spectrum instead of the meaningless log(1/DR) transformation.
Reference
(1) Myrick, M.L.; Baranowski, M.; Brooke, H.; Morgan, S.L.; McCutcheon, J. The Kubelka-Munk Formula Revisited. Appl. Spec. Rev. 2011, 46, 140–165. DOI: 10.1080/05704928.2010.537004
Michael L. Myrick, Caitlyn M. English, and Zechariah B. Kitzhaber are with the Department of Chemistry and Biochemistry at the University of South Carolina, in Columbia, South Carolina. Direct correspondence to: myrick@mailbox.sc.edu●


Childhood Obesity Serum Samples Analyzed Using Fourier Transform Infrared Spectroscopy
April 9th 2024A group of scientists led by Zozan Guleken of the Gaziantep University of Science and Technology in Gaziantep, Turkey looked into the blood serum composition of childhood obesity (CO) tissues using Fourier transform infrared (FT-IR) spectroscopy.


