Colorimetric Discrimination of Pd2+ and Hg2+ Ions in Solvent and Solid-Film State Using Organic Acid-Assisted Green Synthesized Silver Nanoparticles
In this study, a colorimetric discrimination of Pd2+ and Hg2+ ions in the solvent and solid film states in one silver nanoparticles (AgNPs) sensing system is presented. First, silver nanoparticles were prepared by reducing AgNO3 with sodium borohydride in the presence of chitosan and different organic acids, including acetic acid, propanedioic acid, and citric acid. The addition of different organic acids allowed for the surface plasmon resonance (SPR) intensity and size distribution of AgNPs to be adjusted. Chitosan acts as a stabilizer and complexing agent, endowing AgNPs excellent film-forming properties. Then, the chitosan-stabilized AgNPs in the solvent and solid-film state are used to detect metal ions. In the presence of Hg2+ and Pd2+ ions, the color of the AgNP solution changed rapidly from pale yellow to colorless and light brown, respectively. The characteristic SPR peaks of the AgNPs also disappeared completely, and the solid films of AgNPs with a yellowish-brown color also change rapidly to colorless and dark brown with the addition of Hg2+ and Pd2+ ions, respectively. The discrimination of Hg2+ and Pd2+ ions can be clearly observed in both the solvent and the solid film state. However, the addition of other metal ions cannot change the color of the AgNPs.
With the rapid expansion of industry, global environmental pollution is becoming more serious. Heavy-metal ion contamination is one of the most concerning types of environmental pollution. These contaminants can cause acute or chronic toxicities to human body, leading to various diseases (1). For example, palladium has the propensity to bind to deoxyribonucleic acid (DNA), thiol-containing amino acids, proteins, and other biomolecules, which disturbs some cellular processes and causes serious physiological disorders (2,3). Mercury exposure can lead to severe damage to the central nervous and endocrine systems, resulting in deleterious effects on several important organs, such as the brain and kidneys (4,5). Thus, the fast and convenient monitoring of palladium and mercury is important for waste management, environmental protection, and public health. Conventional analytical methods for palladium and mercury detection include atomic absorption spectroscopy (AAS) and atomic emission spectroscopy (AES) (6,7), solid phase microextraction–high performance liquid chromatography (SPME–HPLC) (8,9), inductively coupled plasma–mass spectrometry (ICP-MS) (10,11), ICP–atomic emission spectroscopy (ICP-AES) (12,13), electrochemistry (14,15) and adsorption dissolution voltammetry (16,17). These instrumental techniques can provide direct and quantitative information about palladium and mercury concentrations, but these techniques are time-consuming, costly, and not well-suited for the quick detection of palladium and mercury in the field. Fluorimetric and colorimetric methods provide a useful alternative for the detection of mercury and palladium because of their relative simplicity, cost-effectiveness, and nondestructive nature (18). Fluorescent sensors for Hg2+ and Pd2+ ions reported are mainly based on the coordination mechanism of organic probes with Hg2+ and Pd2+ ions (19–21), in which the fluorescence signals of the probes are always quenched because of the efficient spin-orbit coupling and non-radiation deactivation of the excited states of Hg2+ and Pd2+ ions (22–24). However, they suffer from different degrees of interference with other transition metal ions, and most of these sensing systems possess disadvantages, such as requiring high synthetic expertise to prepare multistep and expensive fluorescence probes and laborious purification steps.
Colorimetric methods based on the noble metal nanoparticles, which involve the naked-eye detection of a change in color caused by the distance-dependent surface plasma resonance (SPR) phenomena, have been developed for various heavy metal ions (25). For the detection of Hg2+ ions, most of the colorimetric sensors are based on AuNPs (26). The interaction between AuNPs and Hg2+ ions results in the aggregation of AuNPs with the color change from red to an aggregation-induced purple or colorless (27,28) or the anti-aggregation of AuNPs with a color change from purple to red (29). Although AuNPs as colorimetric sensors are promising tools for the detection of Hg2+, they usually require careful modification of AuNPs with DNA or thiol-containing organic molecules under precise experimental conditions, which makes them time-consuming and costly. Compared with AuNPs, AgNPs can also be Hg2+ colorimetric sensors, which are mostly based on the redox reaction between AgNPs and Hg2+ (30–32) with a color change from yellow to colorless. For colorimetric sensing of Pd2+ ions, Anwar and coworkers reported cationic pyrazinium thioacetate-stabilized AuNPs serving as an effective Pd2+ ion naked-eye sensor with color changing from pink to colorless (33). However, AgNPs have never been exploited as Pd2+ ion colorimetric sensors (34). Moreover, the colorimetric sensing of Pd2+ and Hg2+ ions in one noble metal nanoparticles sensing system has never been realized (35).
In this study, we presented a colorimetric discrimination of Pd2+ and Hg2+ ions in one AgNP sensing system for the first time. By introducing the biopolymer chitosan as the stabilizer and complexing agent, this system was able to distinguish Pd2+ and Hg2+ ions simultaneously in the solvent and solid-film state. First, silver nanoparticles were prepared by reducing AgNO3 with sodium borohydride in the presence of chitosan and different organic acids, including acetic acid (AA), propanedioic acid (PA), and citric acid (CA). It was demonstrated that the addition of different organic acids could finely adjust the SPR intensity and size distribution of AgNPs. This study also revealed for the first time the effect of organic acid in the synthetic procedure of AgNPs. Chitosan, which is a biocompatible polysaccharide with largely amount of free amino and hydroxyl groups exhibiting unique polycationic, chelating, and film-forming properties, acted as a stabilizer and complexing agent, leading to the formation of composite solid films (36). Then, the chitosan-stabilized AgNPs in the solvent and solid-film states were used to detect metal ions. In the presence of Hg2+ and Pd2+ ions, the color of the AgNP solution changes rapidly from pale yellow to colorless and light brown, respectively. Correspondingly, the characteristic SPR peaks of the AgNPs completely disappeared. The solid film of AgNPs with its yellowish-brown color also changed rapidly to colorless and dark brown with the addition of the Hg2+ and Pd2+ ions, respectively. The discrimination of Hg2+ and Pd2+ ions was clearly observed in both the solvent and the solid-film state. However, the addition of other metal ions did not change the color the AgNPs. It was further revealed that this method showed a linear response range of 50–90 μm and 100–300 μm for Hg2+ and Pd2+. The limit of detection (LOD) was estimated to be 2.26 x 10⁻⁷ M and 1.05 x 10⁻⁶ M for Hg2+ and Pd2+, respectively. The colorimetric discrimination of the Hg2+ and Pd2+ ions in solvent and solid film provided a new avenue for simultaneous onsite detection metal ions by the naked eye.
Results and Discussion
Preparation of AgNPs
Colloidal silver nanoparticles were prepared by reducing AgNO3 using sodium borohydride with chitosan as the stabilizer and complexing agent in the presence of different kinds of organic acids (AA, PA, or CA) at room temperature, and the resulting solutions were labeled as AgAA-CHIT, AgPA-CHIT, and AgCA-CHIT, respectively. The first optical indication of AgNP formation was provided by the color change of the solution from colorless to pale yellow, and it was further monitored by UV-vis spectroscopy. As shown in Figure 1, the absorbance intensity follows the order of AgPA-CHIT > AgCA-CHIT > AgAA-CHIT, suggesting that these organic acids participate in the reaction, and the reduction rate of AgI to Ag0 is strongly affected by the nature of the organic acid (37). When preparing the three organic acid solution with the same concentration (0.20 mol/L), the pH values were 1.90, 2.26, and 3.01 for PA, CA, and AA, respectively, implying that a pH effect cannot be ruled out in the formation of AgNPs. PA-CHIT with a lower pH and a higher degree of protonation of amino groups of chitosan helped promote the reduction of the silver precursor (38), leading to a higher absorption intensity.

, AgCA-CHIT (red), and AgAA-CHIT (black).")
FIGURE 1: UV-vis spectra of chitosan-stabilized AgNP solutions: AgPA-CHIT (blue), AgCA-CHIT (red), and AgAA-CHIT (black).
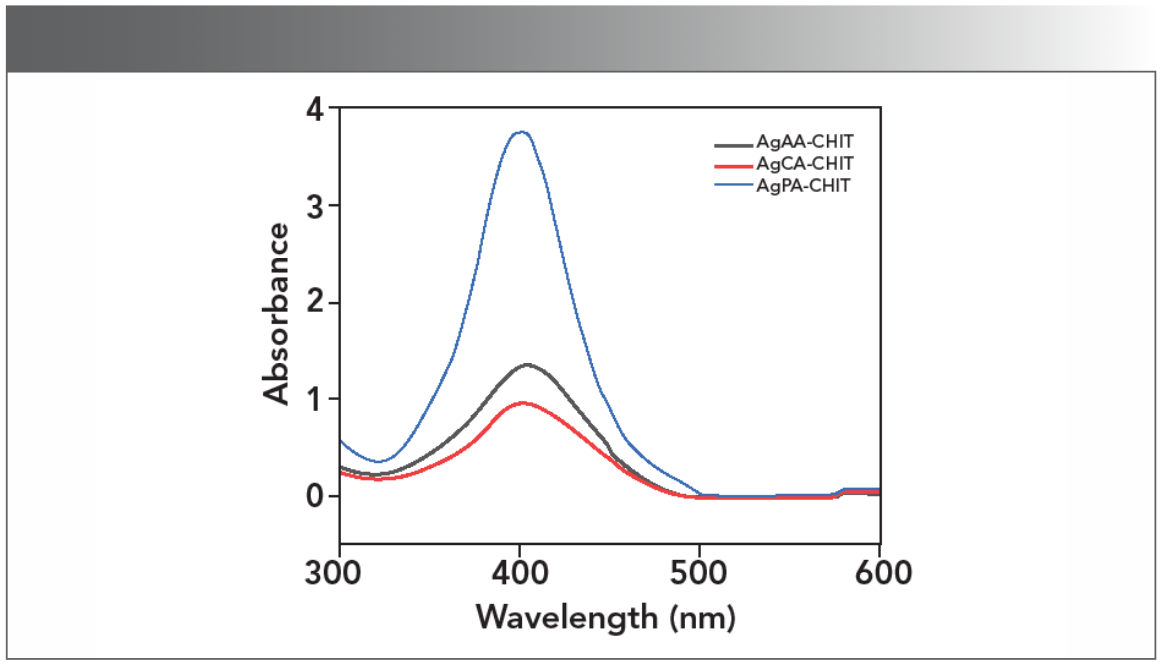
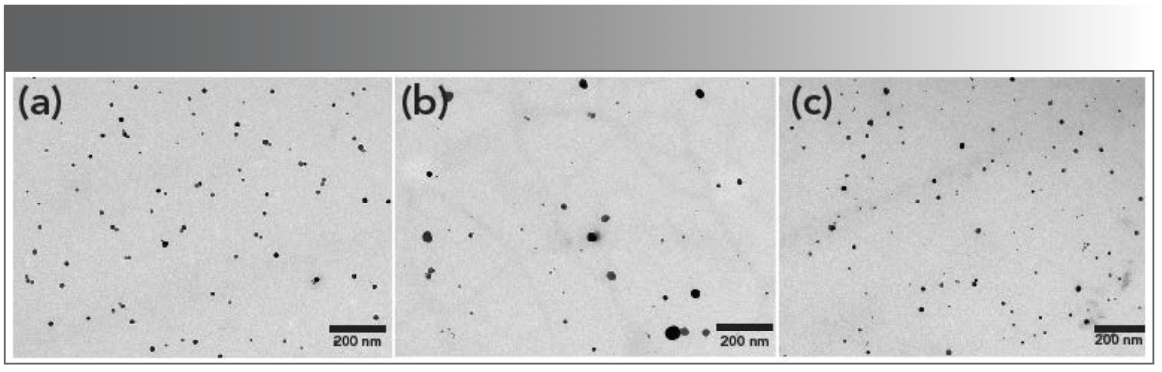
As displayed in Figure 1, the formation of metallic AgNPs in the AgAA-CHIT and AgCA-CHIT solutions was confirmed by the appearance of the SPR band at 404 nm with the similar intensity in the corresponding UV-vis spectra. According to the SPR peak position and intensity, it was estimated that the average diameter of the AgNPs was 27 nm (39) for both samples (Table SI). When the AgNPs were synthesized in the chitosan-propanedioic acid solution, different behavior was observed. The SPR band showed a slight blue shift to 398 nm, and the absorption intensity dis- played significant enhancement (Figure 1), which is indicative of the smaller and higher concentration of metal nanoparticles. The size and morphology of AgNPs were estimated by transmission electron microscopy (TEM) and are displayed in Figure 2a, which shows the presence of polydispersed spherical nanoparticles in the size range of 11–18 nm. Compared with AgAA-CHIT and AgCA-CHIT (Figure 2b–2c), AgPA-CHIT particles (Figure 2a) have better dispersion, particle size uniformity, and homogeneous morphology.

 AgPA-CHIT, (b) AgCA-CHIT, and (c) AgAA-CHIT.")
FIGURE 2: TEM images of (a) AgPA-CHIT, (b) AgCA-CHIT, and (c) AgAA-CHIT.


Interaction of Silver Nanoparticles with Various Metal Ions
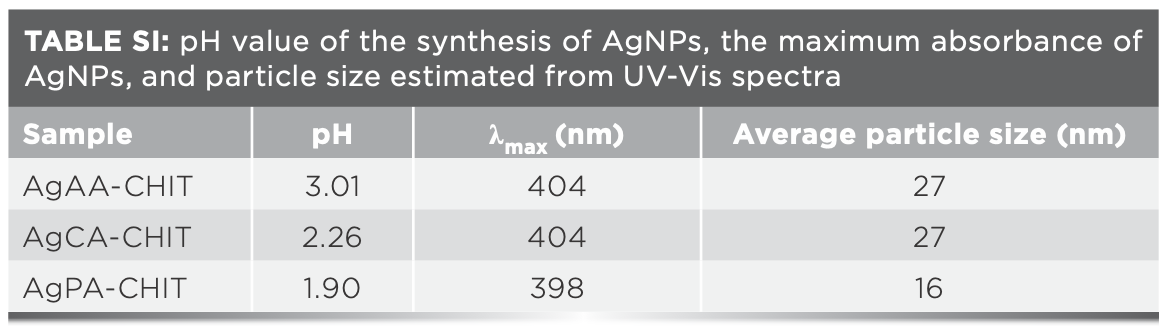
Because the silver nanoparticles synthesized in the presence of propanedioic acid have better dispersion, particle size uniformity, and absorption intensity, AgPA-CHIT particles were chosen to evaluate the response to various metal ions. The UV-vis absorption spectra and color change of AgPA-CHIT were taken in the presence of different metal ions, including Al3+, Mg2+, Cd2+, Zn2+, Co2+, Ni2+, Mn2+, Cu2+, Pd2+, and Hg2+. Figure 3 shows the effect of various metal ions on the freshly prepared AgPA-CHIT particles. The solutions in contact with Hg2+ and Pd2+ changed from pale yellow to colorless and light brown, respectively (Figure 3a), and the corresponding SPR band completely disappeared (Figure 3b). However, the effect of other metal ions on the color and SPR band of AgPA-CHIT particles was negligible. The color difference of AgPA-CHIT with Hg2+ and Pd2+ provided a method to visibly detect these two metal ions simultaneously with the naked eye. Moreover, the introduction of biopolymer chitosan as the stabilizer and complexing agent endowed the AgNPs with good film-forming properties. Therefore, the AgPA-CHIT film was further prepared to evaluate the metal selectivity. As shown in Figure 3c, when different metal ions with the concentration of 10−3 M were added to the AgPA-CHIT films, only the films contacting with the Hg2+ and Pd2+ ions were significantly different with the color changing from yellowish brown to colorless and brownish-black, respectively (the visualization images are taken on white paper, so the colorless film looks white). Color changes in the state of solution and film can be observed within one minute. The results revealed that discrimination of the Hg2+ and Pd2+ ions can be clearly observed in both the solvent and the solid-film state. Thus, it is suggested that the AgPA-CHIT particles with significant Hg2+ and Pd2+ differentiation properties could serve as a fast, simple, and convenient onsite naked-eye probe for Hg2+ and Pd2+ ions recognition.

 Photographs and (b) UV-vis spectra of AgPA-CHIT with the addition of different metal ions. (c) Photographs of different metal ions dripping onto the AgPA-CHIT solid film.")
FIGURE 3: (a) Photographs and (b) UV-vis spectra of AgPA-CHIT with the addition of different metal ions. (c) Photographs of different metal ions dripping onto the AgPA-CHIT solid film.
Sensitivity and UV-vis Titration of Hg2+ and Pd2+ Ions
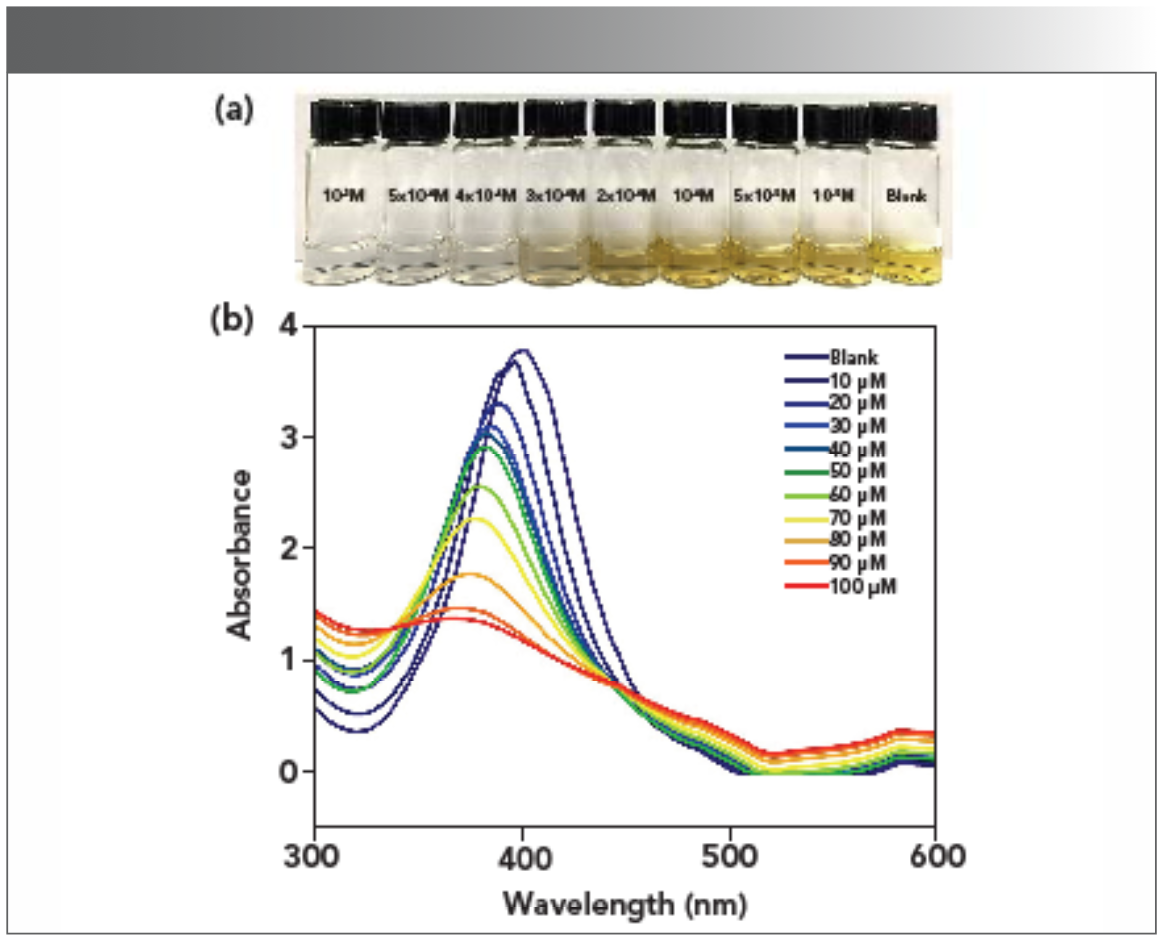
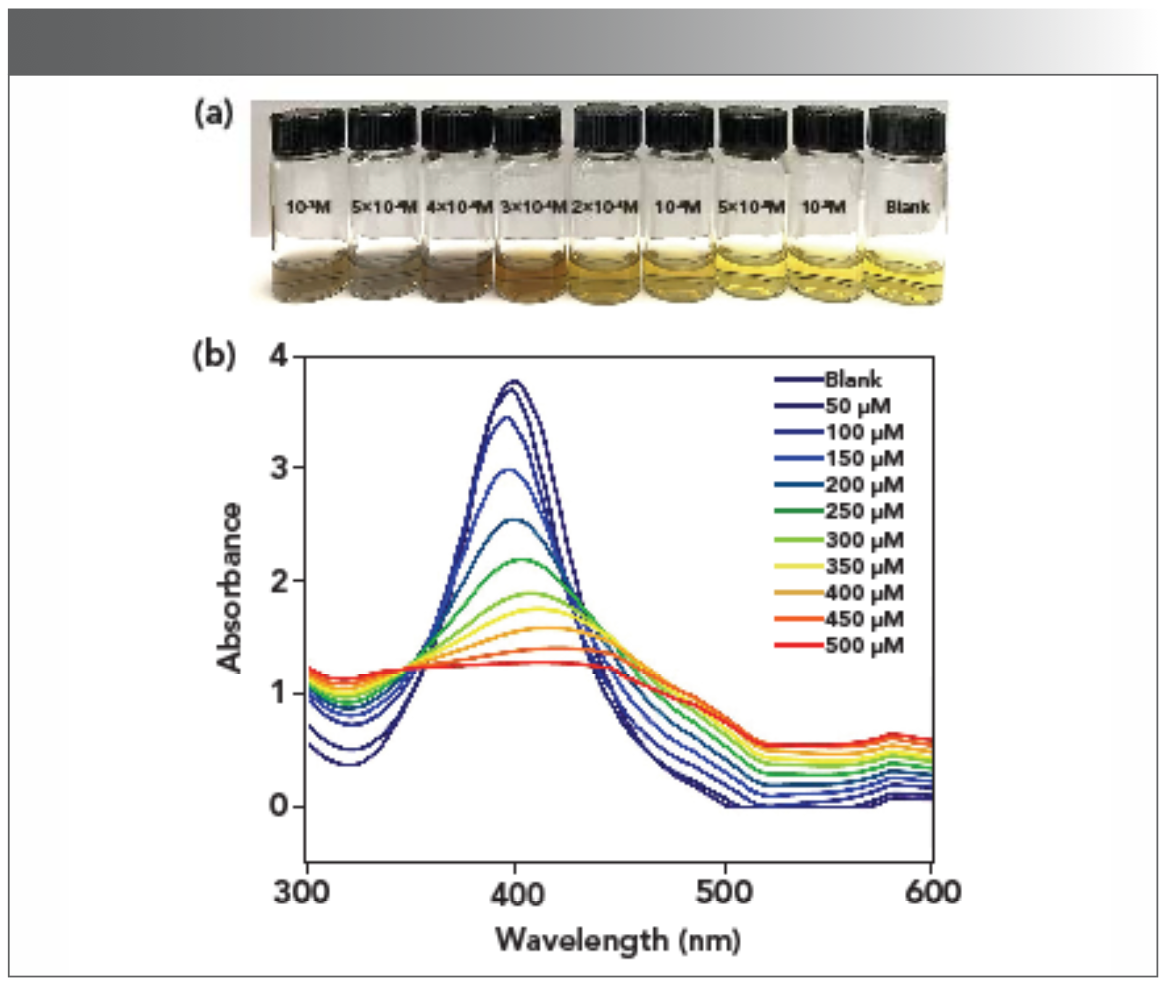
To further investigate the recognition mechanism of AgPA-CHIT to the Hg2+ and Pd2+ ions, the UV-vis titration and TEM images were further tested. As shown in Figure 4 and 5, the characteristic SPR band of AgPA-CHIT was observed at 398 nm, and the color of the solution is pale yellow in the absence of Hg2+ and Pd2+. Increasing the concentration of Hg2+ to AgPA-CHIT, the color of the solution decreased, accompanying with the blue shifting and broadening of the SPR band. Finally, the solution turned colorless after the addition of 400 μm of Hg2+ and the SPR band almost completely disappeared. When different concentrations of Pd2+ to AgPA-CHIT was added, the color of the solution deepened gradually, accompanying the broadening and red shifting of the SPR band and finally turning to light brown after the addition of 400 μm of Pd and the SPR band almost completely disappeared.

 Photographs and (b) UV-vis spectra of AgPA-CHIT with different concentrations of Hg2+.")
FIGURE 4: (a) Photographs and (b) UV-vis spectra of AgPA-CHIT with different concentrations of Hg2+.

 Photographs and (b) UV-vis spectra of AgPA-CHIT with different concentrations of Pd2+.")
FIGURE 5: (a) Photographs and (b) UV-vis spectra of AgPA-CHIT with different concentrations of Pd2+.
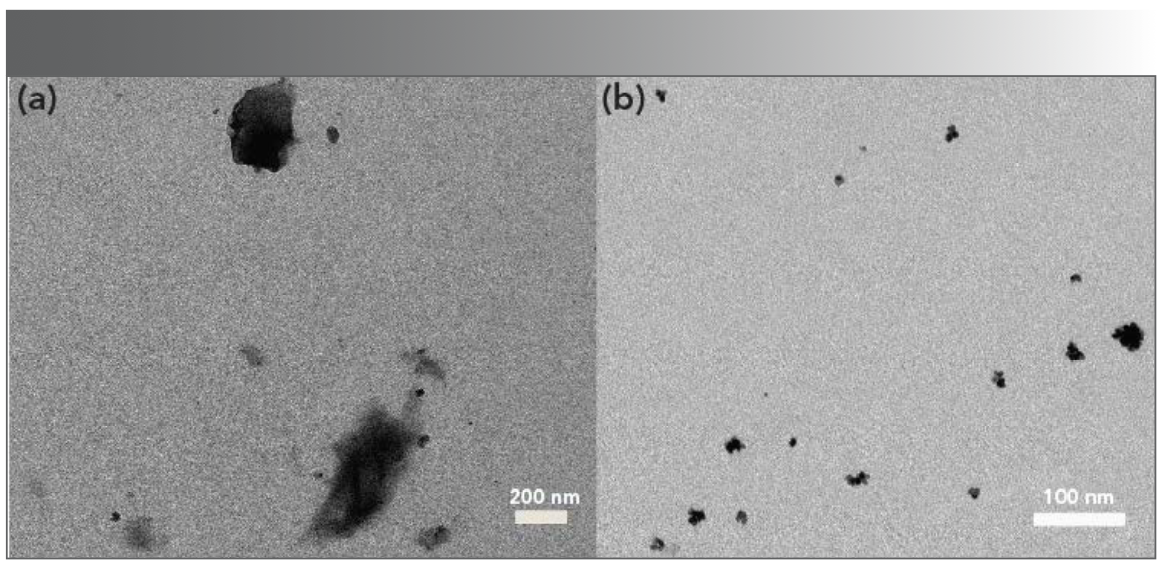
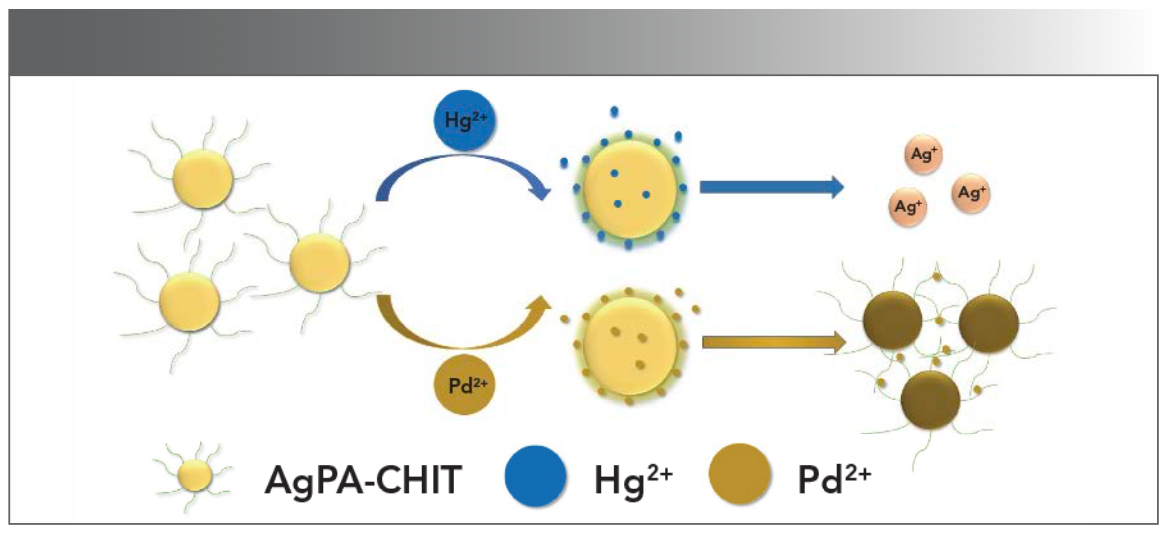
To obtain further information about the characteristic of AgPA-CHIT in the absence and presence of Hg2+ and Pd2+, the samples were analyzed using TEM. The corresponding TEM images are displayed in Figures 2a and 6. It can be seen that well dispersed silver nanoparticles are presented in Figure 2a. After the addition of Hg2+ to the AgPA-CHIT solution, the nanoparticles completely disappeared, which might be because of the redox reaction between Hg2+ and zero-valent silver with the standard potential of 0.85 V (Hg2+/ Hg) and 0.8 V (Ag+/Ag), respectively (40). It was proposed that after the addition of Hg2+ ions to the freshly prepared AgPA-CHIT, mercury (II) ions bound to the surface of AgPA-CHIT particles to move the biological stabilizer chitosan away from the silver surface, leading to a redox reaction between the silver and mercury ions (Scheme 1). This redox reaction may account for the blue shift of the SPR band of AgNPs. The addition of Pd2+ to the AgPA-CHIT solution caused the nanoparticles agglomerated to form larger ones (Scheme 1), which was also in accordance with the red shift of the SPR bands.

 Hg2+ and (b) Pd2+ ions.")
FIGURE 6: TEM images of AgPA-CHIT after recognition of (a) Hg2+ and (b) Pd2+ ions.


SCHEME 1: Proposed mechanism for AgPA-CHIT to discriminate Hg2+ and Pd2+ ions.
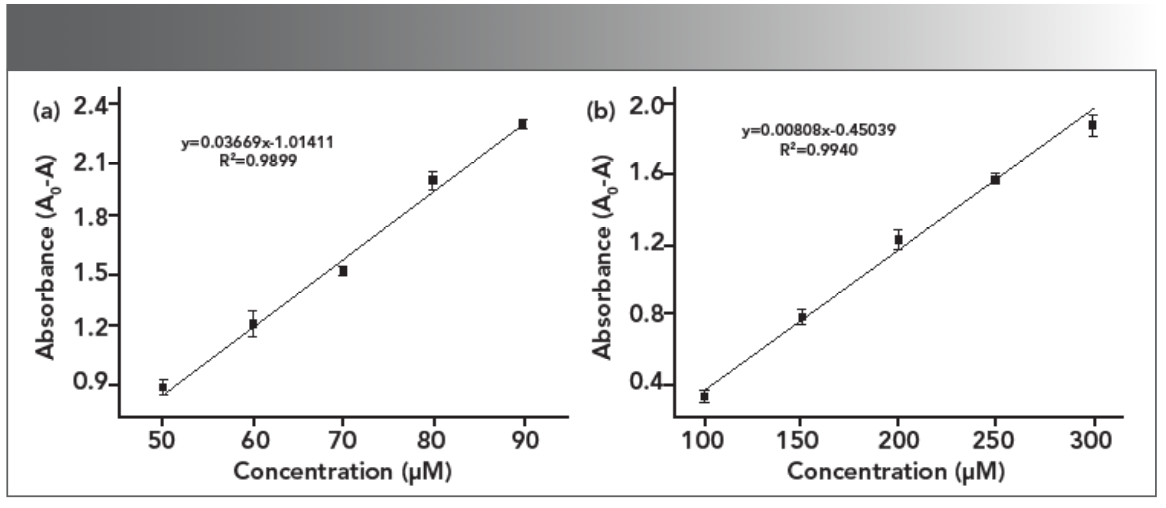
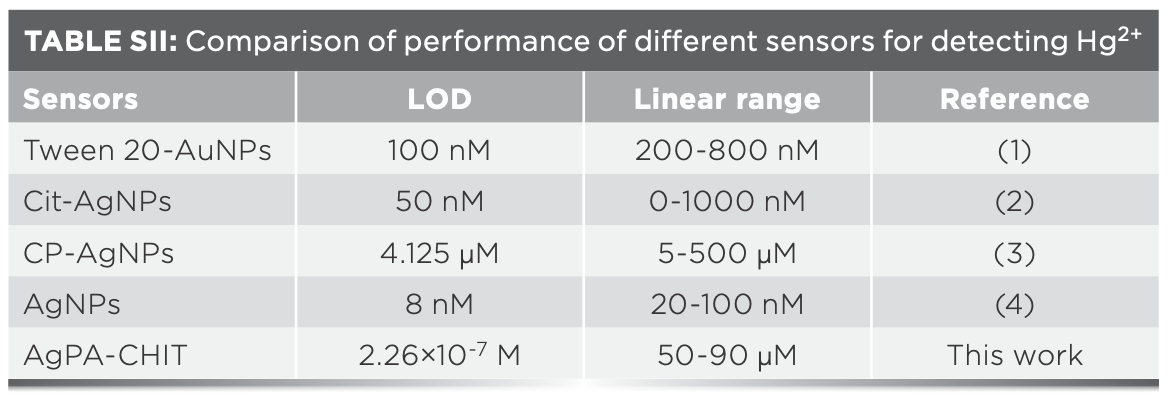
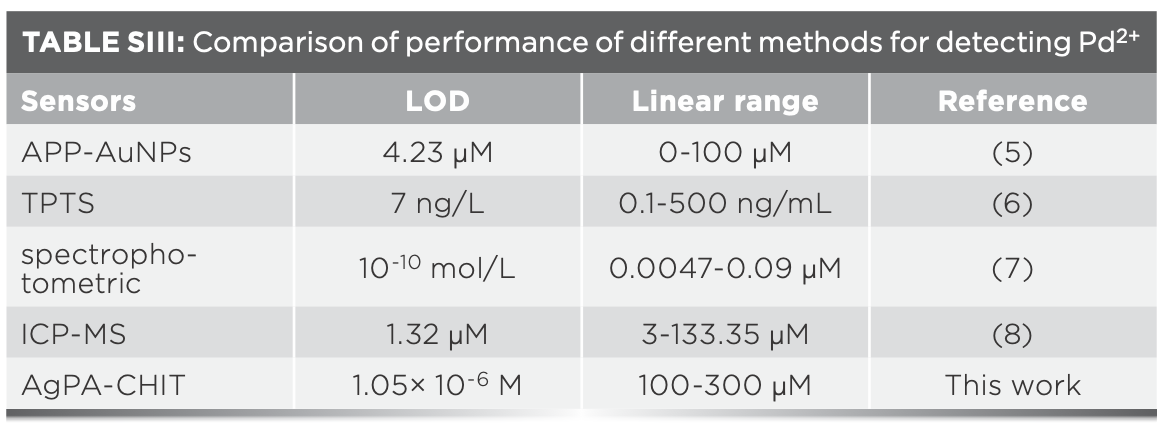
The limit of detection (LOD) for the Hg2+ and Pd2+ ions was further determined by using the characteristic SPR peak of AgPA-CHIT. Three repeated experiments demonstrated that the concentration of both metal ions <10 μm did not change the color of AgPA-CHIT. As shown in Figure 4b and 5b, the absorption peaks of AgPA-CHIT decreased by increasing the concentration of the Hg2+ and Pd2+ ions. There is a linear relationship between the absorption intensity changes and the linear response concentration ranges, which are 50–90 μm and 100–300 μm for Hg2+ and Pd2+, respectively. Thus, it was calculated that the AgPA-CHIT could be used for the colorimetric detection of Hg2+ and Pd2+ with the LODs at 2.26 × 10⁻⁷ M and 1.05 × 10⁻⁶ M, respectively (Figure 7). Compared with other sensors and methods for sensing of Hg2+ or Pd2+ (Table SII and SIII), our proposed methods required neither careful modification of AgNPs nor a high cost of instrumentation. Moreover, the simultaneous discrimination of Hg2+ or Pd2+ has never been realized by the reported methods. The above results proved that chitosan-stabilized AgPA-CHIT can serve as a fast, simple, and convenient onsite naked-eye probe for Hg2+ and Pd2+ ions.

 Hg2+ and (b) Pd2+ ions.")
FIGURE 7: Plot of absorbance intensity at 398 nm versus the concentration of (a) Hg2+ and (b) Pd2+ ions.


Determination of Hg2+ and Pd2+ Ions in Water Samples
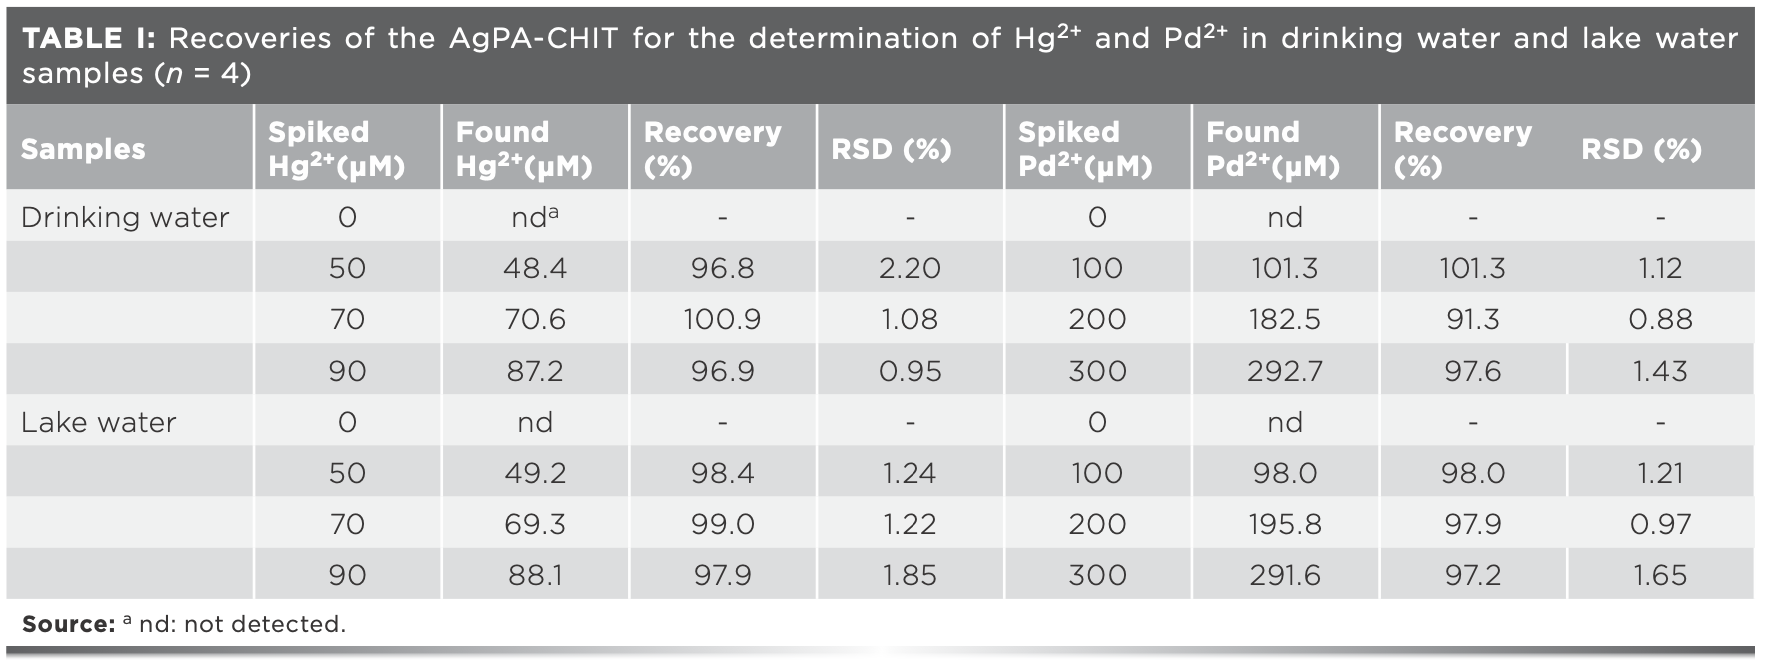
To evaluate the practical application of AgPA-CHIT, drinking water and lake water samples from the Hongzi Lake in Qingdao Agricultural University were collected. The water samples were first filtered through a 0.2 μm membrane to remove any suspensions and then spiked with different concentrations of the Hg2+ and Pd2+ standard solution within the linear ranges. Finally, the spiked Hg2+ and Pd2+ ions were recovered by the proposed methods. The analytical results are displayed in Table I. The recoveries for the selective detection of Hg2+ were in the range of 96.8–100.9%, and Pd2+ was in the range of 91.3–101.3%. The relative standard deviations (RSD) of the four measurements were all lower than 2.2%. These results suggested that the proposed method has great potential for the sensing of Hg2+ and Pd2+ in environmental samples.


Conclusions
In conclusion, a simple, cost-effective, and highly selective onsite colorimetric detection method for Pd2+ and Hg2+ ions was developed by using green synthesized AgNPs, which was modified by adding organic acid and chitosan. The organic acid with a different reducing power and dissociation degree can tune the synthesis procedure of AgNPs and lead to nanoparticles with different SPR intensities and size distributions. The biological macromolecule chitosan served as a stabilizer and complexing agent, which endowed the system with excellent film-forming properties. Thus, in addition to the color change of AgNPs from pale yellow to colorless and light brown when adding the Hg2+ and Pd2+ ions, the obtained solid film with obvious color changes can also act as a convenient onsite selective detection method of Hg2+ and Pd2+ ions. This method showed high selectivity to Hg2+ and Pd2+ than other metal ions with detection limits of 2.26 × 10⁻⁷ M and 1.05 × 10⁻⁶ M, respectively. The detection of Hg2+ and Pd2+ in real water samples also revealed good detection recoveries. The colorimetric discrimination of Hg2+ and Pd2+ ions in solvent and solid film provides a new avenue for simultaneous onsite detection of metal ions by the naked eye.
Conflicts of Interest
There are no conflicts to declare.
Acknowledgments
We gratefully acknowledge the financial support from the National Science Foundation of China (21403122) and High-level Science Foundation of Qingdao Agricultural University (6631405). We thank the Central Laboratory of QAU for the TEM test.
References
(1) M. B. Gumpu, S. Sethuraman, U.M. Krishnan, and J.B.B. Rayappan, Sensor. Actuat. B-Chem. 213, 515–533 (2015).
(2) M. Santra, S.K. Ko, I. Shin, and K.H. Ahn, Chem. Commun. 46, 3964–3966 (2010).
(3) R. Balamurugan, J.H. Liu, and B.T. Liu, Coordin. Chem. Rev. 376, 196–224 (2018).
(4) D.W. Boening, Chemosphere 40, 1335–1351 (2000).
(5) U. Haldar and H.I. Lee, ACS Appl. Mater. Inter. 11, 13685–13693 (2019).
(6) B. Liu, Y. Bao, F. Du, H. Wang, J. Tian, and R. Bai, Chem. Commun. 47, 1731–1733 (2011).
(7) Z.L. Zhu, G.C.Y. Chan, S.J. Ray, X.R. Zhang, and G.M. Hieftje, Anal. Chem. 80, 8622–8627 (2008).
(8) V. Kaur, J.S. Aulakh, and A.K. Malik, Anal. Chim. Acta. 603, 44–50 (2007).
(9) X.Y. Cui, Z.Y. Gu, D.Q. Jiang, Y. Li, H.F. Wang, and X.P. Yan, Anal. Chem. 81, 9771–9777 (2009).
(10) K. Liu, X.L. Gao, L. Li, C.T.A. Chen, and Q.G. Xing, Chemosphere 212, 429–437 (2018).
(11) Z.H. Yu, J.Q. Sun, M. Jing, X. Cao, F. Lee, and X.R. Wang, Food Chem. 119, 364–367 (2010).
(12) M.R. Jamali, Y. Assadi, F. Shemirani, and M. Salavati-Niasari, Talanta 71, 1524–1529 (2007).
(13) L. Hakim, A. Sabarudin, K. Oshita, M. Oshima, and S. Motomizu, Talanta 76, 1256–1260 (2008).
(14) M. Velmurugan, B. Thirumalraj, S.M. Chen, F.M.A. Al-Hemaid, M. Ajmal Ali, and M.S. Elshikh, J. Colloid. Interf. Sci. 485, 123–128 (2017).
(15) Y. Yang, M. Kang, S. Fang, M. Wang, L. He, J. Zhao, H. Zhang, and Z. Zhang, Sensor. Actuat. B-Chem. 214, 63–69 (2015).
(16) G.L. Wen, W. Zhao, X. Chen, J.Q. Liu, Y. Wang, Y. Zhang, Z.J. Huang, and Y.C. Wu, Electrochim. Acta. 291, 95–102 (2018).
(17) X.C. Fu, X. Chen, Z. Guo, C.G. Xie, L.T. Kong, J.H. Liu, and X.J. Huang, Anal. Chim. Acta. 685, 21–28 (2011).
(18) H.Y. Li, H.Y. Lin, W.X. Lv, P.P. Gai, and F. Li, Biosens. Bioelectron. 165, 112336 (2020). https://doi.org/10.1016/j.bios.2020.112336.
(19) A.K. Mandal, M. Suresh, E. Suresh, S.K. Mishra, S. Mishra, and A. Das, Sensor. Actuat. B-Chem. 145, 32–38 (2010).
(20) G.U. Reddy, F. Ali, N. Taye, S. Chattopadhyay, and A. Das, Chem. Commun. 51, 3649–3652 (2015).
(21) C. Song, X. Zhang, C. Jia, P. Zhou, X. Quan, and C. Duan, Talanta 81, 643–649 (2010).
(22) X. Li, Y. Wu, Y. Liu, X. Zou, L. Yao, F. Li, and W. Feng, Nanoscale 6, 1020–1028 (2014).
(23) J. Fan, K. Guo, X. Peng, J. Du, J. Wang, S. Sun, and H. Li, Sensor. Actuat. B-Chem. 142, 191–196 (2009).
(24) X. Guo, X. Qian, and L. Jia, J. Am. Chem Soc. 126, 2272–2273 (2004).
(25) A. Amirjani and D.F.J.T. Haghshenas, Talanta 192, 418–423 (2019).
(26) J. Du, L. Jiang, Q. Shao, X. Liu, R.S. Marks, J. Ma, and X. Chen, Small. 9, 1467–1481 (2013).
(27) C.Y. Lin, C.J. Yu, Y.H. Lin, and W.L. Tseng, Anal. Chem. 82, 6830–6837 (2010).
(28) Z. Zhang, F. Zhang, P. He, X. Zhang, and W. Song, Mikrochim. Acta. 186, 551 (2019).
(29) J.R. Kalluri, T. Arbneshi, S.A. Khan, A. Neely, P. Candice, B. Varisli, et al, Angew. Chem. Int. Ed. 121, 9848–9851 (2009).
(30) G.L. Wang, X.Y. Zhu, H.J. Jiao, Y.M. Dong, and Z.J. Li, Biosens. Bioelectron. 31, 337–342 (2012).
(31) A. Ullah, I. Ali, F. Ahmed, S. Khan, M.R. Shah, and F. Shaheen, J. Mol. Liq. 296, 112095 (2019). https://doi.org/10.1016/j.molliq.2019.112095.
(32) B. Janani, A. Syed, A.M. Thomas, N. Marraiki, S. Al-Rashed, A.M. Elgorban, et al, J. Mol. Liq. 311, 113281 (2020). https://doi.org/10.1016/j.molliq.2020.113281.
(33) A. Anwar, A. Minhaz, N.A. Khan, K. Kalantari, A.B.M. Afifi, and M.R. Shah, Sensor. Actuat. B-Chem. 257, 875–881 (2018).
(34) P. Veerakumar, V. Veeramani, S.M. Chen, R. Madhu, and S.B. Liu, ACS Appl. Mater. Inter. 8, 1319–1326 (2016).
(35) A. Shahat and S. Trupp, Actuat. B-Chem. 245, 789–802 (2017).
(36) Y. Guo, X. Sun, Y. Liu, W. Wang, H. Qiu, and J. Gao, Carbon 50, 2513–2523 (2012).
(37) L. Rastogi, R.B. Sashidhar, D. Karunasagar, and J. Arunachalam, Talanta 118, 111–117 (2014).
(38) G.D. Carlo, A. Curulli, R.G. Toro, C. Bianchini, T.D. Caro, G. Padeletti, D. Zane, and G.M. Ingo, Langmuir 28, 5471–5479 (2012).
(39) D. Paramelle, A. Sadovoy, S. Gorelik, P. Free, J. Hobley, and D.G. Fernig, Analyst 139, 4855–4861 (2014).
(40) K. Farhadi, M. Forough, R. Molaei, S. Ha- jizadeh, and A. Rafipour, Sensor. Actuat. B-Chem. 161, 880–885 (2012).
Kaiyu Zhang, Yuxin Sang, Qinxing Sun, and Weina Li are with the College of Chemistry and Pharmaceutical Sciences, Qingdao Agricultural University, in Qingdao, China. Direct correspondence to Weina Li at wnli@qau.edu.cn ●


Measurement of Ammonia Leakage by TDLAS in Mid-Infrared Combined with an EMD-SG Filter Method
April 9th 2024In this article, tunable diode laser absorption spectroscopy (TDLAS) is used to measure ammonia leakage, where a new denoising method combining empirical mode decomposition with the Savitzky-Golay smoothing algorithm (EMD-SG) is proposed to improve the signal-to-noise ratio (SNR) of absorbance signals.


Inside the Laboratory – The Petrochronology Group at University of California, Santa Barbara
January 29th 2024In this edition of “Inside the Laboratory,” John Cottle, PhD, a professor of geology at the University of California, Santa Barbara, and a member of Spectroscopy’s Editorial Advisory Board, discusses his group’s most recent work using “laser ablation split steam” analysis to measure elemental concentrations and isotopic ratios in rocks and minerals.

