Contamination Control During Sample Preparation for Trace Element Analysis of Electronic Cigarette Aerosol with Inductively Coupled Plasma-Mass Spectrometry, Part 2
Part 1 of this tutorial addressed how environmental contamination may be minimized by using proper personal analytical practices, sample preparation environmental suggestions, avoidance of glass and low purity quartz contact with samples and standards during sample collection and preparation, and appropriate choices of high purity solvents during sample collection and preparation. Part 2 continues the discussion in terms of minimizing sample contamination issues by using high purity polymer materials for sample collection and preparation, as well as discuss the differences between instrument and method limits of detection (LODs). Accepted and appropriate procedures for calculating method LODs are related to variability in instrument response and unavoidable environmental contamination during even the cleanest sample preparation. Adherence to such practices will help analysts avoid false positives and report results with a high level of confidence.
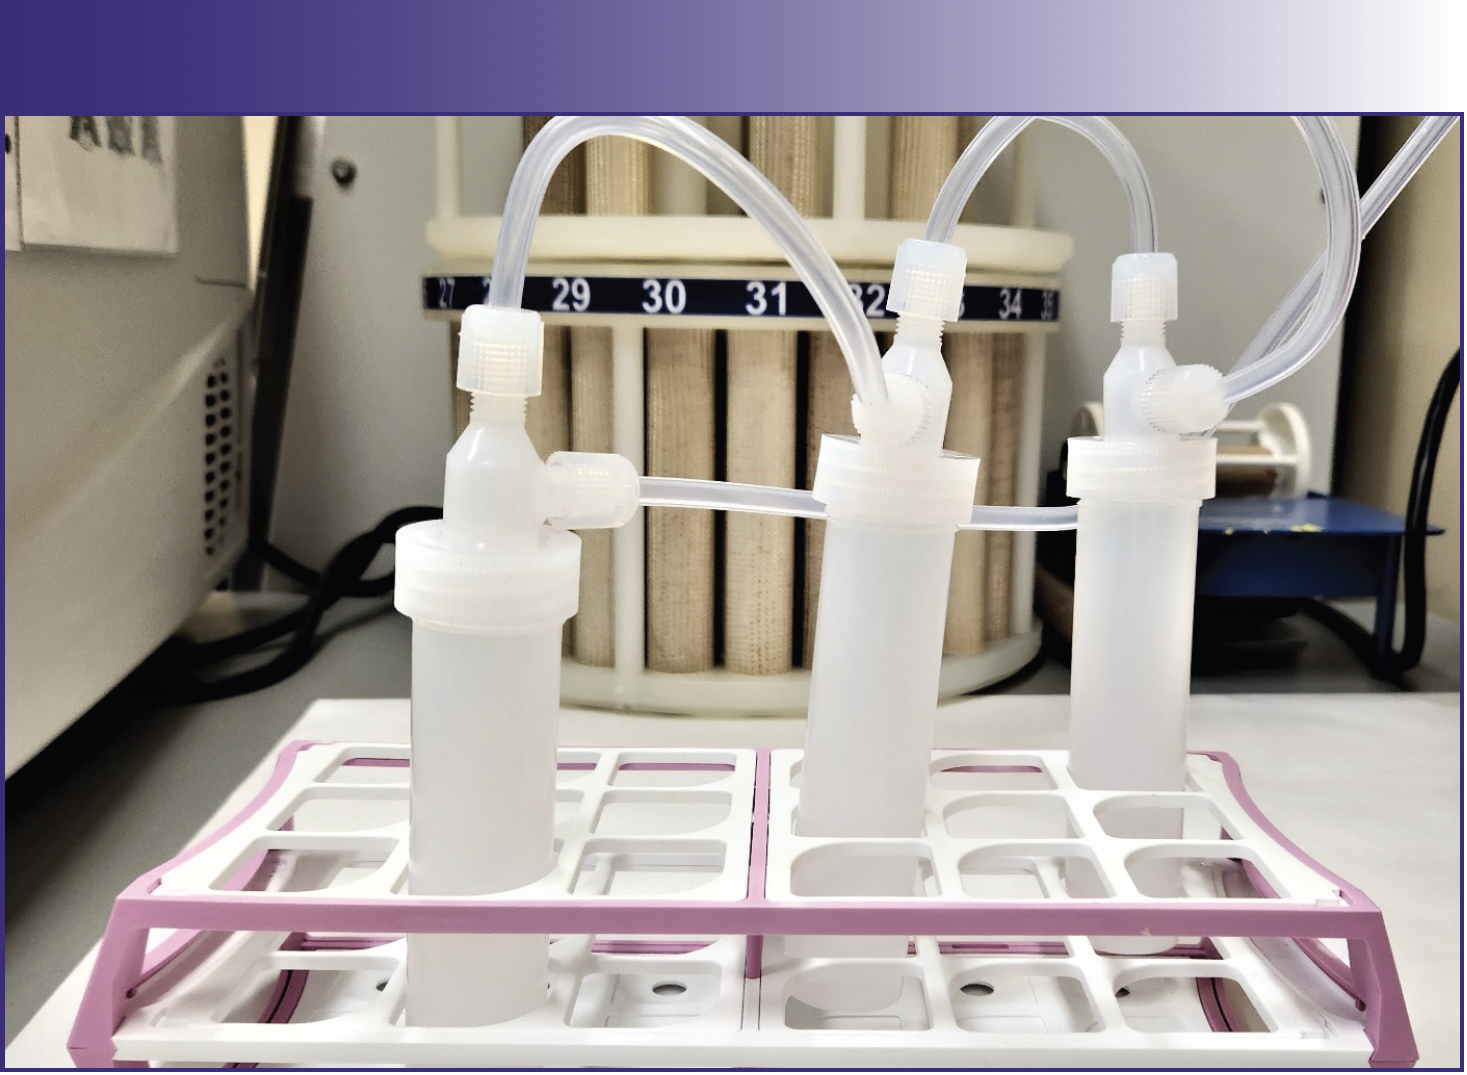
Investigation of materials for trapping aerosols with minimum metal contamination compared to glass and low purity quartz fiber filters led to investigation of membrane filters manufactured from polymers. Unfortunately, polymer membrane filters (47 mm diameter or 60 mm diameter, 1.0 μm stated pore size) either could not meet ISO standard 20768 requirements for puff profile nor pressure drop across the filters, or they initially met the puff profile specifications, but clogged too quickly to collect adequate aerosol for analysis due to the excessive air flow restriction (1). Acid hardened ashless filter papers (chosen for lower metals contamination) were inadequate because aerosol breakthrough occurred even when three filters were placed together. Also, after a few standard 3 sec 55 mL puffs, the filters became wet and limited proper air flow, introducing deviations from requisite puff profile specifications (1). Although fluoropolymers are of much higher purity than glass, similar problems arose during method development. Thus, we developed a simple aerosol condensation trapping method using simply sufficient lengths of 3.97 mm i.d. high metals purity fluorinated ethylene propylene (FEP) tubing (Figure 1) (2,3). Tubing with smaller i.d. had a greater surface area to length ratio for more efficient condensation, but did not pass puff profile specifications due to resistance to air flow.

 tubing (3.97 mm i.d., 5.18 meter length for ENDS with hydrophilic aerosols or 9.14 meter length for hydrophobic aerosols) met ISO Standard 20768 specifications for puff profile and requirements for negligible metal contamination of aerosol samples while providing quantitative metal oxide particle recovery. This image is CDC-sourced.")
FIGURE 1: Acid cleaned fluorinated ethylene propylene (FEP) tubing (3.97 mm i.d., 5.18 meter length for ENDS with hydrophilic aerosols or 9.14 meter length for hydrophobic aerosols) met ISO Standard 20768 specifications for puff profile and requirements for negligible metal contamination of aerosol samples while providing quantitative metal oxide particle recovery. This image is CDC-sourced.
Impingers compatible with smoking machines are available from most tobacco product instrument manufacturers. Most of the impingers are made of glass with 25 to 50 mL volume, and used for measuring organic analytes. The simple fact that they are predominantly glass indicates the “experienced inorganic analyst” that these traps are not suitable for analyses of metals in smoke particulate nor aerosols from electronic nicotine delivery systems (ENDS).
Also, the trap volumes are not suitable for trapping metals in smoke particulate nor in ENDS aerosols because impingers should not be filled more than half full of liquid. A fraction of the liquid is lost, as it is bubbled out of the exit tube at standard puff air flow rates if impingers are more than half filled. Even a full 50 mL volume of dilute acid is insufficient to quantitatively trap neither cigarette smoke using commonly accepted smoke regimens nor ENDS aerosols using the ISO Standard 27068 regimen nor more aggressive smoking or aerosol generation regimens that may be representative of human puffing behaviors (1,4,5). Further, aqueous solvents are not appropriate solvents for smoke particulate that contains tar. Much of the tar is insoluble in dilute aqueous acid, and sticks inside the connection tubing and sides of impinger vessels rather than dissolving in the aqueous impinger liquid. Because tar is a heterogeneous mixture including very hydrophobic substances, such as polycyclic aromatic hydrocarbons (PAHs), as well as metals, neither hydrophilic nor hydrophobic solvents are ideal for collecting total particulate matter (TPM). We have used high purity quartz distilled N,N-dimethylformamide (DMF) for a few applications because it is a highly polar solvent that dissolves metal ions as well as very hydrophobic substances in a single phase (6). The analyst must then either digest the solvent with dissolved or well-suspended particulate matter or dilute it into aqueous solutions for inductively coupled plasma–mass spectrometry (ICP-MS). Thus, neither tobacco industry labs nor public health labs commonly use impingers for collection of smoke particulate analyses of metals.
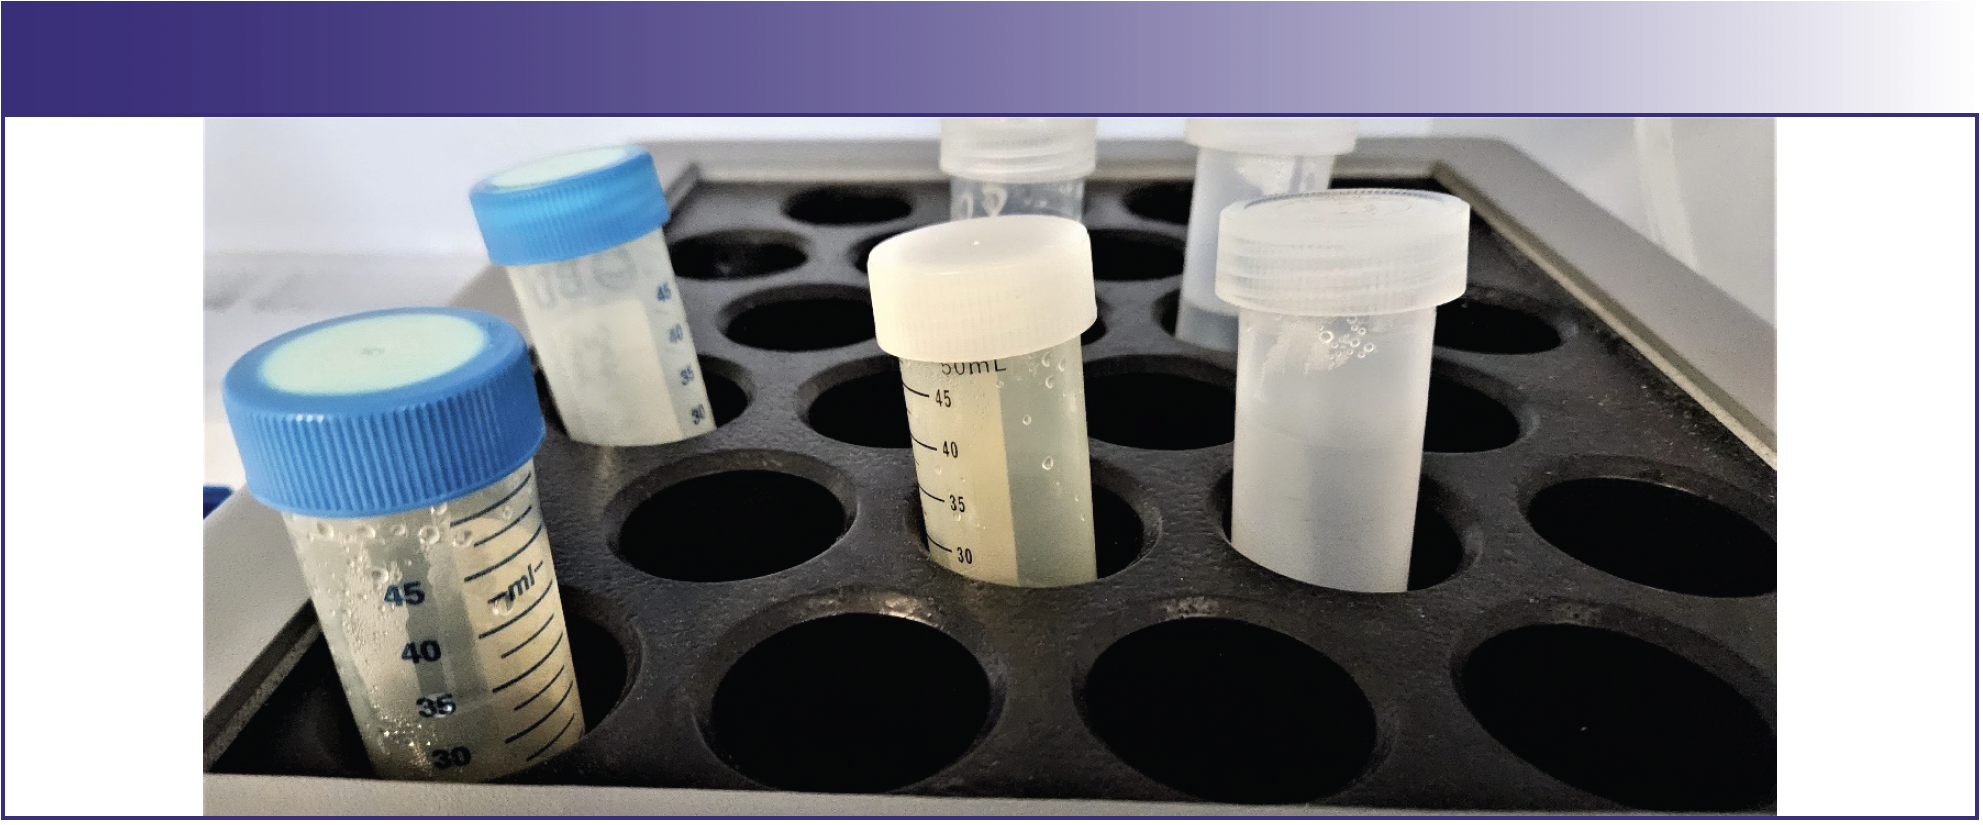
Some perfluoroalkoxy alkanes (PFA) impingers (60 mL) are commercially available (Savillex, Figure 2) and are suitable for trapping ENDS aerosols. The high purity PFA can be soaked and rinsed with ultrahigh purity dilute acids before use. One 60 mL impinger containing 30 mL dilute acid, however, is still insufficient for collection of aerosols using 55 mL puff volumes with a 3 sec rectangular puff profile (1). The air flow during this puff is 18.33 mL/sec, slightly greater than the average air flow rate using 35 mL puff volume and a 2 sec puff with a bell-shaped puff profile, as specified for ISO standard 3308, but less than the average air flow rate during a WHO Method 1 55 mL puff in 2 sec (4,5). We have used dimethyl sulfoxide for collection of mainstream cigarette smoke TPM using the ISO Standard 3308 and WHO Method 1 regimens with PFA impingers to provide the U.S. Food and Drug Administration Toxicology Lab dissolved TPM samples for cell culture studies. Three 60 mL impingers connected in tandem containing 30 mL liquid in each impinger were required to quantitatively collect smoke particulate matter from cigarettes using either smoking regimen. It is apparent that the 18.33 mL/sec air flow rate specified in ISO Standard 20768 would require approximately the same volume of liquid in three 60 mL impingers to quantitatively trap aerosol for analysis of metals as was required to trap smoke aerosol using the slightly lower ISO Standard 3308 average air flow rate and the higher WHO Method 1 air flow rate. For these reasons, it is apparent that 25 mL or 50 mL glass impingers were not manufactured with collection of metals in smoke or aerosol samples for analysis of trace metals in mind.

 60 mL impingers connected in tandem with PFA tubing are acceptable materials for trapping aerosol for analysis of trace metals. One end is connected to the aerosol machine syringe pump connection, the other end to the ENDS device. After combining the contents of the three impingers, 10 mL of the acid used to collect aerosol may be used to rinse the final drops of liquid from the impingers and dilute to 100 mL in a dilute acid cleaned polymethylpentene (PMP), PFA, or polypropylene volumetric flask. This image is CDC-sourced.")
FIGURE 2: Half-filled perfluoroalkoxy alkane (PFA) 60 mL impingers connected in tandem with PFA tubing are acceptable materials for trapping aerosol for analysis of trace metals. One end is connected to the aerosol machine syringe pump connection, the other end to the ENDS device. After combining the contents of the three impingers, 10 mL of the acid used to collect aerosol may be used to rinse the final drops of liquid from the impingers and dilute to 100 mL in a dilute acid cleaned polymethylpentene (PMP), PFA, or polypropylene volumetric flask. This image is CDC-sourced.
Elemental “Memory”
Memory effects may be defined as the persistence of a given elemental signal after the analysis of a standard or sample and a reasonable introduction system rinse time. Metals such as mercury are well known for memory effects, resulting in long introduction system rinse out times with nitric acid alone, since nitric acid is not a strong enough oxidizing acid to maintain mercury in oxidized form. The solution to this rinse out problem is the addition of an acid (such as hydrochloric acid), or a chelating agent that has a soft base anion ligand (such as sulfur) to the diluent and rinse solutions as previously discussed (7).
Modified polytetrafluoroethylene (TFM) vessel polymers are more rigid polymers than the PFA used to produce earlier generation microwave vessels. TFM vessels may be heated to higher temperatures without deformation, enabling more complete oxidation of organic substances. The TFM molecular polymer chains, like all molecules, have greater rotational motion at higher temperatures. It is possible that the more rapid motion of the PFA and TFM polymer chains at high temperatures permit metals to be captured in the surface polymer matrix. Therefore, PFA and even TFM vessels may superficially absorb metals whether the metals are known to exhibit memory effects when heated during a microwave digestion and may contaminate a subsequent digestion. The use of a hot nitric acid vapor cleaning system between analytical runs helps the problem, but does not eliminate it. Even after using two cycles with a hot acid vapor cleaning system to clean PFA vessels, we have observed trace metals carry over into digestion of a subsequent sample. This first became evident during digestion of urine samples for determination of uranium isotope ratios at low concentrations (8). It was noted that when urine samples containing spikes of reference materials or with known isotope ratios were digested in PFA vessels that previously contained a sample with a different isotope ratio, the resulting digested sample would have an isotope ratio intermediate between the previous sample and the subsequent sample, thus requiring blank digestions between samples to remove the metals absorbed by PFA vessels. We have subsequently observed similar effects with multiple metals from tobacco and other plant material digests when using higher temperatures in TFM microwave digestion vessels than were formerly used with PFA vessels. If a tobacco sample has a high concentration of any given metal, and a sample with a low concentration of the same metal follows in the same vessel, the resulting digestion yields a result that is slightly higher than expected. If the order is reversed, a tobacco sample that has a high concentration of any given metal following a sample that had a low concentration of the same metal in the same vessel will exhibit a less apparent effect. This demonstrates that even more rigid TFM vessels require blank digestions between samples that have significantly different metal concentrations before reutilization to avoid contamination from previous samples.
Memory effects are more troublesome if the metal is easily reduced in the presence of acid. For example, nitric acid catalyzes reduction of mercury as organic substances are oxidized. The reduced volatile elemental mercury is not quantitatively recovered. Some of the mercury is lost as vapor when the vessel is opened, and some is absorbed into the vessel walls, accumulating and causing increasing contamination of samples subsequently digested in the same vessel even after hot acid vapor cleaning. The addition of 1 mL hydrochloric acid to 9–10 mL nitric acid during microwave digestion will help remedy this problem, based on the same Pearson principle used to correct introduction system memory effects (4). Addition of sufficient soft base anion ligand such as chloride from hydrochloric acid chelates the Hg2+ ion and forms the complex anion [HgCl4]2-. This complex ion is soluble in aqueous solvent. Since an equilibrium is formed between Hg2+ ion and the [HgCl4]2- complex, the equilibrium is shifted away from the Hg0 and Hg2+ equilibrium (according to Le Chatelier’s principle), stabilizing mercury in soluble oxidized anionic complex form that does not have a memory effect, and minimizing contamination of subsequent samples in the same vessel.
The same considerations apply if a heating block is used. Figure 3 shows a heating block with a Teflon-coated surface for avoiding contamination and protecting the metal surface beneath. Note polypropylene tubes come from two sources, and PFA tubes come from another source. All need to be precleaned by heating the tubes with dilute nitric and hydrochloric acid, since heating causes the release of metals that were trapped in the polymer matrix. Note the discoloration of caps on the tubes on the left, demonstrating an attack of concentrated acids even on polymers.

 and PFA (right) tubes in a Teflon (PTFE) coated hot block digestion system. This image is CDC-sourced.")
FIGURE 3: Polypropylene (left and center) and PFA (right) tubes in a Teflon (PTFE) coated hot block digestion system. This image is CDC-sourced.
Calculation of Method
Limits of Detection
Instrument manufacturer instrument detection limits (IDLs) are useful only to compare signal to background ratio with other instruments. They are typically calculated as three times the standard deviation of a single analysis of a dilute ultrahigh purity acid blank that is run on a well-optimized instrument that has never been contaminated with samples with more complex matrices. Some analysts have published data with what appears to be a list of instrument manufacturer IDLs in supplementary files rather than true method detection limits (LOD), or with no description of determination of an LOD (9). An IDL is not relevant for reporting analytical data obtained using a validated method. Method LODs take into account instrument response determined under identical analytical method conditions developed for the analytes and matrices used. A real sample matrix is likely more complex than diluted ultrahigh purity nitric acid, and is measured with instrumentation that is no longer not pristine. Method LODs take into account trace metal contamination from microwave digestion vessels (if used), devices and vessels used for sample dilution, imperfectly prepared calibration standards and internal standards, minor pipetting inaccuracies, differences in instrument response from day to day, and all other aspects of sample preparation and instrument variability and error over a multiday period. The ideal method LOD would be useful to statistically determine the uncertainty of analytical method results at low concentration, and establish a concentration below which it is recognized that analytical results are insufficiently certain to report. True analytical results can then be distinguished from false positives resulting from trace metal contaminants of samples from previous vessel and instrument utilization, sample preparation and analysis, analytical interferences, and day-to-day differences in instrument response as optimization parameters change. It is apparent that using good analytical practices described in Part 1, as well as maintaining vessels used for sample collection and preparation as free of metal contamination as possible, will result in lower method LODs.
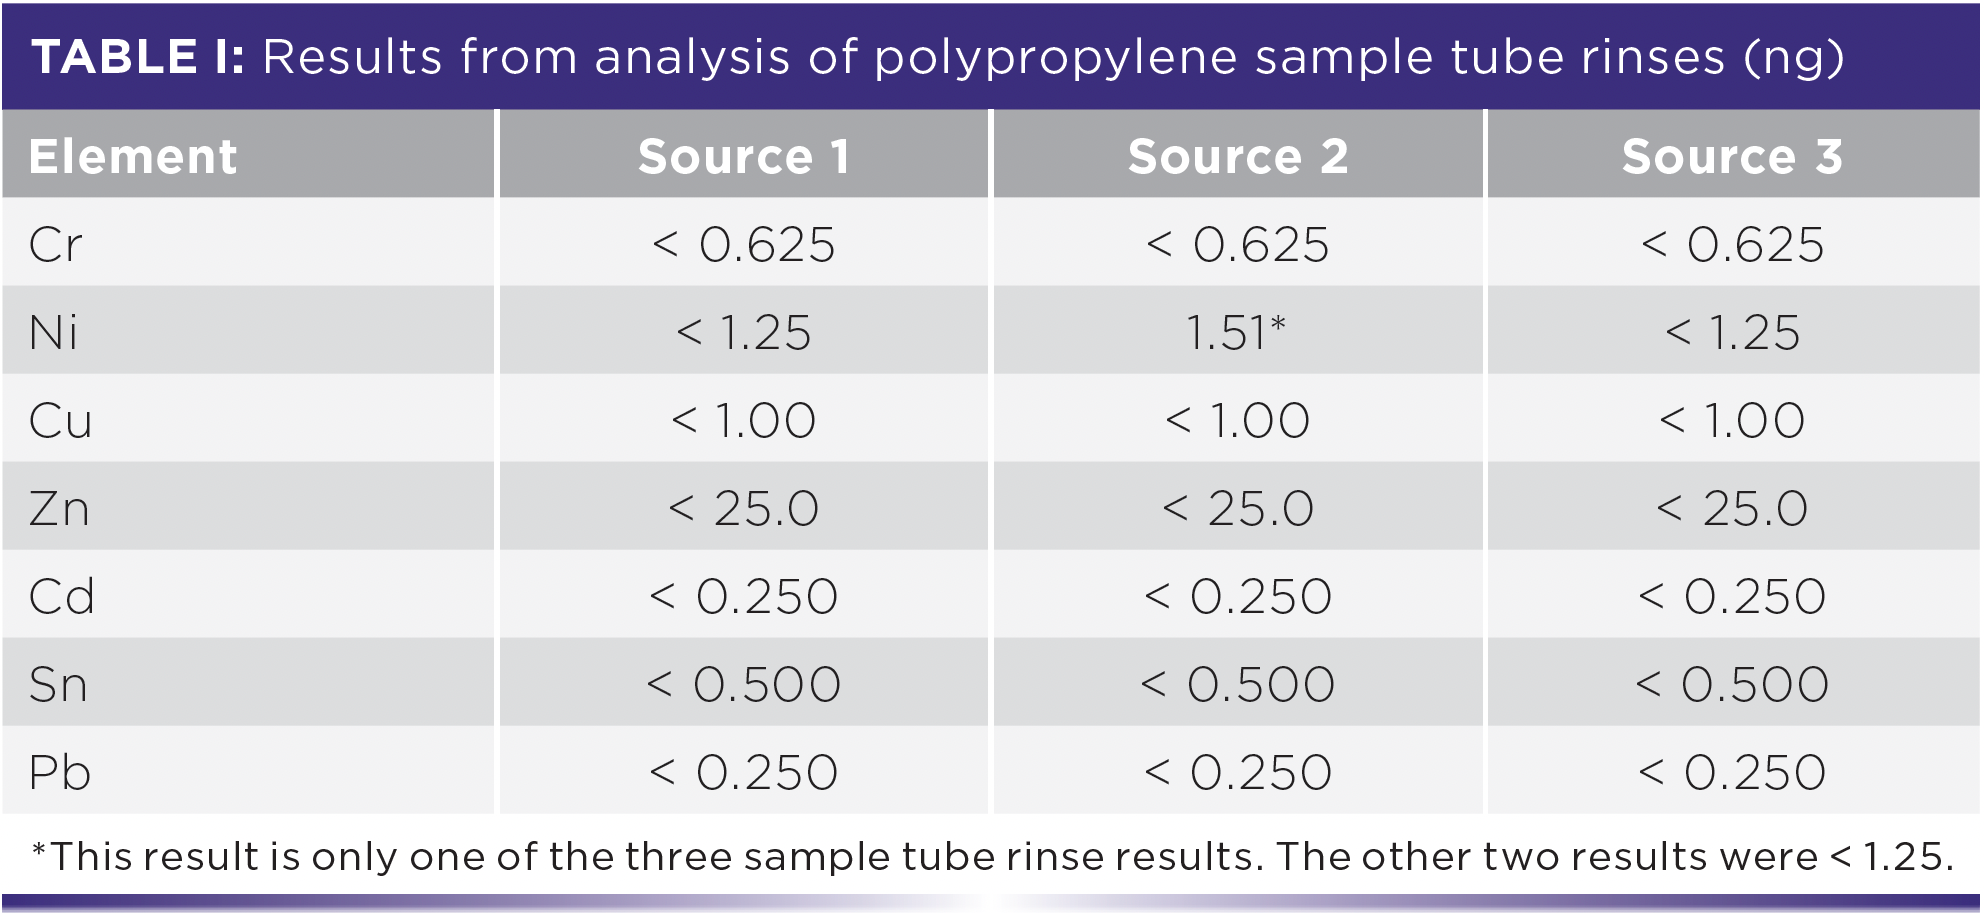
Although polypropylene bottles and 15 or 50 mL “centrifuge tubes” sold as sample containers generally have very low extractable metal concentrations, it is a good analytical practice to verify this. We tested a new batch of polypropylene tubes from a source for which we had formerly observed very low extractable trace metals, and observed significantly higher extractable aluminum in the new batch. We inquired about this, and learned that the vendor had changed the manufacturer to save on costs. Since aluminum was one of our hydrophobic aerosol method analytes, we had to change the source of sample tubes and check tubes from different vendors to determine the best source for the method. This illustrates that it is a good practice to screen a few containers every time a new batch of sample containers is received to avoid false positives from samples, even when using relatively high metal purity polypropylene tubes.
To minimize contamination of samples from containers as described above, it is a good practice to fill the tubes with 1% v/v ultrahigh purity nitric acid + 1% v/v ultrahigh purity hydrochloric acid, cap them, invert them a few times, and let them sit overnight before using them. This procedure cleans out most sample vessel impurities, unless they will be heated. Since the method LOD should incorporate variability in trace element background from the rinsed containers that we use, any trace metals that may remain have already been taken into consideration. Although acid rinsed sample containers result in contamination well below our method LODs, the following will illustrate how a well-validated method LOD prevents reporting false positives due to contamination. Polypropylene tubes (15 mL) obtained from three sources were prepared in triplicate with acid rinse solution, capped, inverted three times, and soaked overnight. Rather than discarding the overnight rinses, the rinses were analyzed according to our ENDS aerosol method (3).
It is evident from the results in Table I that nearly all of the polypropylene tube rinses were below the method LODs even before the tube prerinse. These tube sources had very low extractable elemental contamination. Two of the three nickel results in the tubes from our second source were below the method LOD. The nickel concentration obtained from only one tube was shown in the table to demonstrate that contamination from one tube in a batch of otherwise clean tubes may cause a false positive result. Since metals from only 3 of 100 tubes from each manufacturer were checked, it is possible that other tubes in the batch may also have low levels of contamination. It is also possible that tubes from the other sources had contaminated tubes that were not randomly selected. This confirms that prerinsing sample containers as a precaution is a good inorganic analytical practice to prevent contamination and false positive results.


There are several widely accepted ways to calculate method LODs. The simplest way is to include a sample in each analytical run for validation that has the same matrix as samples that will be analyzed with the method, and run it through the same sample preparation procedures as the samples. An appropriate sample should have very low analyte concentrations though remain in the same matrix as samples, in order to represent the higher relative variability that is analytically observed for low concentrations than high concentrations in the sample matrix. The same sample matrix is prepared independently a minimum of 14 times for 14 analytical runs per formed on 14 or more days. The standard deviation of the results obtained over a minimum of 14 days is multiplied by 3 to obtain approximately 99% certainty that the resulting concentration is above a level of response that would cause result uncertainty (9). This method may be taken a step further by analyzing 10 or more replicates of the same or similar sample with low analyte concentrations in the same run. The within run and between run standard deviations are then combined ( [s21 run + s2multiple runs)]1/2 ), since long term variability and uncertainty is usually greater than short term standard deviations (9,10).
The most well-known method for calculation of a method LOD is the Taylor method (11). This method requires multiple analytical runs as described in the simpler methods above. A minimum of seven or more samples are spiked with known analyte concentrations, analyzed according to the method procedure on separate days, and the standard deviations of the analytical results are plotted on the ordinate (y-axis) versus concentrations on the abscissa (x axis). The regression line through the plotted data is extrapolated to the ordinate at “0” analyte (abscissa) concentration. The apparent standard deviation at “0” analyte concentration is multiplied by 3 to determine the method LOD. This technique is a very good approximation, although it was likely intended for analyses in which there is negligible analyte concentration in the matrix, whereas samples are unlikely to have “0” metal concentration. When used for calculation of a method LOD with external standards, it is possible that the standards will be in a cleaner matrix than the samples, so a quality control sample (QCS) or certified reference material (CRM) that has characterized analyte concentrations and the same or very similar matrix should be included to add matrix effect to determination of the method LOD (12).
An additional level of care requires adding a statistical adjustment to account for potential overlap between false positives from samples with false negatives. This method requires determination of the regression using the Taylor method and inclusion of a sample blank along with the spiked samples, but statistically adjusting the results using the regression slope and ordinate intercept (12,13). Procedural blank and standard deviation are determined with analyses from multiple analytical runs, a is the slope of the regression determined with the Taylor method, and b is the intercept obtained using the Taylor method, displayed in equation 1 (11–13).


By properly calculating method LODs with an appropriate method, the analyst considers not only day-to-day variability of instrument response, calibration, and sample preparation, but trace contamination in digestion vessels (if used) and sample containers and other ancillary materials that contact samples as well. In this way, the analyst avoids reporting false positive and false negative results. The analyst determines “…the smallest measure, xL, that can be detected with reasonable certainty for a given analytical procedure” (9). In other words, “A common misconception is that the LOD is the smallest concentration that can be measured [with an instrument]. Instead, it is the concentration at which we can decide whether an element is present or not…” (9). A method LOD does not tell us the lowest possible ion concentration that produces ion counts in a secondary electron multiplier detector; rather, it reveals the concentration at which we can distinguish an elemental concentration in a sample from artifacts of variability from instrumentation response, calibration, and sample preparation procedures.
Conclusion
Trace metal contamination is unavoidable during preparation of samples for inorganic analyses. In order to minimize sample contamination when using these techniques, the analyst must take care to learn appropriate sample preparation practices and wisely choose ancillary vessels made from appropriate materials that contribute as little trace metal contamination as possible.
Method LODs should be calculated to take into account not only day-to-day instrument response variability, but variability of trace contamination acquired during independent sample preparation procedures as well. This will aid in avoiding reporting false positive and false negative results.
Disclaimer
The findings and conclusions in this report are those of the authors and do not necessarily represent the views of the Centers for Disease Control and Prevention.
References
(1) International Standard Organization. Vapour Products — Routine Analytical Vaping Machine — Definitions and Standard Conditions. ISO Standard 20768:2018 Geneva, Switzerland. https://www.iso.org/standard/69019.html
(2) Gray, N.; Halstead, M.; Valentin-Blasini, L.; Watson, C., Pappas, R.S. Toxic Metals in Liquid and Aerosol from Pod-Type Electronic Cigarettes. J. Anal. Toxicol. 2021, 45 (4), 337–347. DOI: 10.1093/jat/bkaa185
(3) Halstead, M.; Gray, N.; Gonzalez-Jimenez, N.; Fresquez, M.; Valentin-Blasini, L..; Watson, C.; Pappas, R.S. Analysis of Toxic Metals in Electronic Cigarette Aerosols Using a Novel Trap Design. J. Anal. Toxicol. 2020, 44, 149–155. DOI: 10.1093/jat/bkz078
(4) International Standard Organization. Routine Analytical Cigarette-Smoking Machine — Definitions and Standard Conditions. ISO Standard 3308:2012 Geneva, Switzerland, https://www.en-standard.eu/iso-3308-routine-analytical-cigarette-smoking-machine-definitions-and-standard-conditions/#:~:text=ISO%203308%20ISO%203308%3A2012%3A%20defines%20smoking%20parameters%20and,analytical%20smoking%20machine%20complying%20with%20the%20standard%20conditions
(5) World Health Organization. WHO TobLabNet Official Method SOP 01. Standard Operating Procedure for Intense Smoking of Cigarettes. World Health Organization 2012 Brussels, Belgium. https://www.who.int/publications/i/item/standard-operating-procedure-for-intense-smoking-of-cigarettes
(6) Fresquez, M.R.; Gonzalez-Jimenez, N.; Gray, N.; Valentin-Blasini, L.; Watson, C.H., Pappas, R.S. Electrothermal Vaporization-QQQ-ICP-MS for Determination of Chromium in Mainstream Cigarette Smoke Particulate. J. Anal. Toxicol. 2017, 41, 307–312. DOI: 10.1093/jat/bkx010
(7) Pappas, R.S. Sample Preparation Problem Solving for Inductively Coupled Plasma-Mass Spectrometry with Liquid Introduction Systems I. Solubility, Chelation, and Memory Effects. Spectroscopy 2012, 27 (5), 20–31.
(8) Pappas, R.S.; Ting, B.G.; Paschal, D.C. A Practical Approach to Determination of Low Concentration Uranium Isotope Ratios in Small Volumes of Urine. J. Anal. Atom. Spectrom. 2003, 18, 1289–1292. DOI: 10.1039/B305515A
(9) Thomsen, V.; Schatzlein, D.; Mercuro, D. Limits of Detection in Spectroscopy. Spectroscopy 2003, 18 (12), 112–114.
(10) Pappas, R.S.; Ting, B.G.; Jarrett, J.M.; Paschal, D.C.; Caudill, S.P.; Miller, D.T. Determination of Uranium-235, Uranium-238, and Thorium-232 in Urine by Magnetic Sector Inductively Coupled Plasma-Mass Spectrometry. J. Anal. Atom. Spectrom. 2002, 17, 131–134. DOI: 10.1039/B108414C
(11) Taylor, J.K. Quality Assurance of Chemical Measurements. Lewis Publishers 1987, 79–83.
(12) Gonzalez-Jimenez, N.; Gray, N.; Pappas, R.S,; Halstead, M.; Lewis, E.; Valentin-Blasini, L.; Watson, C.; Blount, B. Analysis of Toxic Metals in Aerosols from Devices Associated with Electronic Cigarette, or Vaping, Product Use Associated Lung Injury. Toxics 2021, 9 (10), 240. DOI: 10.3390/toxics9100240
(13) National Committee for Clinical Laboratory Standards (NCCLS). Protocols for Determination of Limits of Detection and Limits of Quantitation. National Committee for Clinical Laboratory Standards 2004 Wayne, PA, 24, 9–35.
ABOUT THE CO-AUTHORS


R. Steven Pappas is a research chemist and inorganic analytical Team Lead. Naudia Gray is an inorganic analytical chemist. Both authors work in the Tobacco and Volatiles Branch of the Division of Laboratory Sciences at the National Center for Environmental Health, U.S. Centers for Disease Control and Prevention, in Atlanta, Georgia. Direct correspondence to: RPappas@cdc.gov

ABOUT THE EDITOR

 and a Chartered Chemist (CChem). Direct correspondence to SpectroscopyEdit@mmhgroup.com")
Robert Thomas, the editor of the “Atomic Perspectives” column, is the principal of Scientific Solutions, a consulting company that serves the educational and writing needs of the trace element analysis user community. Rob has worked in the field of atomic spectroscopy and mass spectrometry for more than 45 years, including 24 years for a manufacturer of atomic spectroscopic instrumentation. He has authored more than 100 scientific publications, including a 15-part tutorial series, “A Beginner’s Guide to ICP-MS.” In addition, he has authored five textbooks on the fundamentals and applications of ICP-MS. His most recent book, a paperback edition of Measuring Heavy Metal Contaminants in Cannabis and Hemp, was published in December 2021. He is currently working on the 4th edition of his Practical Guide to ICP-MS: A Tutorial for Beginners textbook, which should be published in July 2023. Rob has an advanced degree in analytical chemistry from the University of Wales, UK, and is a Fellow of the Royal Society of Chemistry (FRSC) and a Chartered Chemist (CChem). Direct correspondence to SpectroscopyEdit@mmhgroup.com


 thwart the host immune response. Coronavirus structure. | Image Credit: © Design Cells - stock.adobe.com.")


The 2024 Emerging Leader in Atomic Spectroscopy Award
January 1st 2024This year’s Emerging Leader in Atomic Spectroscopy Award recipient is Eduardo Bolea-Fernández. For the past decade, Bolea-Fernández’s research has focused on the development of a newly introduced technique, termed tandem ICP-mass spectrometry (ICP-MS/MS), for ultra-trace elemental and isotopic analysis. Senior technical editor Jerome Workman discusses Bolea-Fernández’s work here.

Advancements in Non-Invasive Analysis of Historical Metal Artifacts
December 19th 2023Studying historical ancient artifacts requires the use of a nondestructive technique to analyze the metal surfaces of these objects. This study presents two approaches that improves on existing methods when conducting alloy analysis.


