Detection of the Early Fungal Infection of Citrus by Fourier Transform Near-Infrared Spectra
Early fungal infection of citrus is one of the common diseases found during the storage period of citrus, and fungus that infects citrus will spread to the entire batch of citrus as the degree of infection deepens, causing enormous economic losses. Therefore, early detection of fungal infection of citrus is fundamental. The purpose of this study is to explore the qualitative identification of early fungal infections in citrus by using Fourier transform near-infrared (FT-NIR) combined with a variety of chemometric methods. First, discrete wavelet transform (DWT) is used to filter the noise of the spectral signal, then combined with a PLS-DA model, that helps discriminate healthy from infected Citrus. Subsequently, four different feature variable selection methods were introduced, Then, the linear discriminant analysis (LDA) and support vector machine (SVM) two classifiers were combined to establish a qualitative model for the degree of fungal infection. The modeling results show that the SVM modeling effect is better than LDA, and the DWT-CARS-SVM based on the RBF kernel function has the best result, the accuracy rates of the training set and test set are 100% and 97%. The results indicate that FT-NIR spectroscopy, combined with chemometric methods, is able to distinguish early fungal infections in citrus.
Citrus is one of the world’s most famous types of fruits, and its planting areas cover much of the world. China is one of the vital origins of citrus, with rich resource types and many advantageous varieties (1). Wogan oranges are a late-maturing hybrid citrus variety. The maturity period of Wogan is from February to March, and it belongs to a class of spring oranges. Its natural fruit time can be ripe from around February to August, with a sweet and sour taste that is popular with many people. Citrus fungal infection is a common disease found during citrus storage, mainly through fruit skin wounds, and it is one of the most harmful citrus diseases. At the same time, citrus infected by fungi can also infect surrounding citrus, leading to cross-infection and resultant enormous economic loss (2–3). With rapid societal developments, people now have higher standards for the safety and taste of fruits and vegetables. Since the fungal infection site appears very similar to healthy skin, it is difficult to observe the infection with the naked eye. Therefore, detecting early fungal infection in citrus is a very challenging task. At present, the detection of fungal infections of fruit on the packaging line is mainly carried out by using the fluorescence effect of ultraviolet light. Although this method is effective, it can affect the physical and mental health of certain workers exposed to ultraviolet light for a long period of time, due to its high energy (2,4). Therefore, it is necessary to explore a nondestructive, rapid, safe, and reliable detection technique for the early identification of citrus fungal infections.
Near-infrared spectroscopy detection technology is very informative, and includes nearly all the characteristic information of X-H hydrogen-containing groups (5). Different components in the substance or different hydrogen-containing groups in the same component have rich absorption spectra in the near-infrared spectral region (6). Fruits and vegetables are mainly composed of water. In addition, they also contain various vitamins, inorganic salts, and cellulose, which are rich in O-H, N-H, and C-H groups. Each molecular component has its specific absorption characteristics, which makes near-infrared spectroscopy advantageous for qualitative and quantitative detection. In terms of fruit detection, near-infrared spectroscopy has been used to evaluate the internal and external quality parameters of different types of fruits, such as apples, pears, bananas, peaches, grapes, and so forth (7–11). Similarly, near-infrared spectroscopy also shows its unique advantages in the rapid and nondestructive detection of the internal and external quality indexes of citrus. Some studies have reported the use of near infrared spectroscopy to detect early fun- gal infections in citrus. Studies have shown that near-infrared spectroscopy detection technology can be used to detect fungal infections in citrus and is an important method. Lorente and others collected the reflectance spectra of the healthy and decomposed surface parts of citrus in two spectral regions of 650 nm–1050 nm and 1000 nm–1700 nm, and adopted three different dimension reduction methods combined with linear discriminant analysis (LDA) to establish a supervised classifier (12). Finally, near-infrared spectroscopy was used for factor analysis (FA). The accuracy of partial classification of healthy and decay (diseased) citrus was 100% and 94.4%. How- ever, in this type of study, the experimental design did not distinguish the degree of decay; it only studied the characteristics of healthy and decayed samples, without considering the influence of time on the degree of decay. Ling Xia Huang and others used near-infrared spectroscopy and electronic nose technology to predict the number of days before peach decay (13). The accuracy of the best prediction model for this method was reported to be 82.26%, which is useful for the nondestructive evaluation of healthy (or edible) time before onset of peach decay. However, this prediction accuracy is not considered high enough for satisfactory decay prediction results. Clara Shenderey and others used near-infrared spectroscopy equipment to detect apple kernel mildew online, and the classification results are very accurate, indicating that using near-infrared spectroscopy to detect mildew is satisfactory (14). Yang and others studied the discriminant analysis of apple mold heart disease by using Fourier-transform near-infrared spectroscopy (FT-NIRS) and electronic nose technology combined with chemometrics (15). The discriminant accuracy of the verification set was 87.7% and 86.2% respectively, which discriminated healthy apples and apples with mold heart disease, but did not distinguish the degree of apple mold heart disease.
Near-infrared spectroscopy combined with a variety of qualitative methods is widely used in fruit detection. Choosing different modeling algorithms will affect the accuracy and stability of the model (16). Tian et al. established LDA and SVM classification models for apple nuclear mold based on full transmission spectra and established a better classification model (17). Pan et al. used near-infrared hyperspectral image detection technology to perform non-destructive classifications of apple damage time and used a linear discriminant analysis (LDA) classifier to establish apple damage time classifications, with the accuracy for this method reaching 92.86% (18). Sadjad Abasi et al. used wavelet transform denoising to preprocess spectral data and then combined it with a partial least squares (PLS) algorithm to establish a regression model and obtain a high correlation coefficient and a low root means square error (19). In this current paper, we propose to develop a qualitative discriminatory model for early fungal infections in citrus, drawing on the above modeling algorithms and approaches.
In this feasibility study, FT-NIR spectroscopy was used to identify early fungal infections in citrus fruit. The principle of identification is based on the absorbance spectra of the different fruit types measured. The change in absorbance for the different fruit quality types is mainly caused by the change in water concentration in the infected and non-infected fungal parts in the fruit samples. Due to the measurement noise of the spectra acquired by FT-NIR, the original spectra is firstly subjected to discrete wavelet transform to reduce the influence of noise, followed by a feature extraction method to reduce the dimensionality; finally, two classifiers, linear and non-linear, are used to establish different discriminant models for the spectral matrix. The evaluation of different discriminant models is mainly in terms of accuracy, sensitivity and specificity. The results of this study indicate that the use of the FT-NIR detection technique has great advantages in early fungal infections in citrus and can provide practical references for other crops in agricultural research, in addition to expanding the development of FT-NIR in related fields.
Materials and Methods
Sample Preparation
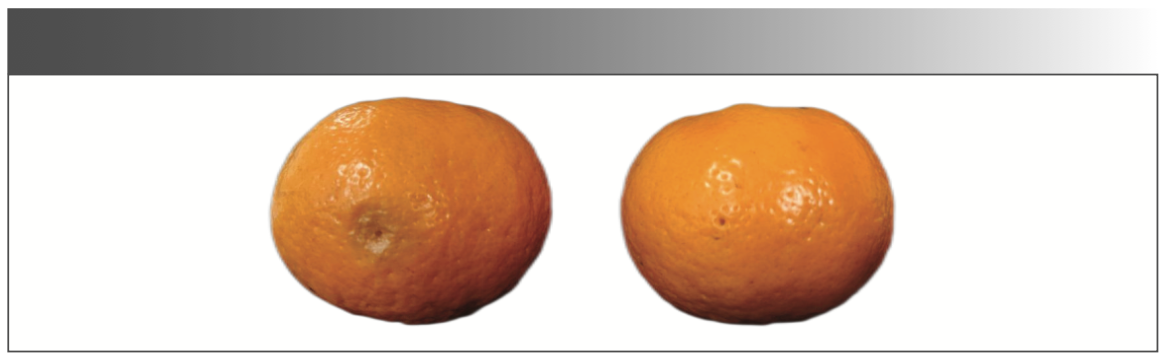
The citrus samples were purchased from a fruit market in Nanchang City, and the fungi variety included wok mandarin mold and Italian green mold. Green mold strains, which are the main culprit of citrus fungal infections, were purchased from the Beina Bio (a microbial strain research and development, production and sales group of professional institutions), and were mainly used to prepare the fungal suspension to infest the citrus. After selecting 200 orange samples with no significant difference in visual appearance, they were washed and disinfected with three different solutions (22 g/kg hypochlorite, sterile water, and 55 g/kg concentrated ethanol) for half an hour, then wiped clean with a dry rag. A hole 1 mm wide and 2.5 mm deep was drilled near the equator of each citrus sample, 100 of which were inoculated with 0.02 mL of fungal suspension at a concentration of 106 spores per mL, and the other 100 citrus samples served as a control group inoculated with 0.02 mL of sterile water, and the samples were subsequently stored in a controlled environmental chamber at 25 °C with a humidity of about 95% ± 1%. The initial phenomenon after fungal inoculation was a decay spot about 10 mm in diameter, which was hardly noticeable to the naked eye. The decay formation time of different citrus samples varied from 4 to 6 days (2,20). The early spectra of the test citrus had relatively small differences. On the 5th day of inoculation, a water-soaked area could be seen at the injection site, so the subsequent spectra were collected from the 5th day to the 13th day. Figure 1 shows citrus infected samples with a fungal suspension for five days and its control (injected with sterile water), at which time a more obvious area of water immersion existed near the borehole.

 and a healthy citrus (right).")
FIGURE 1: Outward images of a fungus-infected citrus (left) and a healthy citrus (right).
The Kennard-Stone (K-S) sample selection algorithm method is based on the Euclidean distance between variables, and the number of samples is selected uniformly in the feature space. For each remaining sample, the sample with the shortest distance from the selected sample is selected first, then the sample corresponding to the longest distance among these shortest distances is selected. These steps are repeated until the number of samples selected is the number of samples in the set, which is usually used for the modeling sets using spectral data (21).
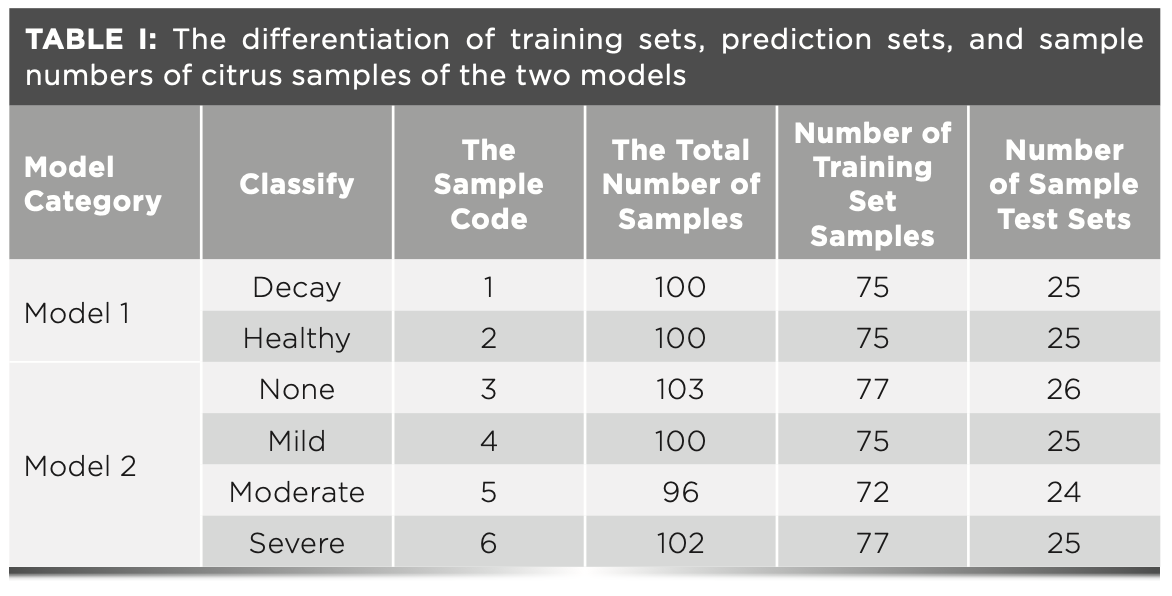
This experiment intends to establish two types of qualitative discriminant models, using the K-S algorithm to divide the samples into training and test sets according to a 3:1 ratio, respectively. Table I shows the training set and test sets of the two models, as well as the citrus differentiation and sample number. Model 1 was designed to determine whether citrus was infected by fungi, and model 2 was designed to determine the degree of citrus fungal infection, which was mainly designated by days of infection. Among the sample types, no infection means that sterile water was injected. The 5th day was set as mild infection, the 8th day was set as moderate infection, and the 12th day was set as a severe infection. After the 15th day, the decayed part of the citrus sample was large, and the sample had no further experimental value. A total of 100 citrus samples were selected. Due to the different growth effects of the fungus on each citrus, 103, 100, 96, and 102 citrus samples with no infection, mild infection, moderate infection, and severe infection, respectively, were selected for evaluation.


Spectroscopy Measurement
Diffuse reflection (DR) light projects onto the citrus sample, and the reflection occurs on the surface of the object in a cone-like direction—the application of this method of detection is called diffuse reflection detection. The acquisition instrument for this experiment was a Bruker multi-purpose analyzer (MPA)-type Fourier transform near-infrared spectrometer, the infrared spectra acquisition software is OPUS, and the wavenumber range is 10000 cm-1 to 4000 cm-1, with the resolution set to 8 cm-1, and the number of averaged scans at 32. Finally, the diffuse reflectance spectra of citrus were obtained and analyzed using the averaged spectra for each sample.
Spectral Pretreatment and Stoichiometric Analysis
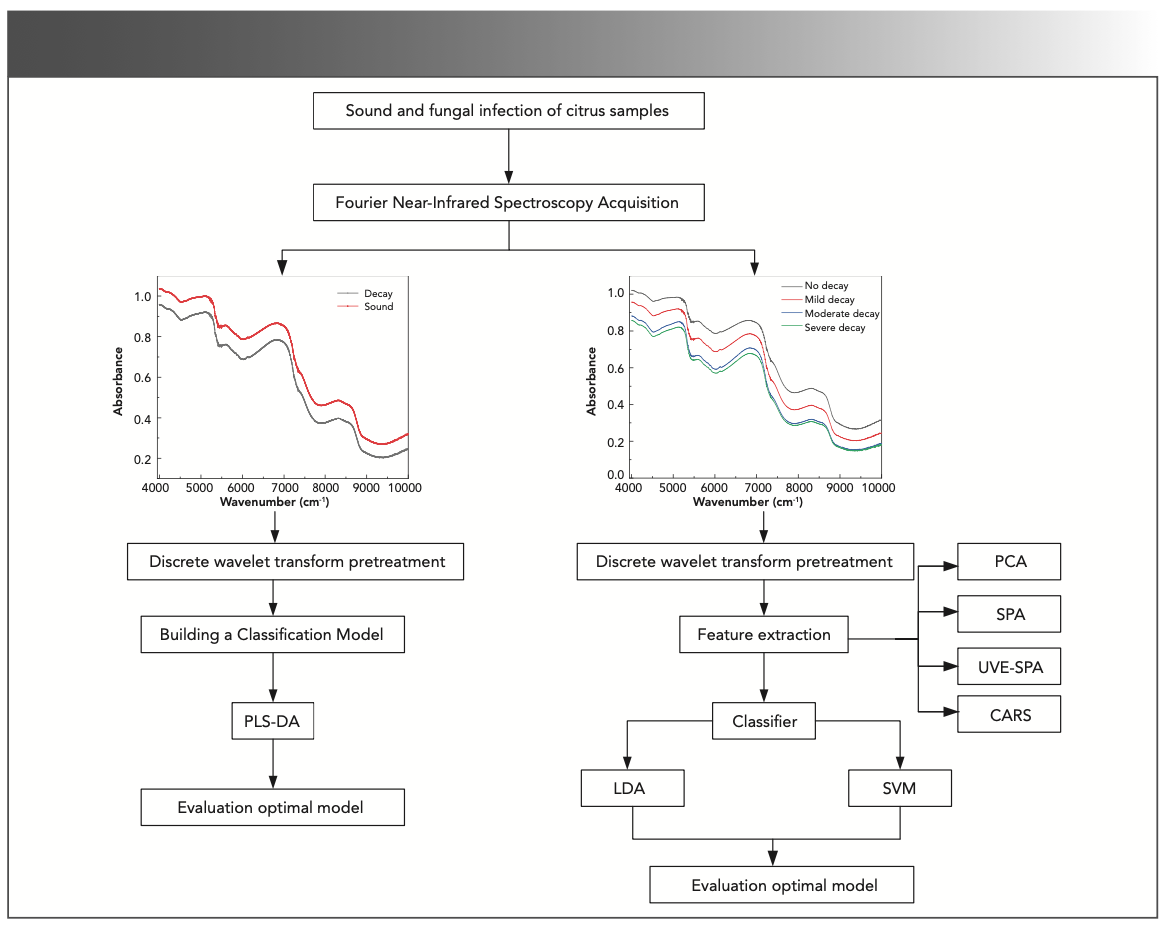
Figure 2 illustrates that models were developed to discriminate healthy from decay fruits. Similarly, models were developed to also detect different levels of fruit decay. In this paper, the raw spectral data were firstly pre-processed with discrete wavelet transform (DWT) to reduce the influence of noise on modeling. Then, the data was combined with partial least squares discriminant analysis (PLS-DA) to build model 1, the use of feature extraction methods can extract useful information, reduce the spectral matrix dimensions, and improve the accuracy and stability of the identification model. Principal component analysis (PCA) is used to reduce the dimensionality of preprocessed FT-NIR spectral data, successive projection algorithm (SPA), uninformative variable elimination-successive projection algorithm (UVE-SPA), and competitive adaptive reweighted sampling (CARS) three feature extraction algorithms are used to select the feature variables of the citrus fungal infection degree discriminant model. Finally, linear discriminant analysis (LDA) and support vector machine (SVM), combined with different feature extraction methods, were applied to build a qualitative discriminant model 2. This process was implemented using MATLAB 2014b and Unscrambler X10.4 software.


FIGURE 2: Flow chart of the main steps of data analysis for two types of qualitative models.
Pre-Processing Method
Wavelet transform (WT) is a powerful tool based on the Fourier transform, which can transform the signal in both time and frequency domains. In spectral denoising and smoothing, the discrete wavelet transform (DWT) is generally used. In spectral analysis, the most commonly used wavelet functions are mainly Haar wavelet, Daubechies (dbN) wavelet, Coiflet wavelet and Symlets wavelet—the db4 wavelet basis was chosen after comparison (22)—this expression is shown in equation 1:

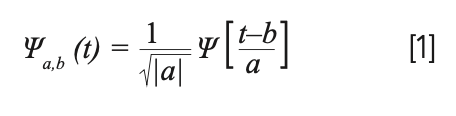

where a is the scale parameter, b is the translation parameter, and is the wavelet basis.
Feature Variable Selection
Principal component analysis (PCA) is an analysis method that achieves data reduction by projection, where the dimensionality reduction allows a few new variables to replace the many original variables in a linear combination, so that a large data space can be converted into a small dimensional factor space (23–24). The new spectral data of this small factor space are termed principal components (PC), with the largest variance of the projection on the first coordinate (PC1) and the second largest variance on the second coordinate (PC2), according to which the new variables of the transformation are orthogonal and uncorrelated with each other. The matrix after PCA can be expressed as shown in equation 2, where T is the score matrix composed of PCs and P is the loading matrix.


The uninformative variable elimination (UVE) algorithm is a feature variable extraction method based on PLS regression coefficients, which are used to measure the significance of the spectral bands. In the program calculation, a set of random variables of the same dimension as the spectral matrix will be randomly generated as a reference, and the stability value and threshold will be used to evaluate the validity of each variable, and variables with absolute values of stability less than the threshold will be eliminated (25). The equation 3 is shown as follows:


where Mean (bi) denotes the mean of the regression coefficient, Std (bi) is the standard deviation of the regression coefficient (b,), and Si is the stability value of the ith variable in the calibration set sample, i = 1, 2, 3..., m, where m is the number of input variables. The decision of whether a variable is excluded or not is based on the size of Si.
After extracting variables by UVE, there are still many variables left. In the UVE-SPA method, SPA is used to select fewer variables by reducing the number of variables by vector projection, and by selecting the least redundancy and covariance of selected variables (26,27).
Competitive adaptive reweighted sampling (CARS) is a feature extraction method that uses adaptive reweighting sampling techniques and exponential functions for variables with large absolute values of regression coefficients in the PLS model. The optimal subset of N variables with the minimum root mean square error (RMSE) of interaction is selected by the Monte Carlo method using an iterative competition approach (28,29). The main steps are as follows: 1) Monte Carlo sampling N times, randomly selecting samples as the calibration set and building the PLS model; 2) forcing the variables to be screened out using the exponential decay function; 3) further competitive selection of variables using the adaptive reweighted sampling technique; 4) calculating the RMSECV of each new variable subset model and selecting the smallest one as the optimal extracted variable.
Classification Methods
Partial least squares discriminant analysis (PLS-DA) is a supervised qualitative classification method based on PLS regression, where the independent variable X is the spectral matrix and the concentration variable y is replaced by a known sample class designator (30). In this paper, the spectral matrix is trained and the PLS prediction of the training sample is discriminated correctly if it is within ±0.5 of the given sample category designator, a value that is real and ideally close to the value of the actual sample category designator.
LDA is a generalization of Fisher’s linear discriminant for finding linear combinations of features characterizing or separating two or more classes, and is a good analytical method in spectral processing. The LDA algorithm can be formulated as the following optimization problem:


where Sbw is within-class scatter matrix, and Sb is between-class scatter matrix (31).
The support vector machine (SVM) algorithm is a supervised nonlinear learning method that is most widely used in pattern recognition. SVMs usually find equidistant vertical classification surfaces between two classes and compute the maximum distance separating samples from different classes. The kernel function and the kernel parameters are the two main computed parameters when it comes to SVM classification, and determining the penalty factor (c) and the kernel parameter (g) is the key to model building (32). The radial basis kernel function (RBF) usually has better prediction results, a more mature theoretical system, is more widely used, and is considered to be the first choice for SVM modeling. Radial basic function (RBF) is described as follows:


where xi is the training sample, xj is the sample to be predicted, and σ is the width of the kernel function.
Data Analysis Flow Chart and Model Evaluation
For NIR spectral data, more sample data are available for the model-building to distinguish between infected and healthy citrus and different levels of infection. Some spectral data wavenumber ranges do not provide useful predictive information. Extracting useful information can greatly improve the accuracy of the model. In this study, two recognition models were designed to determine whether the citrus has a fungal infection and the degree of infection. The raw spectral signals of different types of citrus were obtained by FT-NIR, and the raw signals were subsequently pre-processed using discrete wavelet transform. The features of the two qualitative discriminant models were extracted separately using PCA, and three variable selection algorithms were used to select the feature variables of the second discriminant model. Finally, LDA and SVM, combined with different feature extraction and variable selection methods were used to establish two qualitative discriminant models. The model evaluation parameters are the correct rate of identification, the correlation coefficient, and the root means square error of the modeling and prediction sets of the two types of qualitative models. The higher the correct rate, the larger the correlation coefficient and the smaller the root mean square error, and thus, the better the modeling effect (21). A flow chart of the main steps of the data analysis of the two types of qualitative models is shown in Figure 2.
Results and Discussion
Fourier Transform Near-Infrared Spectra of Citrus With or Without Disease and Citrus with Different Disease Degrees
Near-Infrared Mean Spectra of Healthy and Decay Citrus Samples
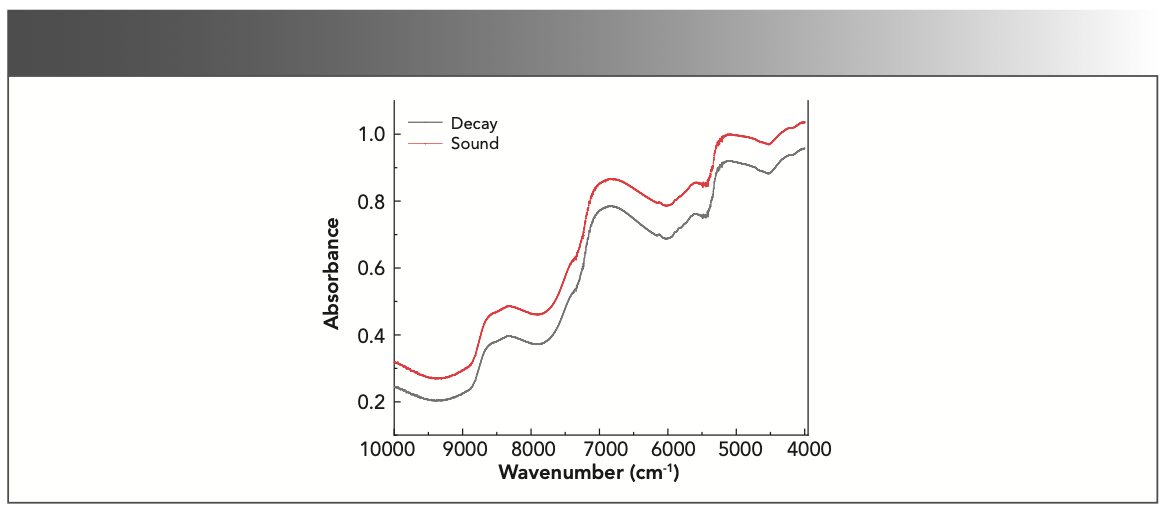
Figure 3 shows the original spectra of decay citrus and healthy citrus. The two spectral trends are similar. Overall, the reflection absorbance of healthy citrus is higher than that of decay citrus, and spectra exhibit three main peaks. The range of 5200 cm-1–5050 cm-1 is related to the O-H stretching, O-H band binding and deformation of the representative H-O-H of starch content. A peak can be observed at 6988 cm-1 of O-H stretch 1st overtone for the C=O stretch 3rd overtone. The peak in the range of 8500 cm-1 is related to the second overtone of the aromatic structure (33,34). Overall, the absorbance of citrus decreases as the wavenumber decreases. The absorbance based on diffuse reflection spectra can be used for modeling and analysis of healthy and decay citrus samples.

 and decay (diseased) citrus.")
FIGURE 3: Near-infrared mean absorbance spectra of sound (healthy) and decay (diseased) citrus.
Average Near-Infrared Spectra of Citrus Samples with Different Degrees of Decay
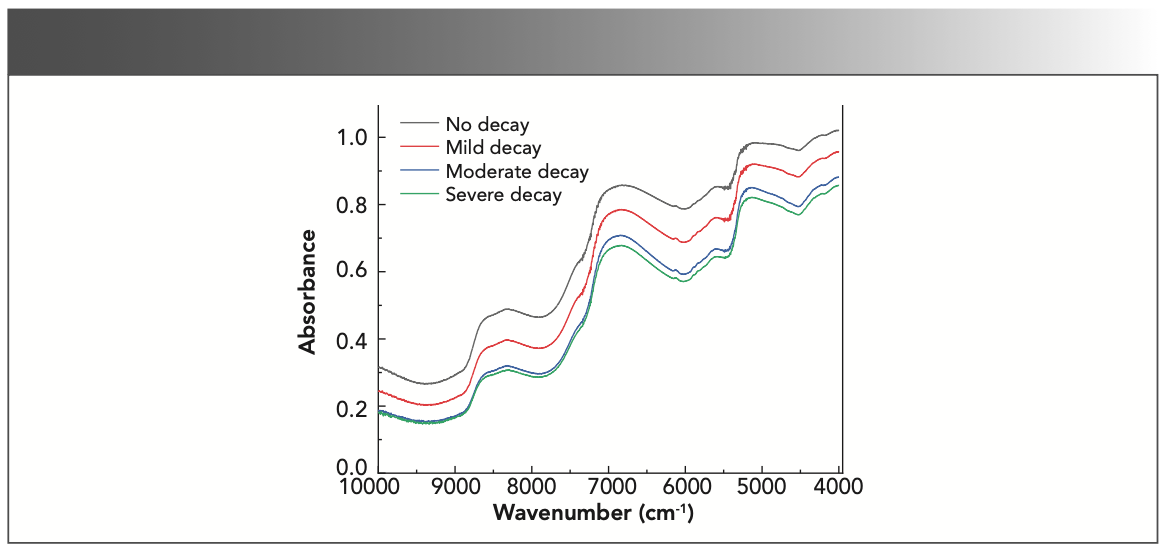
Figure 4 shows the average NIR spectra of citrus samples with different degrees of decay, from which it can be easily seen that overall healthy citrus has the highest absorbance, followed by light decay, moderate decay, and severe decay. As time went by, the chemical properties of citrus in the infected area changed greatly. Based on the differences in spectral information, a series of modeling methods will be used to qualitatively determine the degree of fungal decay.


FIGURE 4: Near-infrared mean spectra of citrus samples with different degrees of decay.
Establishment of Qualitative Discrimination Model for Healthy and Decay Citrus Samples
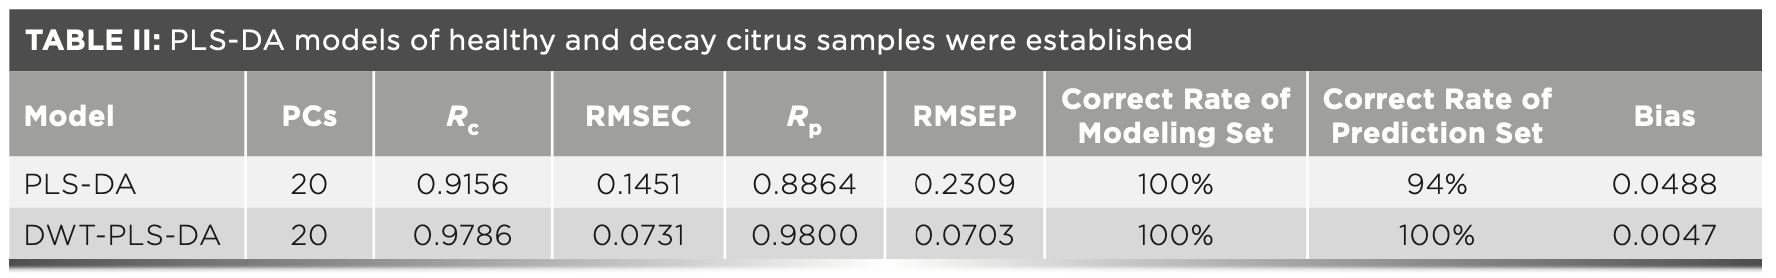
Due to the existence of noise in the spectral information, the DWT was used to process the original spectra, and then the PLS-DA model was established separately with scale size lev = 3, threshold selection method of Heursure function, wavelet basis function of db4, signal-to-noise ratio S/N = 24.0949, and RMS = 0.04289. Table II shows the PLS-DA model based on the full spectral information without preprocessing and DWT processing, which shows that the effect of the spectral matrix after discrete wavelet transform is better than the original spectral information, that the correctness of both the training and prediction sets is 100%, and that the deviation is only 0.0047 with low root mean square error. This indicates that the discrete wavelet transform can better reduce the effect of noise on data processing, so the discrete wavelet transform will be used first in the subsequent modeling of qualitative discrimination of fungal infection degree to optimize the model.


Selection of Characteristic Variables of Fourier Near-Infrared Spectroscopy
The Fourier NIR contains 3111 wavenumbers with more information. To reduce the experimental error and the influence from noise, the selection of suitable feature variables is crucial for later modeling. Too much selection of feature variables and a large amount of irrelevant information will affect the accuracy and stability of the model; on the other hand, insufficient selection of feature variables may lead to the loss of useful information, thus failing to build an accurate model. Therefore, in this paper, discrete wavelet transform is first used to preprocess the spectra, and then PCA, SPA, UVE-SPA, and CARS are used to select characteristic variables for the original data. Reduce data dimension, remove useless information, extract effective spectral variable information.
PCA Based Variable Dimension Reduction
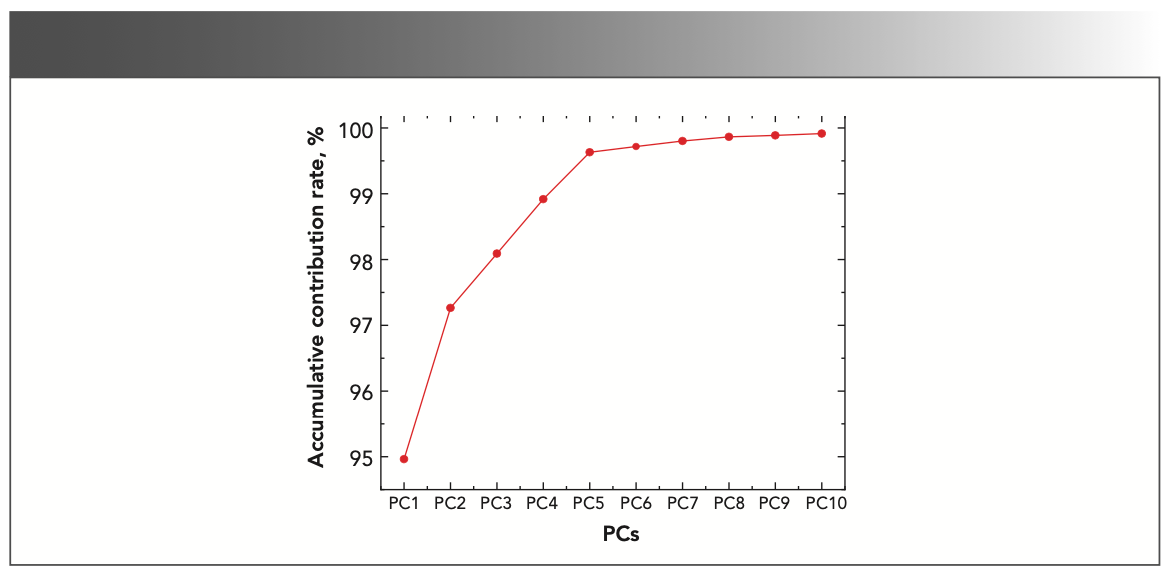
PCA is one of the commonly used methods for dimensionality reduction of data. The transformed variable space is a linear combination of the variables in the original variable space and represents the vast majority of information (24). Figure 5 shows the wavelength variable screening process diagram of the PCA algorithm. The maximum number of principal component factors is set to 20. When eight principal components are selected, the new variable space can represent more than 99.8% of the information of the original spectra.

.")
FIGURE 5: The process of spectra variables selection for PCA (PC vs. variance contribution %).
Feature Wavelength Screening Based on SPA
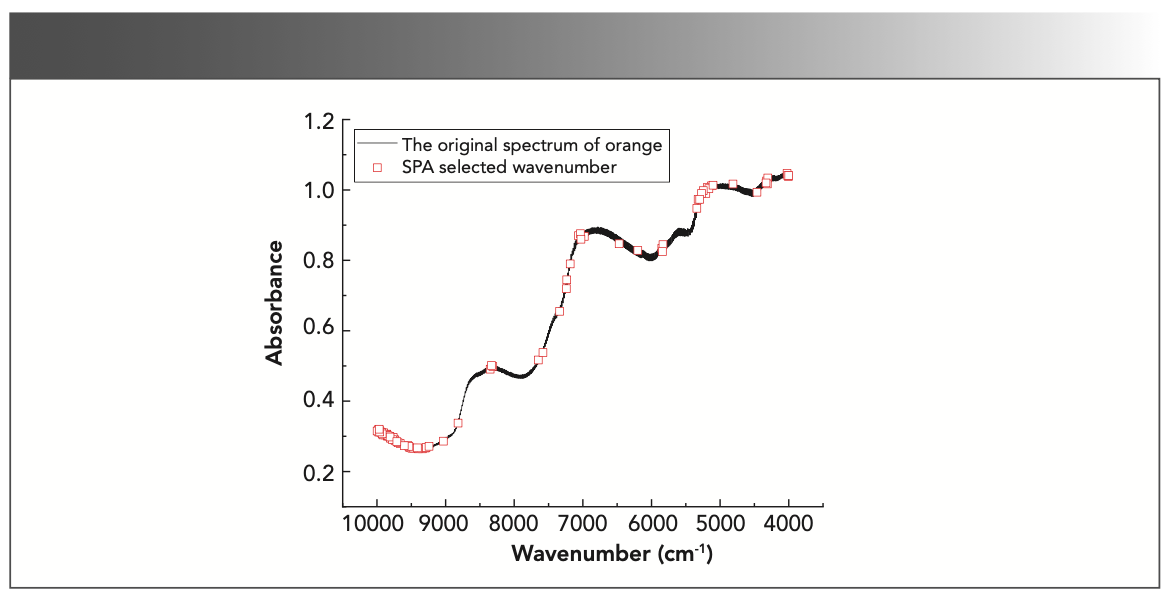
The successive projections algorithm (SPA) is a forward cyclic selection method. The optimal sample set is obtained by calculating the root mean square error of multiple linear regression models of different sample subsets, and the effective wavelength of the minimum redundancy and collinearity is selected by vector projection (26). This model is established in MATLAB2014b, and the minimum and maximum selection variables are set to be 20 and 150. Figure 6 shows the results after the wavelength screening of the sample spectra based on the SPA algorithm, where the horizontal and vertical coordinates represent the wavelength and the average spectral reflectance, respectively. 82 wavenumbers were selected in the original spectra using the SPA algorithm, and only 2.64% of the data were used compared with the original spectra, which can eliminate redundant information to a certain extent and simplify the model, and the variables selected by SPA will be used subsequently for model building.

.")
FIGURE 6: SPA selected wavenumber results (orange circles).
Feature Wavelength Screening Based on UVE-SPA
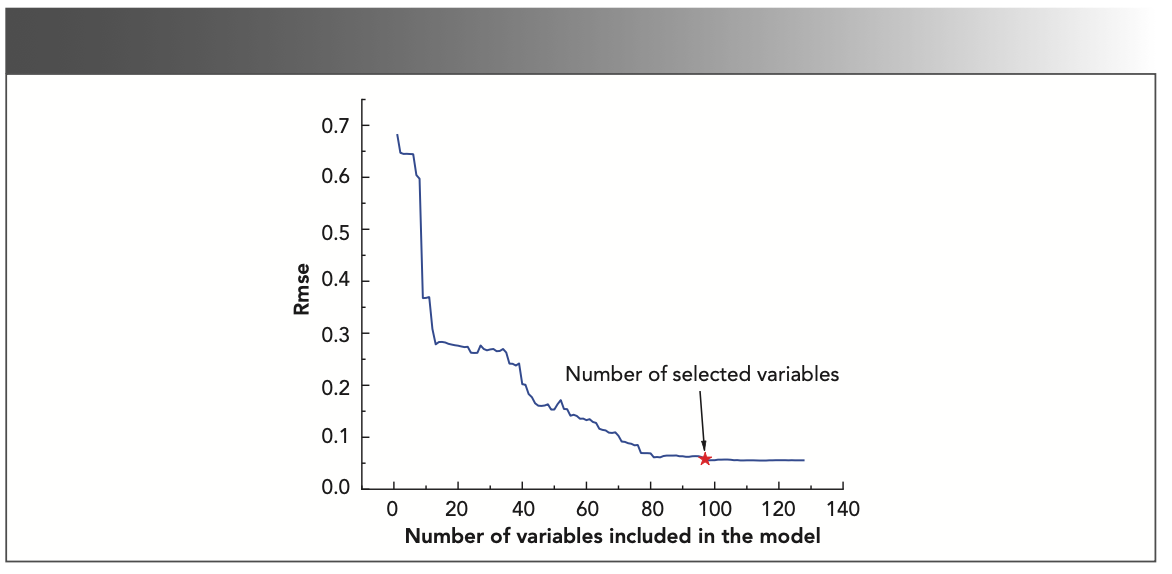
The uninformed variable elimination (UVE) is a band screening method based on the partial least squares (PLS) regression coefficient, and the regression coefficient is used to measure the significance of the band (27). When the UVE algorithm is used alone, although some characteristic wavelength points that have no information are eliminated, there will be a problem of collinearity among the selected characteristic wavelength points. Similarly, when the SPA algorithm is used to extract the characteristic wavelengths, although the collinearity between the characteristic wavelength points is reduced, the selected wavelength subset is likely to contain some uninformative and even interfering wavelengths (35). Therefore, the UVE algorithm and SPA algorithm are combined in this experiment to realize the complementary advantages of the two. UVE generally preserves more wavenumbers. Firstly, 1837 wavenumbers are selected by UVE, and then 97 feature variables are selected by SPA to obtain the most useful characteristic variables. If only using SPA modeling, the UVE-SPA model established will be more conducive to the establishment of a robust discrimination model (Figure 7).
")
FIGURE 7: UVE-SPA wavelength variable selection results. (Red star marks the point of final number of selected variables included in the model.)
Feature Wavelength Screening Based on CARS
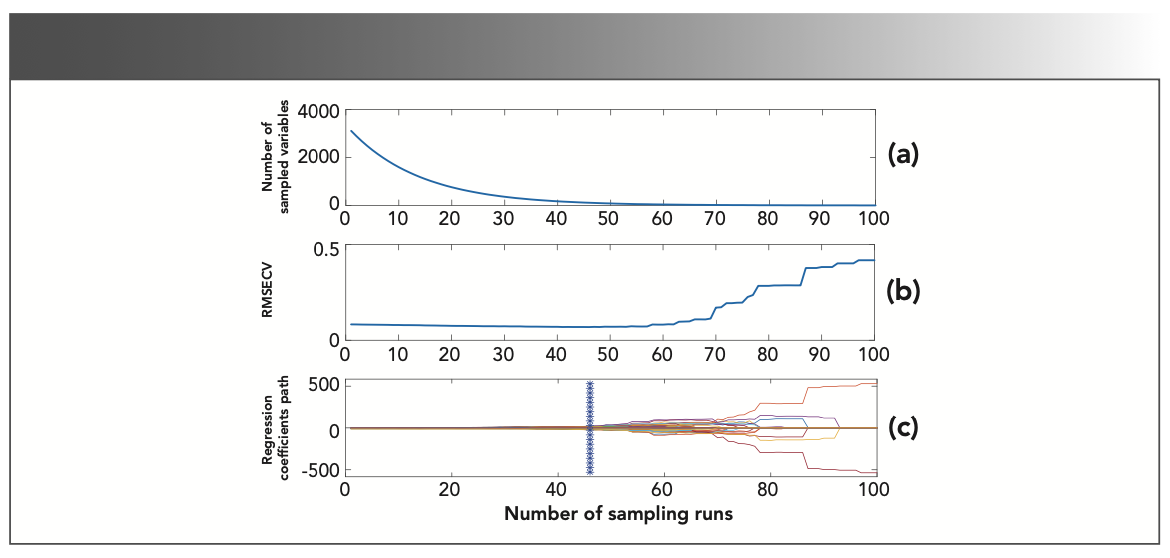
Competitive adaptive reweighted sampling (CARS) is a feature variable selection algorithm combining the Monte Carlo sampling method with partial least squares (PLS) regression coefficient (28). Adaptive reweighted sampling is adopted for CARS. A portion of samples is mainly extracted from the training set for PLS modeling analysis. Through repeated calculation, the subset with the smallest interactive root means square error (RMSECV) is selected as the selected wavelength variable (29). Figure 8 shows the relationship between the number of wavelength variables, interactive root means square error, the regression coefficient of wavelength variables, and the change of sampling times in the CARS algorithm. As can be seen from Figure 8a, the number of retained wavelengths decreases with the increase of sampling times, and then gradually tends to zero. This phenomenon shows the process from rough selection to selection of wavelength variables by CARS algorithm most vividly. Figure 8b shows the trend diagram of the relationship between RMSECV and the sampling times. When the sampling times gradually increase from 1 to 43, the value of RMSECV drops gradually, and the minimum value is obtained at the sampling times of 43. When the sampling times are greater than 43, the RMSECV value increases gradually. The results showed that the CARS algorithm could screen out the information that interfered with the spectra of citrus fungal infection degree when the sampling times were less than 43, while the important information related to citrus fungal infection degree was screened out when the sampling times were greater than 43. Figure 8c shows the relationship between the regression coefficient of the wavelength variable and the number of sampling times. The position of “*” represents the sampling times corresponding to the minimum RMSECV value, and the minimum RMSECV value is 43. Through these variables, most of the information of the whole sample can be replaced and the high precision model can be established.

 Select the number of wavelength variables, (b) the interactive root mean square error, and (c) the regression coefficient of wavelength variables.")
FIGURE 8: CARS variable screening stability result graph. (a) Select the number of wavelength variables, (b) the interactive root mean square error, and (c) the regression coefficient of wavelength variables.
Different Characteristic Variable Selection Methods Combined with Model Establishment of LDA and SVM
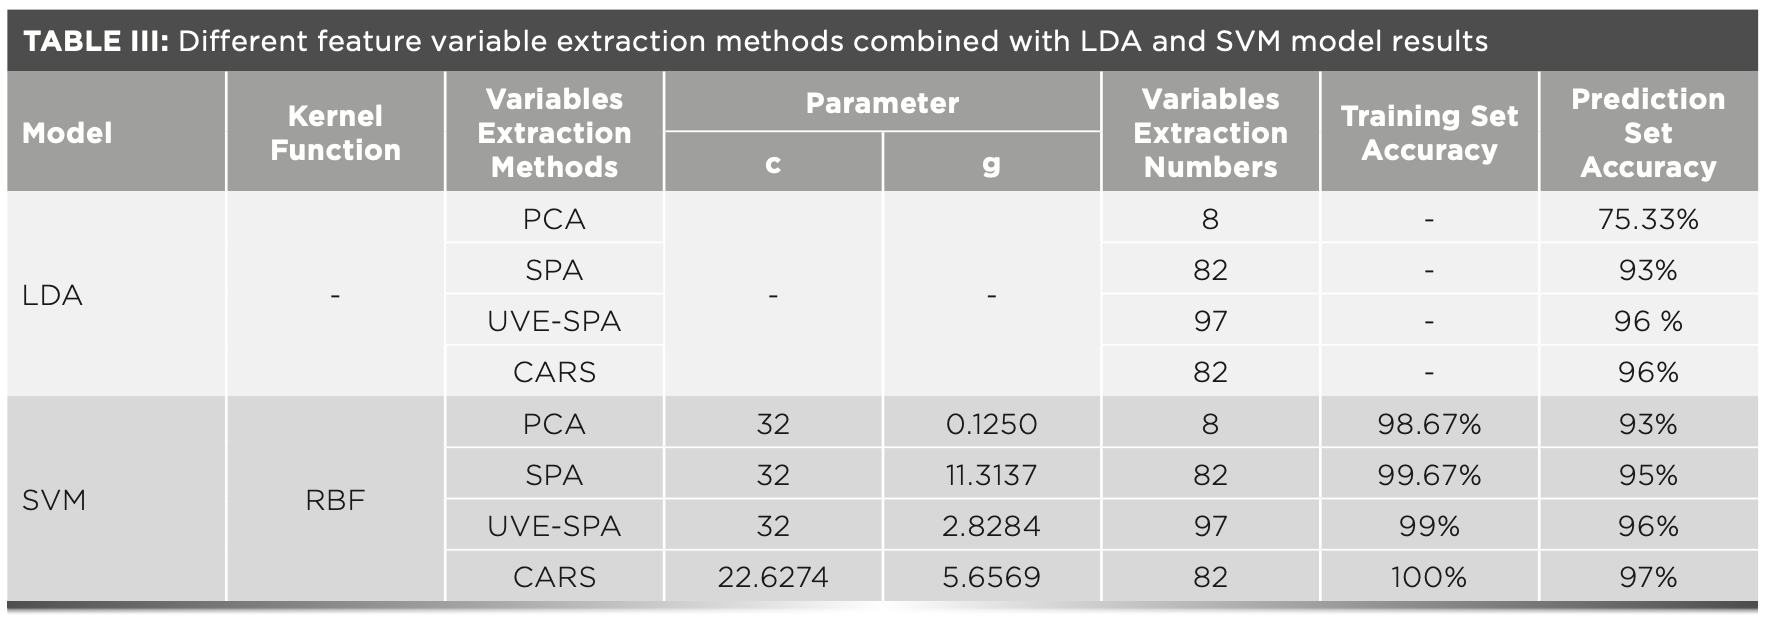
The discriminant models using linear discriminant analysis (LDA) and support vector machine (SVM) classifiers combined with four feature variable selection methods, respectively, are given in Table III, with the parameters, the number of selected variables and the correctness rate. The comparison shows that the SVM model has better performance than the LDA model. The CARS-SVM model based on the RBF kernel function works best with 82 number of selected feature variables, an average correct rate of 100% in the training set and 97% in the prediction set, and the PCA-LDA model works the worst with an average correct rate of 75.33% in the prediction set. This may be due to the ability of support vector machines to identify nonlinear and high-dimensional data and to find the best discriminative boundary by mapping from low to high dimensional space, thus improving the prediction ability and increasing the correct classification rate (29). Among these feature variable selection methods, CARS works the best for both LDA and SVM, and by reweighing the sampling and exponential decay function, CARS can effectively eliminate variables that contribute little to the model, while other variable selection methods more or less ignore some irrelevant information or remove useful information. In summary, this feature extraction method can improve the operation speed and correctness of the discriminative model on FT-NIR spectral analysis.


Conclusion
In this paper, citrus is the research object, and the feasibility of FT-NIR for the detection of early fungal infections in citrus is studied. Firstly, to discriminate whether citrus is fungal infected or not, the PLS-DA model was built based on the original data and DWT, and FT-NIR after DWT treatment showed good potential with 100% correctness in both training and prediction sets. Based on this, the subsequent modeling was also first processed with DWT and then combined with PCA, SPA, UVE-SPA, and CARS, to select feature variables to achieve dimensionality reduction of the spectral matrix. Finally, two qualitative models, LDA and SVM, were used to establish the identification model of the degree of citrus fungal infection. The results showed that the SVM discriminative model based on radial basis function was better than LDA. In addition, the results also showed that the accuracy and robustness of the discriminative model could be well improved by using the feature variable selection method. DWT-CARS- SVM was the best, with 100% and 97% correctness in the training and prediction sets, respectively. Therefore, FT-NIR can be a practical tool for rapid, nondestructive, and accurate detection of early fungal infections in citrus. However, the time interval for identification of infection level in this paper was 3 days, and developing more accurate detection algorithms as well as detection accuracy remains a big challenge, so further research is needed to improve the model.
Funding
This work was supported by the National Natural Science Foundation of China (Grant number: 31760344); National Science and Technology Award Reserve Cultivation Project of Jiangxi Province (Grant number: 20192AEI91007).
Credit Authorship Contribution Statement
Maopeng Li: Writing-Original Draft, Data Curation, Methodology. Yande Liu: Investigation, Validation, Formal Analysis. Jun Hu: Writing (Review and Editing), Validation, Software. Chengtao Su: Resources. Zhen Xu: Resources. Huizhen Cui: Resources
Declaration of Competing Interest
The author(s) declared no potential conflicts of interest with respect to the research, authorship, and/or publication of this article.
References
(1) Itakura, K.; Saito, Y.; Suzuki, T.; Kondo, N.; Hosoi, F. Estimation of Citrus Maturity with Fluorescence Spectroscopy Using Deep Learning. Horticulturae 2019, 5 (1), 2. DOI: 10.3390/horticulturae5010002
(2) Ghanei Ghooshkhaneh, N.; Golzarian, M. R.; Mamarabadi, M. Detection and Classification of Citrus Green Mold Caused by Penicillium digitatum Using Multispectral Imaging. J. Sci. Food Agric. 2018, 98 (9), 3542–3550. DOI: 10.1002/jsfa.8865
(3) Chu, B. Q.; Zhang, H. L.; Luo, W.; He, Y. Spectrosc. Spectral Anal. (Beijing, China) 2017, 37 (8), 2551–2555.
(4) Tian, X.; Fan, S. X.; Huang, W. Q.; Wang, Z. L; Li, J. B. Detection of Early Decay on Citrus Using Hyperspectral Transmittance Imaging Technology Coupled with Principal Component Analysis and Improved Watershed Segmentation Algorithms. Postharvest Biol. Technol. 2020, 161, 111071. DOI: 10.1016/j.postharvbio.2019.111071
(5) Simeone, M. L. F.; Parrella, R. A. C.; Schaffert, R. E.; Damasceno, C. M. B.; Leal, M. C. B.; Pasqiuni, C. Near Infrared Spectroscopy Determination of Sucrose, Glucose and Fructose in Sweet Sorghum Juice. Microchem. J. 2017, 134, 125–130. DOI: 10.1016/j.microc.2017.05.020
(6) Zhang, C.; Su, J. H. Application of Near Infrared Spectroscopy to the Analysis and Fast Quality Assessment of Traditional Chinese Medicinal Products. Acta Pharm. Sin. B 2014, 4 (3), 182–192. DOI: 10.1016/j.apsb.2014.04.001
(7) Pissard, A.; Marques, E. J. N.; Dardenne, P.; Lateur, M.; Pasqiuni, C.; Pimentel, M. F.; Pierna, J. A. F.; Baeten, V. Evaluation of a Handheld Ultra-compact NIR Spectrometer for Rapid and Non-destructive Determination of Apple Fruit Quality. Postharvest Biol. Technol. 2021, 172, 111375. DOI: 10.1016/j.postharvbio.2020.111375
(8) Li, J. B.; Wang, Q. Y.; Xu, L.; Tian, X.; Xia, Y. Fan, S. X. Comparison and Optimization of Models for Determination of Sugar Content in Pear by Portable Vis-NIR Spectroscopy Coupled with Wavelength Selection Al- gorithm. Food Anal. Methods 2019, 12 (1), 12–22. DOI: 10.1007/s12161-018-1326-7
(9) Saputro, A. H.; Juansyah, S. D.; Handayani, W. Banana (Musa sp.) Maturity Prediction System Based on Chlorophyll Content Using Visible-NIR Imaging. In 2018 International Conference on Signals and Systems (ICSig- Sys), Bali, Indonesia, May 1–3, 2018; IEEE; pp 64–68. DOI: 10.1109/ICSIGSYS.2018.8373569
(10) Li, L.; Wu, Y.; Li, L.; Huang, B. Q. Rapid Detecting SSC and TAC of Peaches Based on NIR Spectroscopy. In 2017 2nd IEEE International Conference on Computational Intelligence and Applications (ICCIA), Beijing, Sept 8–11, 2017; IEEE; pp 312–317. DOI: 10.1109/CIAPP.2017.8167229
(11) Daniels, A. J.; Poblete-Echeverría, C.; Opara, U. L.; Nieuwoudt, H. Measuring Internal Maturity Parameters Contactless on Intact Table Grape Bunches Using NIR Spectroscopy. Front. Plant Sci. (New Haven, CT, U.S.) 2019, 10, 1517. DOI: 10.3389/fpls.2019.01517
(12) Lorente, D.; Escandell-Montero, P.; Cubero, S.; Gómez-Sanchiset, J.; Blasco, J. Visible–NIR Reflectance Spectroscopy and Manifold Learning Methods Applied to the Detection of Fungal Infections on Citrus Fruit. J. Food Eng. 2015, 163, 17–24. DOI: 10.1016/j.jfoodeng.2015.04.010
(13) Huang, L.; Meng, L.; Zhu, N.; Wu, D. A Primary Study on Forecasting the Days before Decay of Peach Fruit Using Near-Infrared Spectroscopy and Electronic Nose Techniques. Post-harvest Biol. Technol. 2017, 133, 104–112. DOI: 10.1016/j.postharvbio.2017.07.014
(14) Shenderey, C.; Shmulevich, I.; Alchanatis, V.; Haim, E.; Aharon, H.; Viacheslav, O.; Susan, L.; Ruth, B. A.; Ze’ev, S. NIRS Detection of Moldy Core in Apples. Food Bioprocess Technol. 2010, 3 (1), 79–86. DOI: 10.1007/s11947-009-0256-1
(15) Yang, C. Y.; Yuan, H. F.; Ma, H. L.; Ren, Y. M.; Ren, X. L. Nondestructive Detection of Apple Moldy Core Based on FT-NIR and Electronic Nose Technology. Food Ferment. Ind. 2021, 47 (7), 211–216. DOI: 10.13995/j.cnki.11-1802/ts.025671
(16) Tian, X.; Fan, S. X.; Li, J. B.; Xia, Y.; Huang, W. Q.; Zhao, C. J. Comparison and Optimization of Models for SSC On-line Determination of Intact Apple Using Efficient Spectrum Optimization and Variable Selection Algorithm. Infrared Phys. Technol. 2019, 102, 102979. DOI: 10.1016/j.infrared.2019.102979
(17) Tian, X.; Wang, Q. Y.; Huang, W. Q.; Fan, S. X.; Li, J. B. Online Detection of Apples with Moldy Core Using the Vis/NIR Full-Transmittance Spectra. Postharvest Biol. Technol. 2020, 168, 111269. DOI: 10.1016/j.postharvbio.2020.111269
(18) Pan, X. Y.; Sun, L. J.; Li, Y. S.; Che, W. K.; Ji, Y. M.; Li, J. L.; Li, J.; Xie, X.; Xu, Y. T. Non-destructive Classification of Apple Bruising Time Based on Visible and Near-Infrared Hyperspectral Imaging. J. Sci. Food Agric. 2019, 99 (4), 1709–1718. DOI: 10.1002/jsfa.9360
(19) Abasi, S.; Minaei, S.; Jamshidi, B.; Fathi, D.; Khoshtaghaza, M. H. Rapid Measurement of Apple Quality Parameters Using Wavelet Denoising Transform with Vis/NIR Analysis. Sci. Hortic. (Amsterdam, Neth.) 2019, 252, 7–13. DOI: 10.1016/j.scienta.2019.02.085
(20) Gómez-Sanchis, J.; Martín-Guerrero, J. D.; Soria-Olivas, E.; Martínez-Sober, M.; Magdalena-Benedito, R.; Blasco, J. Detecting Rottenness Caused by Penicillium Genus Fungi in Citrus Fruits Using Machine Learning Techniques. Expert Syst. Appl. 2012, 39 (1), 780–785. DOI: 10.1016/j.eswa.2011.07.073
(21) Kennard, R. W.; Stone, L. A. Computer Aided Design of Experiments. Technometrics 1969, 11 (1), 137–148. DOI: 10.1080/00401706.1969.10490666
(22) Zhang, J.; Yuan, S.; Zhang, J. Detection of Sugar Degree in Strawberry Based on Wavelet Transform-Genetic Algorithm-Partial Least Squares. J. Anal. Sci. 2020, 36 (1), 111–116. DOI: 10.13526/j.issn.1006-6144.2020.01.020
(23) Liu, Y. D.; Li, P. M.; Hu, J.; Xu, Z.; Cui, H. Z. Identification of Coffee-Bean Varieties Using Terahertz Detection Technology. Laser Optoelectron. Prog. 2021, 58 (16), 525–530. DOI: 10.3788/LOP202158.1630002
(24) Qin, B. Y.; Li, Z.; Luo, Z.; Li, Y.; Zhang, H. Terahertz Time-Domain Spectroscopy Combined with PCA-CFSFDP Applied for Pesticide Detection. Opt. Quantum Electron. 2017, 49 (7), 1–12. DOI: 10.1007/s11082-017-1080-x
(25) Zhang, D. Y.; Xu, L.; Wang, Q. Y.; Tian, X.; Li, J. B. The Optimal Local Model Selection for Robust and Fast Evaluation of Soluble Solid Content in Melon with Thick Peel and Large Size by Vis-NIR Spectroscopy. Food Anal. Methods 2018, 12 (1), 136–147. DOI: 10.1007/s12161-018-1346-3
(26) Tang, R. N.; Chen, X. P.; Li, C. Detection of Nitrogen Content in Rubber Leaves Using Near-Infrared (NIR) Spectroscopy with Correlation-Based Successive Projections Algorithm (SPA). Appl. Spectrosc. 2018, 72 (5), 740–749. DOI: 10.1177/0003702818755142
(27) Yu, H. C.; Fu, X. Y.; Yin, Y.; Liu, Y. H.; Bai, X. T. Raman Spectroscopy Combined With UVE-SVR Algorithm to Predict the Content of Trans Fatty Acid in the Edible Oil. J. Nucl. Agric. Sci. 2020, 34 (3), 582–591. DOI: 10.11869/j.issn.100-8551.2020.03.0582
(28) Xia, Z. Y.; Zhang, C.; Weng, H. Y.; Nie, P. C.; He, Y. Sensitive Wavelengths Selection in Identification of Ophiopogon japonicus Based on Near-Infrared Hyperspectral Imaging Technology. Int. J. Anal. Chem. 2017, 6018769. DOI: 10.1155/2017/6018769
(29) Fan, S.; Zhang, B.; Li, J.; Huang, W.; Wang, C. Effect of Spectrum Measurement Position Variation on the Robustness of NIR Spectroscopy Models for Soluble Solids Content of Apple. Biosyst. Eng. 2016, 143, 9–19. DOI: 10.1016/j.biosystemseng.2015.12.012
(30) Xie, H.; Zhao, J.; Wang, Q.; Sui, Y. Y.; Wang, J. K.; Yang, X. M.; Zhang, X. D.; Liang, C. Soil Type Recognition as Improved by Genetic Algorithm-Based Variable Selection Using Near Infrared Spectroscopy and Partial Least Squares Discriminant Analysis. Sci. Rep. 2015, 5 (1), 1–10. DOI: 10.1038/srep10930
(31) Yang, S.; Li, C. X.; Mei, Y.; Liu, W.; Liu, R.; Chen, W. L.; Han, D. H.; Xu, K. X. Discrimination of Corn Variety Using Terahertz Spectroscopy Combined with Chemometrics Methods. Spectrochim. Acta, Part A 2021, 252, 119475. DOI: 10.1016/j.saa.2021.119475
(32) Ji, Y.; Sun, L.; Li, Y.; Li, J.; Liu, S. C.; Xie, X.; Xu, Y. T. Non-Destructive Classification of Defective Potatoes Based on Hyperspectral Imaging and Support Vector Machine. Infrared Phys. Technol. 2019, 99, 71–79. DOI: 10.1016/j.infrared.2019.04.007
(33) Li, X.; Liu, Y. D.; Jiang, X. G.; Wang, G. T. Supervised Classification of Slightly Bruised Peaches with Respect to the Time after Bruising by Using Hyperspectral Imaging Technology. Infrared Phys. Technol. 2021, 113, 103557. DOI: 10.1016/j.infrared.2020.103557
(34) Amanah, H. Z.; Joshi, R.; Masithoh, R. E.; Choung, M. G.; Kim, K. H.; Kim, G.; Cho, B. K. Nondestructive Measurement of Anthocyanin in Intact Soybean Seed Using Fourier Transform Near-Infrared (FT-NIR) and Fourier Transform Infrared (FT-IR) Spectroscopy. Infrared Phys. Technol. 2020, 111, 103477. DOI: 10.1016/j.infrared.2020.103477
(35) Hu, R.; Zhang, L. X.; Yu, Z. Y.; Zhai, Z. Q.; Zhang, R. Y. Optimization of Soluble Solids Content Prediction Models in “Hami” Melons by Means of Vis-NIR Spectroscopy and Chemometric Tools. Infrared Phys. Technol. 2019, 102, 102999. DOI: 10.1016/j.infrared.2019.102999
Maopeng Li, Yande Liu, Jun Hu, Chengtao Su, Zhen Xu, and Huizhen Cui are with the Institute of Intelligent Electromechanical Equipment Innovation, Nanchang, China. Li and Liu are also with the School of Mechatronics & Vehicle Engineering at East China Jiaotong University, in Nanchang, China. Direct correspondence to: jxliuyd@163.com (Yande Liu). ●


Measurement of Ammonia Leakage by TDLAS in Mid-Infrared Combined with an EMD-SG Filter Method
April 9th 2024In this article, tunable diode laser absorption spectroscopy (TDLAS) is used to measure ammonia leakage, where a new denoising method combining empirical mode decomposition with the Savitzky-Golay smoothing algorithm (EMD-SG) is proposed to improve the signal-to-noise ratio (SNR) of absorbance signals.

Childhood Obesity Serum Samples Analyzed Using Fourier Transform Infrared Spectroscopy
April 9th 2024A group of scientists led by Zozan Guleken of the Gaziantep University of Science and Technology in Gaziantep, Turkey looked into the blood serum composition of childhood obesity (CO) tissues using Fourier transform infrared (FT-IR) spectroscopy.

