Detection of Trace Tin(II) by Salicylfluoroketone Complex Fluorescence Method
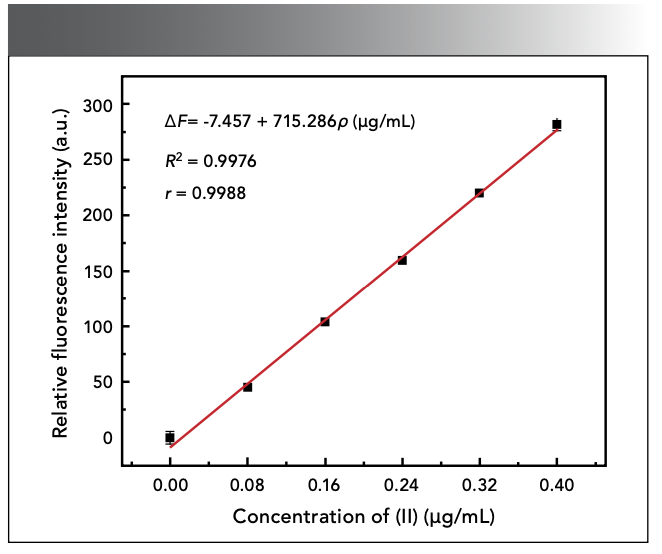
Based on the Sn(II)-salicylfluorescein (SAF)-cetyltrimethylammonium bromide (CTMAB) system, the complex fluorescence method was used to detect Sn(Ⅱ). The method was established by exploring the optimal reaction conditions, and the possible reaction mechanism was discussed. The results showed that the concentration of Sn(Ⅱ) had a good linear relationship with the fluorescence intensity of the system in the range of 0~0.40 µg/mL. The linear regression equation is ΔF = - 7.457 + 715.286ρ (µg/mL), which had a good linearity; the correlation coefficient is 0.9976, and the detection limit of the method was 0.0764 µg/mL. In the detection of Sn(Ⅱ) in synthetic water samples, laboratory wastewater, and canned pineapples, the recovery rates were 95.83%, 104.17%, and 100.0%, which showed good results.
Tin is one of the essential elements for human beings. A small amount of tin can effectively promote the growth of the human body and synthesis of proteins and nucleic acids, which are beneficial to the growth and development of the body; it also can participate in energy metabolism, and enhance the stability of the internal environment. However, ingestion or inhalation of excessive tin may cause adverse symptoms such as dizziness and diarrhea, and tin poisoning can cause damage to the nervous system and liver function. It is therefore of great significance to detect the content of tin in foods and the environment. At present, the reported methods for the detection of trace tin usually include multi-collector inductively coupled plasma mass spectrometry (MC-ICP-MS) (1), iodometry (2,3), spectrophotometry (4–6), energy dispersive X-ray fluorescence (7), resonance light scattering method (8), colorimetry (9), precision coulometric titration (10), multiple flow analysis methods (11), fluorescence (12–15), and cyclic voltammetry (16), among others.
Salicylfluorescein (SAF) is an orange-red crystalline powder, slightly soluble in water and cold ethanol. SAF is a good color developer that can coordinate with various metal ions within the presence of sensitizers. Because of its excellent fluorescence and coordination properties, it is widely used in the fluorescence detection of metal ions (17,18). However, there are few reports on the detection of Sn(Ⅱ) with salicylic fluorescein. Due to the advantages of SAF, a detection method based on Sn(Ⅱ)-SAF-cetyltrimethylammonium bromide (CTMAB) ternary complex system was established in this paper for the detection of trace amounts of Sn(II).
Materials and Methods
Apparatus
F-7100 Fluorescence Spectrophotometer (Hitachi Ltd.); U3900H UV Spectrophotometer (Hitachi Ltd.).
Reagents
Anhydrous ethanol (Sinopharm Chemical Reagent Co., Ltd.), sulfuric acid (Beijing Chemical Factory), ascorbic acid (Tianjin Fuchen Chemical Reagent Factory), oxalic acid (Tianjin Fuchen Chemical Reagent Factory), CTMAB (Tianjin Fuchen Chemical Reagent Factory), SAF (Guangdong Wengjiang Chemical Reagent Co., Ltd.), and standard stock solution of tin (public-private joint venture Xinzhong Chemical Factory); all reagents are of analytical grade.
We prepared 10% oxalic acid solution and 10% ascorbic acid solution with the above reagents and deionized water.
CTMAB (1.0×10⁻² mol/L): CTMAB reagent was accurately weighed 0.3640 g, added to a 150 mL beaker, dissolved with (1+9, v/v) ethanol to water, and diluted to 100 mL.
SAF (1.0×10⁻³ mol/L): SAF was accurately weighed 0.0840 g, added into a 200 mL beaker, then dissolved in 150 mL of ethanol and sulfuric acid (1+1, v/v) 0.50 mL, transferred to a 250 mL volumetric flask, diluted to the mark with water, and finally shaken well; this solution should be protected from light.
Standard stock solution of tin (100.0 µg/mL): Metal tin was accurately weighed 0.1000 g (the surface oxide layer was scraped off) and added into a 100 mL beaker. Then, 5.00 mL of concentrated sulfuric acid was added, dissolved, heated until white smoke was emitted, then taken out and cooled to 25 ℃. Sulfuric acid (1+7, v/v) acid and water was added and transferred to a 1L volumetric flask, then diluted to the mark, shaken well.
Tin standard solution (4.0 µg/mL): Prepared with tin standard stock solution diluted with sulfuric acid (1+7, v/v) in water.
The experimental water used is distilled water.
Experimental Method
A certain amount of tin standard solution was taken into a 50 mL colorimetric tube, with 5.00 mL of sulfuric acid (1+1, v/v), 1.00 mL of ascorbic acid solution, 2.00 mL of oxalic acid solution, and 2.00 mL of CTMAB solution then added in sequence. SAF solution of 2.00 mL was added, diluted with water to the mark, and shaken well. A reagent blank was used as control. After standing for 15 min, the fluorescence intensity of the system was measured, as well as relative fluorescence intensity (ΔF).
Results and Discussion
Fluorescence Spectrum
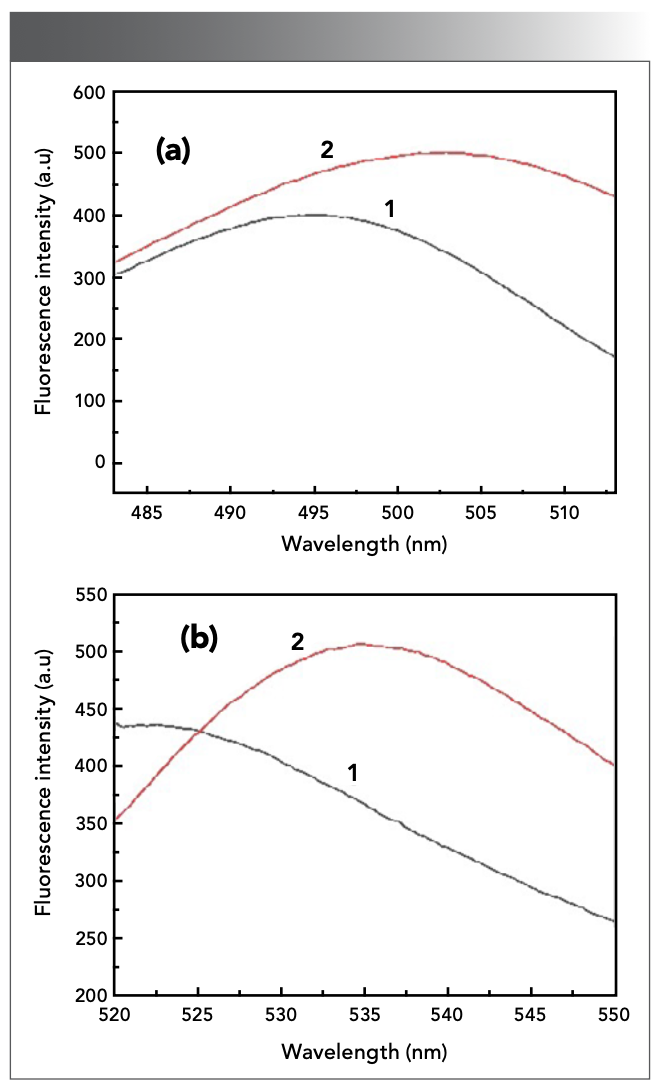
The solution was prepared according to the experimental method, and the emission and excitation spectrum were scanned on the fluorometer, respectively. It can be seen from Figure 1 that the maximum excitation and emission wavelengths of the system were 503 nm and 535 nm. Curve 1 is the fluorescence intensity of the system without adding Sn(II). When an appropriate amount of Sn(II) standard solution is added, the fluorescence intensity of the system is enhanced, and the peak position undergoes a certain red shift, as shown in Curve 2.

 fluorescence excitation and (b) emission spectrum of the reaction system. (1: Blank sample system; 2: The analytical system as previously described).")
Figure 1: (a) fluorescence excitation and (b) emission spectrum of the reaction system. (1: Blank sample system; 2: The analytical system as previously described).
Detection of the Best Experimental Conditions
Effect of Acid Type and Acid Concentration
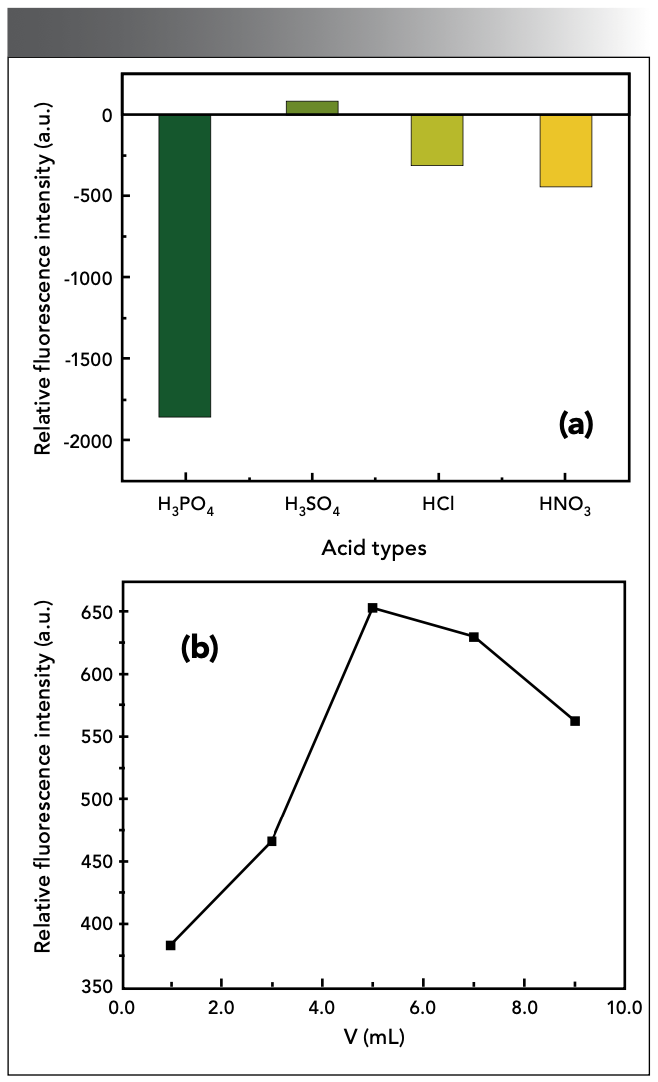
Different kinds of acids have a great influence on the fluorescence intensity of the reaction system. The effects of H2SO4, HCl, HNO3, and H3PO4 on the reaction system were investigated (the volume ratio of acid to water is 1:1). Experiments showed that, in sulfuric acid medium, the system has the most sensitive reaction and the highest fluorescence intensity. The fluorescence of the system is weakened in the medium of hydrochloric acid and phosphoric acid, and the color developer is oxidized in the medium of nitric acid, so it is not desirable (Figure 2a). The results in Figure 2b showed that, when the amount of H2SO4 (1+1, v/v) is 5.00 mL, the ΔF of the system had a maximum value.

 acid type and (b) dosage.")
Figure 2: Effect of (a) acid type and (b) dosage.
Effect of Catalyst Dosage
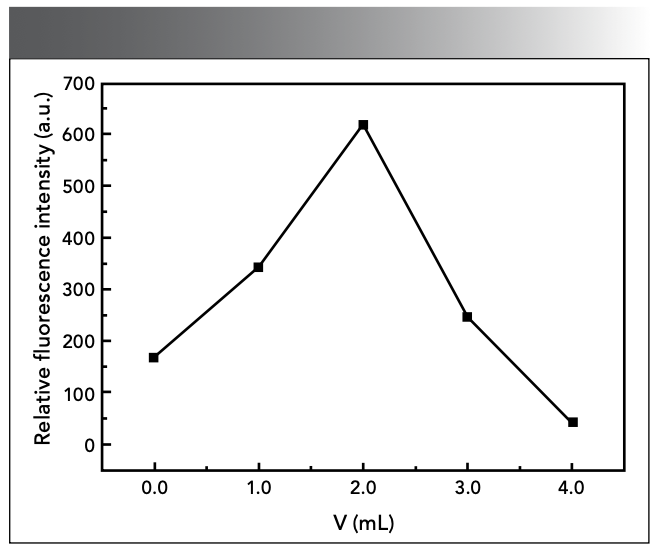
Oxalic acid is necessary to accelerate the color development of the complex (19). As shown in Figure 3, in the experiment, the ΔF was the highest when 2.00 mL of 10% H2C2O4 solution was used in 2.00 mL. Too much or too little oxalic acid will reduce the fluorescence intensity of the system.


Figure 3: Effect of catalyst dosage.
Effect of the Type and Dosage of Surfactant
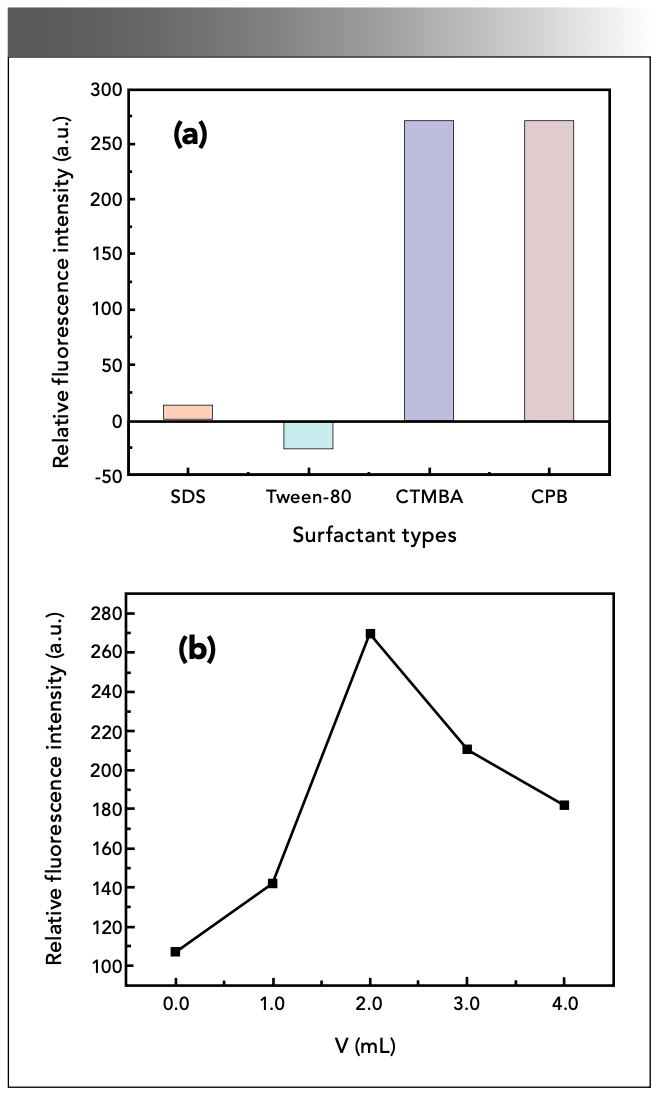
Surfactant can participate in coordination, making the reaction system more stable. The experiments compared CTMAB, cetylpyridinium bromide (CPB), sodium dodecyl sulfonate (SDS), and Tween-80 as surfactant. The results showed that the reaction cannot proceed in the SDS medium, the ΔF of the system in Tween-80 is weakened, and there is almost no difference between the ΔF of the solution in the CTMAB and CPB systems because they have similar sensitizing properties. However, CPB is less stable than CTMAB, and it is easy to generate precipitation, so it is not advisable (Figure 4a). Therefore, CTMAB was selected as the sensitizer in this experiment, and the optimal dosage was 2.00 mL, as shown in Figure 4b.

 acid type and (b) dosage.")
Figure 4: Effect of (a) acid type and (b) dosage.
Effect of Reducing Agent Dosage
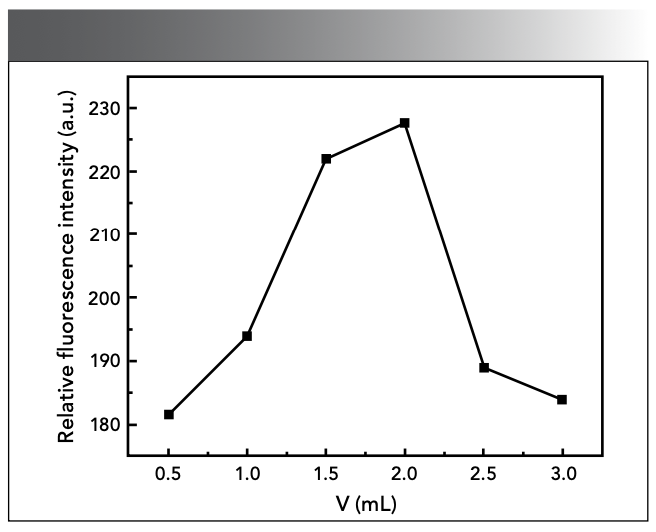
Some metal ions might interfere with the detection of Sn(II), so ascorbic acid should be added into the reaction system, which can be used as both a reducing agent and a masking agent to eliminate the interference of some metal ions.
Figure 5 showed that, when the dosage of ascorbic acid is 1.00 mL, the ΔF had a maximum value. Therefore, 1.00 mL of ascorbic acid is selected.


Figure 5: Effect of reducing agent dosage.
Effect of Color Developer Dosage
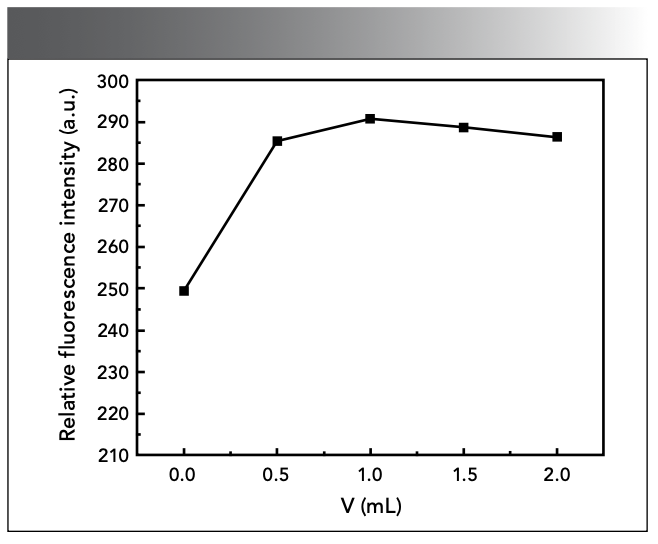
Too much or too little amount of SAF will affect the results of the experiment. If the concentration of SAF is too low, the fluorescence intensity of the system will be too low, and if the concentration is too high, the detection sensitivity will be reduced, which is not conducive to fluorescence detection. The results showed that, when the amount of SAF was 2.00 mL, the ΔF of the system had a maximum value, as shown in Figure 6.


Figure 6: Effect of color developer dosage.
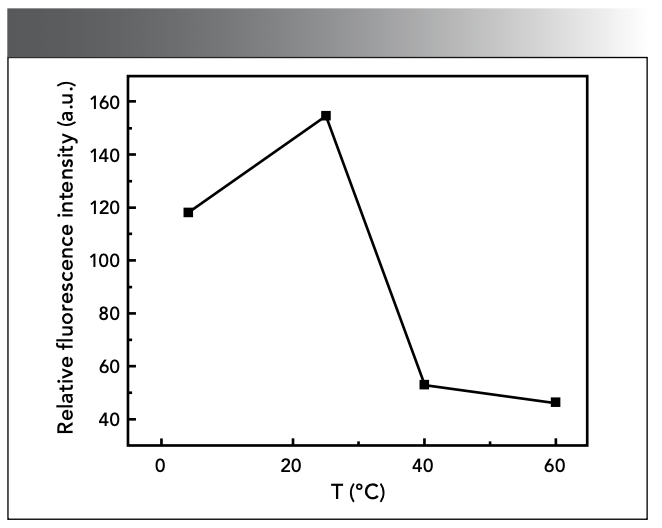
Effect of Reaction Temperature
According to the experimental method, we studied the ΔF of the system at different temperatures. As shown in Figure 7, the ΔF of the system showed a significantly decline trend when the temperature was too low or too high. Therefore, the reaction should be carried out at 25 ℃ in the experiment.


Figure 7: Effect of reaction temperature.
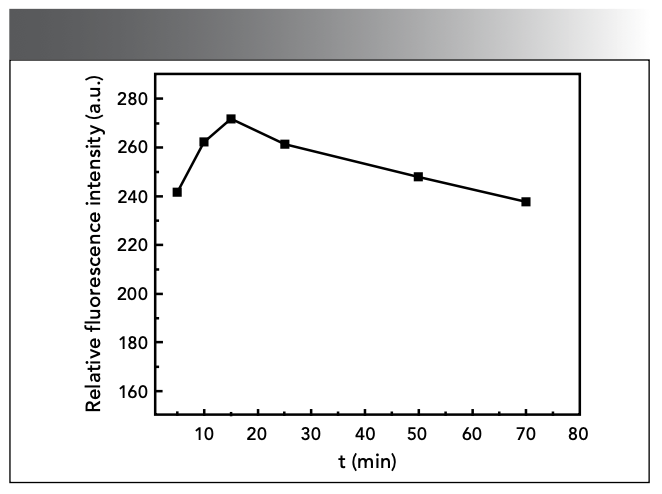
Effect of Reaction Time
The change of reaction time will affect the fluorescence intensity of the reaction system. Figure 8 shows that the reaction reaches a maximum ΔF at 15 min, and is stable for at least 60 min.


Figure 8: Effect of reaction time.
As a result, the optimal conditions were as follows: 5.00 mL of dilute H2SO4 solution, 2.00 mL of H2C2O4 solution, 1.00 mL of ascorbic acid solution, 2.00 mL of CTMAB solution, and 2.00 mL of SAF solution added to a 50 mL colorimetric tube, and placed at 25 °C for 15 min.
The Calibration Curves and Detection Limit
Under the optimal experimental conditions selected in the above experiment, the fluorescence intensity of different amounts of Sn(II) standard solutions were measured according to the experimental method. The results showed that, when the Sn(II) concentration is 0~0.40 µg/mL, the ΔF of the system had a good linear relationship with the Sn(II) concentration, as shown in Figure 9. The linear equation is ΔF = - 7.457 + 715.286ρ (µg/mL), and the linear correlation coefficient is 0.9976. We measured the fluorescence intensity of 11 blank samples to obtain the standard deviation σ, and divided 3σ by the slope of the standard working curve to obtain a detection limit of 0.0764 µg/mL.


Figure 9: Effect of color developer dosage.
Ion Interference Experiment
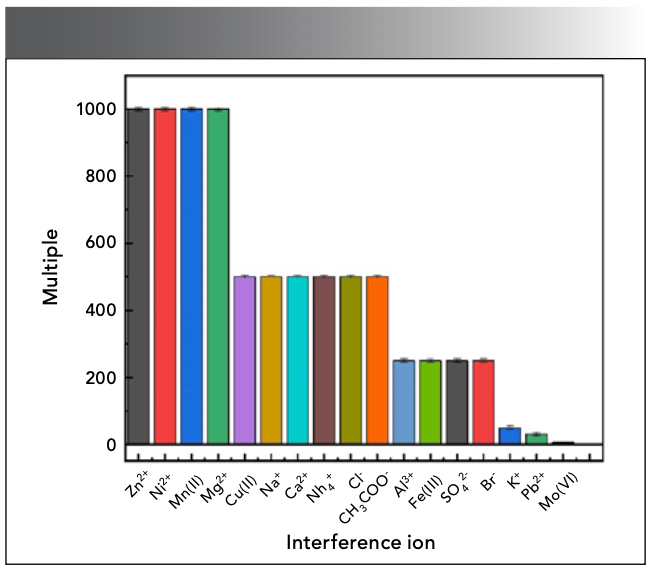
Under certain experimental conditions, the Sn(II) solution of 4.0 µg/mL was measured, different amounts of interfering ions were added to the reaction system, and the relative error of the fluorescence measurement value was controlled within ±5.00%, as shown in Figure 10. Common interfering ions are 1000 times of Zn2+, Ni2+, Mn(II), etc., 500 times of Cu(II), Ca2+, NH4+, CH3COO-, etc, 250 times of Al3+, SO42-, etc., and 50 times of K+; these ions have no effect on the measurement system. In addition, Pb2+ will produce PbSO4 precipitation when it exists in large quantities, and has no effect on the experimental results after filtration. The interference of Mo(Ⅵ) can be eliminated by adding 5.00 mL of 2% hydrazine sulfate to adjust the acidity to 1 mol/L, and heating it in a boiling water bath for 20 min.


Figure 10: Effect of color developer dosage.
Detection of the Ratio of Complexes
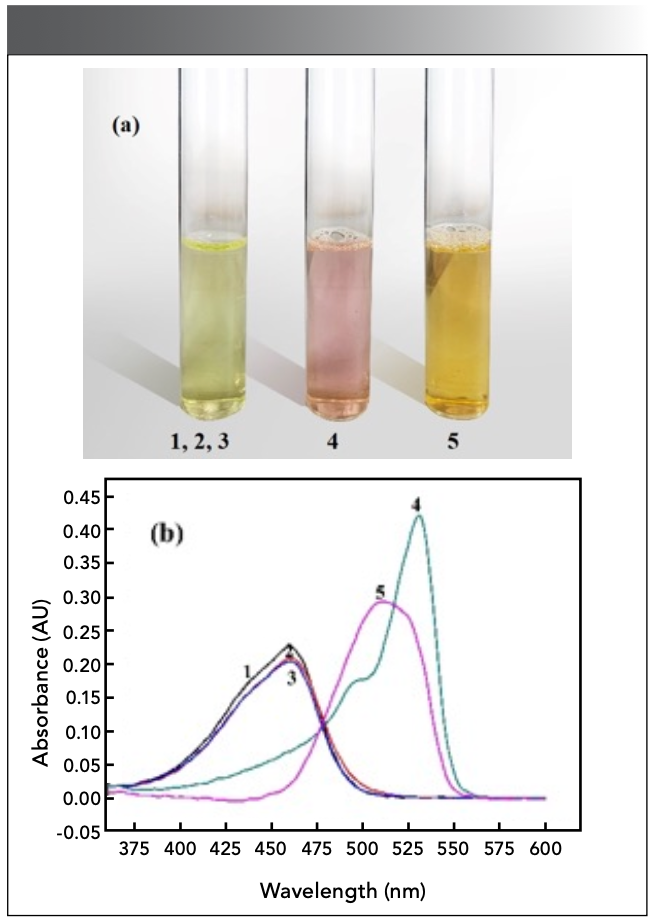
The experiment revealed two color changes in the solution (Figure 11a). When there is no CTMAB, tin cannot react directly with salicylfluorescein, and the system cannot proceed without tin (Figure 11b, Curves 1–3). In the presence of CTMAB, Sn(II) and salicyl fluorescein can form complexes with different absorption peaks under different conditions. When the concentration of Sn(II) is excessive, a red complex at λ = 531 nm can be generated in the reaction system (Curve 4). When the concentration of the color developer is several times the concentration of Sn(II), an orange complex can be formed at 510 nm (Curve 5).

 color change of solution and (b) UV positions of complex peaks.
1. c(SAF) = 1.98×10⁻² mg/mL (water reference)
2. c(SAF) = 1.67×10⁻⁴ mol/L; c(CTMAB) = 2.0×10⁻³ mol/L (water reference)
3. c(SAF) = 1.67×10⁻⁴ mol/L; c(Sn) = 3.96×10⁻² mg/mL (water reference)
4. c(SAF) = 1.67×10⁻⁴ mol/L; c(Sn) = 7.93×10⁻² mg/mL
c(CTMAB) = 2.0×10⁻³ mol/L (water reference)
5. c(SAF) = 5.0×10⁻⁴ mol/L; c(Sn) = 2.97×10⁻³ mg/mL
c(CTMAB) = 2.0×10⁻³ mol/L (Use 4.0×10⁻⁴ mol/L reagent solution as a reference).")
Figure 11: (a) color change of solution and (b) UV positions of complex peaks.
1. c(SAF) = 1.98×10⁻² mg/mL (water reference)
2. c(SAF) = 1.67×10⁻⁴ mol/L; c(CTMAB) = 2.0×10⁻³ mol/L (water reference)
3. c(SAF) = 1.67×10⁻⁴ mol/L; c(Sn) = 3.96×10⁻² mg/mL (water reference)
4. c(SAF) = 1.67×10⁻⁴ mol/L; c(Sn) = 7.93×10⁻² mg/mL
c(CTMAB) = 2.0×10⁻³ mol/L (water reference)
5. c(SAF) = 5.0×10⁻⁴ mol/L; c(Sn) = 2.97×10⁻³ mg/mL
c(CTMAB) = 2.0×10⁻³ mol/L (Use 4.0×10⁻⁴ mol/L reagent solution as a reference).
Detection of Complex Ratio
The equimolar continuous change method was used to explore the composition of the complexes (Figure 12a–c). It can be seen from the Figure 12 that, when the concentration of CTMAB is excessive, there is an equimolar continuous change of Sn(II) and salicyl fluorescein. At 510 nm, the complexes (Figure 12a1) with the composition ratio of Sn:SAF = 1:4 were obtained. At 531 nm, complexes (Figure 12a2) with the composition ratio of Sn:SAF = 1:2 were obtained.

. c(CTMAB) = 2.0×10⁻³ mol/L; Sn and SAF change continuously;
(b). c(SAF) = 4.0×10⁻⁴ mol/L; Sn and CTMAB change continuously;
(c). c(Sn) = 4.75×10⁻² mg/mL; SAF and CTMAB change continuously.")
Figure 12: Equimolar continuous change diagram of Sn-SAF-CTMAB complex.
(a). c(CTMAB) = 2.0×10⁻³ mol/L; Sn and SAF change continuously;
(b). c(SAF) = 4.0×10⁻⁴ mol/L; Sn and CTMAB change continuously;
(c). c(Sn) = 4.75×10⁻² mg/mL; SAF and CTMAB change continuously.
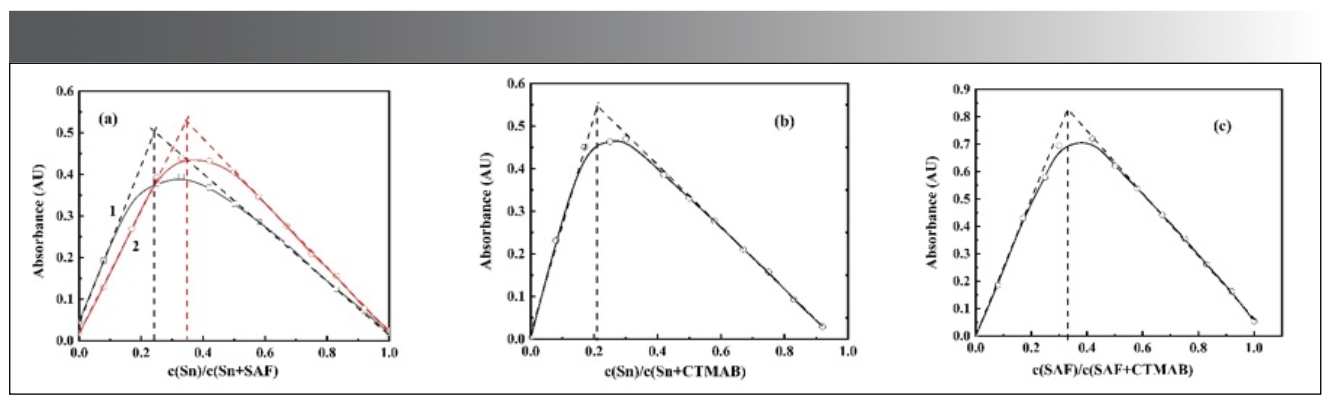
When the concentration of the fixed developer is excessive, the complex (b) with a composition ratio of Sn:CTMAB = 1:4 can be obtained at 510 nm. When the concentration of Sn(II) is excessive, the complex (c) with the composition ratio of SAF:CTMAB = 1:2 is obtained at 531 nm.
Considering the above three situations comprehensively, it can be confirmed that, when SAF exists in excess, a complex with the maximum absorption peak at 510 nm can be formed in sulfuric acid medium, and its composition ratio is Sn:SAF:CTMAB = 1:4:4. When the metal tin is in excess, a complex with a composition ratio of Sn:SAF:CTMAB = 1:2:4 is obtained at the maximum absorption peak of 531 nm. Since the reagent must be excessive in the detection of Sn(II), the complex at 510 nm should be selected in the actual detection.
The Discussion of Reaction Mechanism
According to the experiment, it is speculated that the mechanism is that in the Sn-SAF-CTMAB color system, the process of the mutual conversion of two different complexes can be expressed as follows:


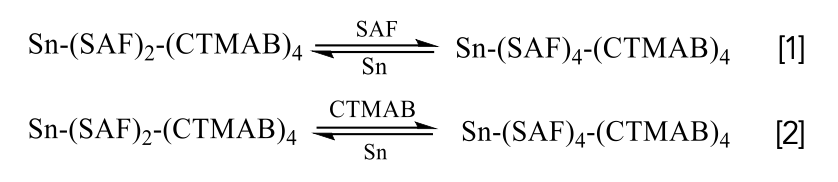
Under weakly acidic experimental conditions, SAF mainly exists in the form of molecules and is prone to self-polymerization to generate its own large fluorescence intensity. SAF forms complex anions with Sn(II) and then forms ionic associations with CTMAB through electrostatic interaction; due to the larger volume of the ionic associates formed, the fluorescence intensity of the system increases. The possible reaction mechanism of the system is shown in Figure 13.


Figure 13: Possible reaction mechanism of the system.
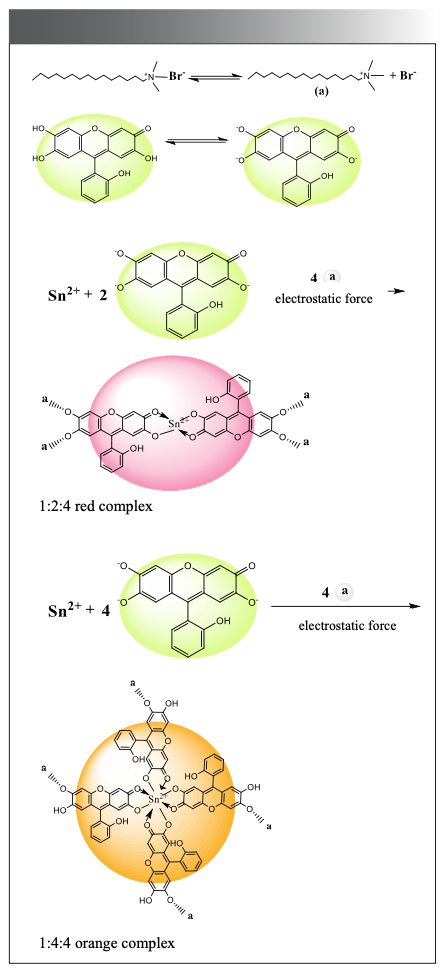
It can be seen from the above configuration that, because of the hydroxyl group at the 2-position of the color developer molecule, the orange complex does not associate with CTMAB, but is in an undissociated state; the absorption peak of the orange complex is higher than that of the red complex. There is a certain degree of blue shift in the absorption peak (20).
Sample Analysis
The synthetic water sample was prepared by adding an appropriate amount of tin to tap water to prepare a certain concentration of Sn(II)-containing water sample (containing 1.0 mL of Zn2+, Mg2+, Ni2+, Ca2+, and Cl-), and then diluted to a 50 mL volumetric flask for use.
80 mL of laboratory wastewater was put on an electric hot plate and slowly heated to 40 mL, adding polyamide resin to absorb impurities. Then, after shaking for 1 h, it was left to stand for the night to clear, after which the volume was diluted to 50 mL with distilled water.
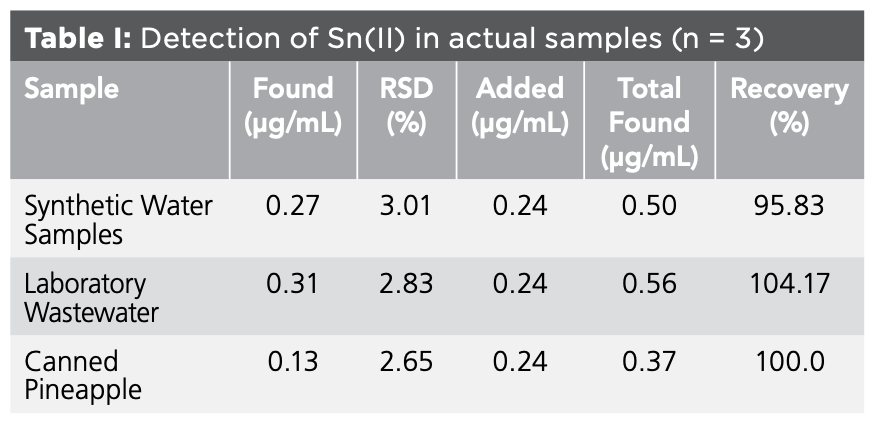
Canning is one of the main ways of food storage, but because the tin-plated sheet interacts with food or the solder coating is not strong, tin dissolution often occurs. Therefore, the detection of tin content in canned food is necessary (21–23). The residue limit of tin in food is specified in GB5009.16-2014 as 250 mg/kg. The samples were processed according to the literature (24) and used for later use. Under the optimal experimental conditions, the content of Sn(II) was determined according to the experimental method, and the recovery rate of standard addition was determined at the same time. The detection results are shown in Table Ⅰ.


Conclusions
A method for the detection of trace Sn(II) by salicyl fluorescein complex fluorescence method was established. With the increase of Sn(II) concentration, the fluorescence intensity of the system gradually increases, and ΔF has a good linear relationship with the Sn(II) concentration within a certain range, which can be used to detect the content of Sn(II). Experiments were performed under optimal experimental conditions. The results show that the Sn(II) concentration has a good linear relationship with ΔF in the range of 0~0.40 μg/mL. The standard working curve is: ΔF = - 7.457 + 715.286ρ (µg/mL), the correlation coefficient is 0.9976, and the detection limit is 0.0764 μg/mL. Through the electrostatic force of cetyltrimethylammonium bromide, the ratio of salicylfluorescein to Sn(II) is: 1:4:4 orange ternary complex. In the detection of Sn(II) in synthetic water samples, laboratory wastewater and canned pineapples, it was found that the content of Sn(II) in the cans was within the specified range of food, which was edible, the recovery rates were 95.83%, 104.17%, and 100.0%, respectively, and the results were good.
Acknowledgments
We thank the Instrument Analysis Center of Lanzhou Jiaotong University. The authors acknowledge the financial support from the National Natural Science Foundation of China (No. 62075007).
References
(1) Brügmann, G.; Berger, D.; Pernicka, E. Determination of the Tin Stable Isotopic Composition in Tin-Bearing Metals and Minerals by MC-ICP-MS. Geostand. Geoanal. Res. 2017,41 (3), 437–448. DOI: 10.1111/ggr.12166
(2) Schweinsberg, D. P.; Heffernan, B. J. Determination of Tin in Ores and Concentrates. Talanta 1970, 17 (4), 332–334. DOI: 10.1016/0039-9140(70)80220-x
(3) Kudaka, A. A.; Galuza, M. G.; Vorobyova, T. N. Titrimetric Determination of Tin(II, IV) in Electrolytes Used in Electroplating for the Deposition of Sn, Cu–Sn, and Ni–Sn Coatings. J. Anal Chem. 2021, 76, 898–905. DOI: 10.1134/S106193482107008X
(4) Luke, C. L. Spectrophotometric Determination of Tin in Steel. Anal. Chim. Acta 1967, 37, 97–101. DOI: 10.1016/s0003-2670(01)80643-7
(5) Gutierrez, A. M.; Laorden, M. V.; Sanz-Medel, A.; Nieto, J. L. Spectrophotometric Determination of Tin(IV) by Extraction of the Ternary Tin/Iodide/5,7-dichloro-8-quinolinol Complex. Anal. Chim. Acta 1986, 184, 317–322. DOI: 10.1016/s0003-2670(00)86499-5
(6) El-Shahawi, M. S.; Abu Zhuri, A. Z. Sequential Titrimetric and Spectrophotometric Determinations of Trace Amounts of Tin(II) and Tin(IV) by Amplification Reactions. Bull. Chem. Soc. Jpn. 1998,71 (3), 597–601. DOI: 10.1246/bcsj.71.597
(7) Lerner, N.; Sedgi, I.; Chernia, Z.; Zeiri, O. Rapid Direct Determination of Tin in Beverages Using Energy Dispersive X-ray Fluorescence. Talanta 2019, 199,662–666. DOI: 10.1016/j.talanta.2019.03.024
(8) Cimerman, C.; Ariel, M. A Microvolumetric Determination of Tin in Tin-Base and Lead-Base Alloys. Anal. Chim. Acta 1953,9, 10–21. DOI: 10.1016/S0003-2670(01)80727-3
(9) Onishi, H.; Sandell, E. B. Colorimetric Determination of Traces of Tin with Dithiol. Anal. Chim. Acta 1956, 14, 153–161. DOI: 10.1016/0003-2670(56)80142-6
(10) Yoshimori, T.; Matsubara, I.; Tanaka, T; Yoshida, K.; Tanaka, K.; Tanabe, T. The Determination of Tin in Tin Metal and in Zircaloy by Precise Coulometric Titration. Bull. Chem. Soc. Jpn. 1971,44 (3), 734–737. DOI: 10.1246/bcsj.44.734
(11) Dias, T. R.; Reis, B. F. Development of a Photometric Procedure for Tin Determination in Canned Foods Employing a Multicommuted Flow Analysis Approach. Anal. Meth. 2016, 8, 3620–3628. DOI: 10.1039/C5AY02958A
(12) Anderson, J. R. A.; Lenzer Lowy, S. A Fluori Metric Determination of Tin. Anal. Chim. Acta 1956, 15, 246–253. DOI: 10.1016/0003-2670(56)80044-5
(13) Boa Morte, E. S.; Korn, M. G. A.; Saraiva, M. L. M. F. S.; Lima, J. L. F. C.; Pinto, P. C. A. G. Sequential Injection Fluorimetric Determination of Sn in Juices of Canned Fruits. Talanta 2009, 79 (4), 1100–1103. DOI: 10.1016/j.talanta.2009.02.019
(14) Jiaming, L.; Guohui, Z.; Tianlong, Y.; Aihong, W.; Yan, F.; Longdi, L. Determination of Trace Tin by Solid Substrate-Room Temperature Phosphorimetry Using Sodium Dodecyl Sulfate as Sensitizer. Spectrochim. Acta, Part A 2003, 59 (9), 2081–2085. DOI: 10.1016/s1386-1425(03)00005-2
(15) Jourquin, G.; Mahedero, M. C.; Paredes, S.; Vire, J.- C.; Kauffmann, J.- M. Fluorimetric Determination of Tin and Organotin Compounds in Hydroorganic and Micellar Media in the Presence of 8-hydroxyquinoline-5-sulfonic Acid J. Pharm. Biomed. Anal. 1996,14 (8–10), 967–975. DOI: 10.1016/s0731-7085(96)01795-5
(16) Kim, D; Chang, J. Determination of Stannous Chloride and Stannic Bromide Speciation in Concentrated Cl− and Br− Media by Cyclic Voltammetry. J. Electroanal. Chem. 2017, 785, 20–25. DOI: 10.1016/j.jelechem.2016.12.004
(17) Zhu, X.; Jiang, R. Determination of Iron(III) by Room Temperature Ionic Liquids/Surfactant Sensitized Fluorescence Quenching Method. J. Fluoresc. 2011, 21, 385–391. DOI: 10.1007/s10895-010-0727-9
(18) Wu, J.; Zhu, Z.; Zhu, X.; Shi, L. Fluorescence Quenching Method for Determination of Trace Tungsten in Soil After Cloud Point Extraction. Anal Lett. 2010, 43 (14), 2184–2192. DOI: 10.1080/00032711003698572
(19) Liang, C.; Tang, B.; Zhang, X.; Fu, F. Mobility and Transformation of Cr(VI) on the Surface of Goethite in the Presence of Oxalic Acid and Mn(II). Environ. Sci. Pollut. Res. 2020, 27, 26115–26124. DOI: 10.1007/s11356-020-09016-4
(20) Fan, X.; Zhang, S.; Li, R; et al. Cotton Swabs Decorated with Ag@BPQD for the Fluorescence Determination of 3-aminosalicylic and 5-aminosalicylic Acid. Microchim. Acta 2023, 190. DOI: 10.1007/s00604-023-05665-7
(21) Pasias, I. N.; Papageorgiou, V.; Thomaidis, N. S.; Proestos, C. Development and Validation of an ETAAS Method for the Determination of Tin in Canned Tomato Paste Samples. Food Anal. Methods 2012, 5, 835–840. DOI: 10.1007/s12161-011-9320-3
(22) Stübs, R.; Heldt, N. Die Bestimmung des Zinnionen-Gehalts in Ananaskonserven. Chemkon 1999, 6 (2), 75–79. DOI: 10.1002/ckon.19990060205
(23) Chung, S. W. C.; Wu, A. H. T. Determination of Butyltins, Phenyltins and Octyltins in Foods with Preservation of Their Moieties: A Critical Review on Analytical Methods. J. Chromatogr. A 2017,1505, 18–34. DOI: 10.1016/j.chroma.2017.05.014
(24) Mol, S. Determination of Trace Metals in Canned Anchovies and Canned Rainbow Trouts. Food Chem. Toxicol. 2011, 49 (2), 348–351. DOI: 10.1016/j.fct.2010.11.005
Han Feng, Sheng Li, Zhang Xin, and Su Bi-quan are with the School of Chemistry and Chemical Engineering at Lanzhou Jiaotong University, in Lanzhou, China; Li Hai-su is with the Key Institute of Lightwave Technology at Beijing Jiaotong University, in Beijing, China. Direct correspondence to: Han Feng at hf929795657@163.com ●


Tracking Molecular Transport in Chromatographic Particles with Single-Molecule Fluorescence Imaging
May 18th 2012An interview with Justin Cooper, winner of a 2011 FACSS Innovation Award. Part of a new podcast series presented in collaboration with the Federation of Analytical Chemistry and Spectroscopy Societies (FACSS), in connection with SciX 2012 ? the Great Scientific Exchange, the North American conference (39th Annual) of FACSS.


Measurement of Ammonia Leakage by TDLAS in Mid-Infrared Combined with an EMD-SG Filter Method
April 9th 2024In this article, tunable diode laser absorption spectroscopy (TDLAS) is used to measure ammonia leakage, where a new denoising method combining empirical mode decomposition with the Savitzky-Golay smoothing algorithm (EMD-SG) is proposed to improve the signal-to-noise ratio (SNR) of absorbance signals.


