Determination of Trace Nickel(ΙΙ) Using a Kinetic Fluorescence Method with a Morin-Hydrogen Peroxide System
Nickel (Ni[Ⅱ]) was used to catalyze the hydrogen peroxide oxidation of morin to weaken its fluorescence. In Na2B4O7-NaOH buffer solution at pH 10.10, Ni(Ⅱ) has an obvious catalytic effect on the oxidation of morin by H2O2 solution. At the maximum excitation and emission wavelengths (λex = 440 nm and λem = 530 nm), the fluorescence intensity of the system is linearly correlated with the concentration of Ni(II) within a certain range. The linear equation is ΔF = 11463ρ (μg/mL) − 34.70, and the R2 = 0.9992. The linear range is 1.6 × 10⁻² − 9.6 × 10⁻² μg/mL, and the detection limit was 2.9 × 10⁻⁴ μg/mL. Finally, the samples of tap water, Yellow River water and tea were analyzed, with the recoveries being 99.6%, 107.3%, and 104.6%, respectively. This method is suitable for the determination of trace Ni(II) in water samples.
Nickel is an essential element for the human body. The content of nickel is extremely trace, usually only about 10 mg in an adult. The daily requirement of nickel for adults is 0.3 mg. Nickel deficiency can cause diabetes, anemia, liver cirrhosis, uremia, renal failure, abnormal liver lipid and phospholipid metabolism, and other diseases. The excessive intake of nickel will also have a great impact on human health (1). The research shows that the nickel content in well water, river water, soil, and rock is positively correlated with the mortality of nasopharyngeal cancer. Nickel can also affect fertility, which is teratogenic and mutagenic. Nickel has two valence states: Ni(Ⅱ) and Ni(Ⅲ), with nickel mainly existing in the form of Ni(Ⅱ) within living organisms (2). Presently, the methods for the determination of trace amounts of Ni(II) mainly include atomic absorption spectrometry (3–5), spectrophotometry (6–8), fluorescence spectrometry (9–11), inductively coupled plasma atomic emission spectrometry (12), electrochemical methods (13–14), and so on. Fluorescence spectrophotometry is widely used because of its high sensitivity, low sample consumption, and simple operation. Morin (15–18) is a pigment with the IUPAC name of (3,2,4,5,7-pentahydroxyflavone), which belongs to the flavonoids. It can be extracted from the bark of mulberry plants, such as yellow mulberry, mulberry orange tree, and many Chinese herbal medicines. Morin is a commonly used analytical reagent for polyhydroxy flavonoids, and its most important use is as a fluorescent reagent for the sensitive determination of metal ions and non-metal ions. Based on the literature (19), we found that in the Na2B4O7-NaOH buffer solution at pH 10.10, the oxidation of morin by H2O2 can be catalyzed by trace amount of Ni(II), which can cause the fluorescence quenching of morin. The concentration of Ni(II) has a good linear relationship with fluorescence intensity.
Materials and Methods
Apparatus
F-7100 fluorescence spectrophotometer (Hitachi Ltd., Japan); U-3900H UV-Vis spectrophotometer (Hitachi Ltd., Japan); pHS-3C acidity meter (Shanghai Leici Co. Ltd); HH-2 digital display thermostatic Water Bath (Guohua Electric Appliance Co., Ltd.); BS 110S Electronic Balance (Beijing Sartorius Instrument System Co., Ltd..)
Reagents
Borax was acquired from Beijing Chemical Reagent Factory; Morin was acquired from Merck, Darmstadt; Sodium hydroxide was acquired from Tianjin Damao Chemical Reagent Factory. Absolute ethanol was purchased from Sinopharm Chemical Reagent Co., Ltd. The hydrogen peroxide was bought from Shanghai Ruiteliang Chemical Co., Ltd. Nickel chloride in hexahydrate was bought from Nanjing Chemical Reagent Co., Ltd. Sodium fluoride was bought from Hubei Bolan Chemical Co., Ltd. Sodium thiosulfate was bought from Anhui Zhixin Chemical Co., Ltd. The hydrochloric acid was bought from Baiyin Liangyou Chemical Reagent Co., Ltd. The water for analysis was deionized water, and the reagents used were all of analytical grade.
A 0.05 mol/L Borax solution, a 0.2 mol/L sodium hydroxide solution, a 1.32 × 10⁻³ mol/L morin ethanol solution, a 3.0% (V/V) H2O2 solution, a 2 mol/L dilute hydrochloric acid, a 20.0 g/L sodium fluoride solution, and a 100 g/L sodium thiosulfate solution were used. The above reagents were prepared with deionized water.
The Na2B4O7-NaOH buffer solution at pH 10.10 was prepared by 0.05 mol/L borax solution and 0.2 mol/L sodium hydroxide solution accurately.
The Ni(II) standard stock solution (1.00 g/L) was prepared by nickel chloride hexahydrate accurately, and diluted to 2.0 μg/mL Ni(II) standard working solution before use.
Experimental Method
25 mL colorimetric tubes were used in this experiment. In each tube, 1.00 mL Na2B4O7-NaOH buffer solution at pH 10.10, 1.00 mL morin solution, and a certain volume of 2.0 μg/mL Ni(Ⅱ) solution was added accurately, then about 20 mL of the deionized water and 2.00 mL of 3.00% H2O2 solution was added to each tube. Finally, the volume constant was completed using deionized water. All the colorimetric tubes were placed in a water bath at 50 °C for 10 min, then removed from the bath and cooled with flowing cold water for 3 min. Finally, the fluorescence intensity (F) of the catalyzed solution and the fluorescence intensity (F0) of the non-catalyzed solution were measured at λex = 440.0 nm and λem = 530.0 nm respectively.
Results and Discussion
Excitation Emission Matrix Spectroscopy
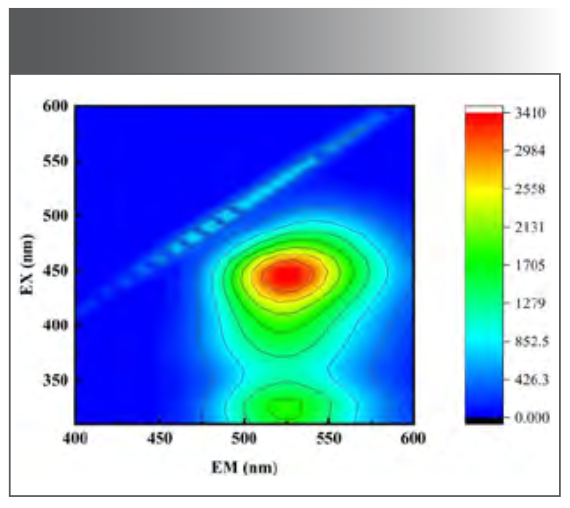
The emission excitation matrix (EEM) spectra of the solution without Ni(II) is shown in Figure 1. The sample has the maximum fluorescence intensity when the excitation wavelength is 440.0 nm and the emission wavelength is 530.0 nm.


FIGURE 1: Emission excitation matrix spectrum.
The Emission Spectrum
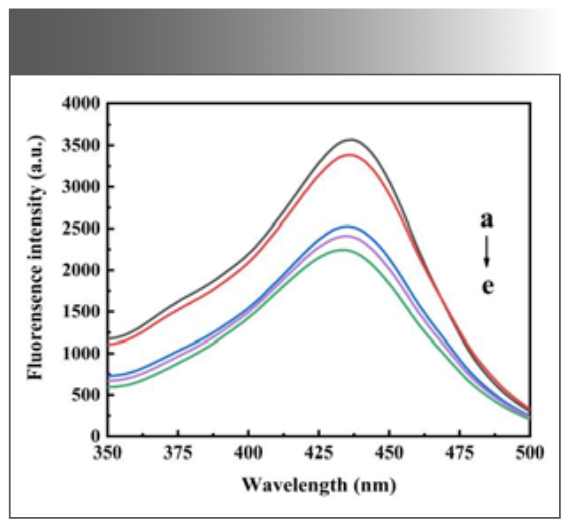
A series of solutions were prepared according to the experimental method, and the emission spectrum was scanned on a fluorescence photometer, as shown in Figure 2. In Na2B4O7-NaOH buffer solution with pH 10.10, when H2O2 was added, it could be seen that morin was oxidized to weaken its fluorescence; then, when Ni(Ⅱ) was added, the fluorescence intensity of the system was weakened again, allowing it to be used for detecting trace Ni(Ⅱ).

 morin solution + Na2B4O7 – NaOH buffer solution at pH 10.10; (b) a + H2O2; (c–e) b + 0.064, 0.080, and 0.096 μg/mL Ni(II) solution.")
FIGURE 2: The emission spectra: (a) morin solution + Na2B4O7 – NaOH buffer solution at pH 10.10; (b) a + H2O2; (c–e) b + 0.064, 0.080, and 0.096 μg/mL Ni(II) solution.
Selection of the Experimental Conditions
Effect of pH and the Dosage of Buffer Solution
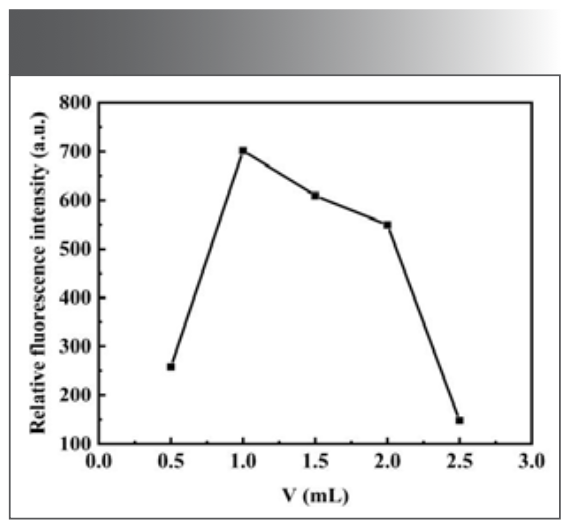
From the previous condition, it can be seen that the oxidation of morin by H2O2 can be catalyzed by Ni(Ⅱ) under alkaline conditions. The effect of Na2B4O7-NaOH buffer solution between pH 9.50 and 10.50 on the fluorescence intensity of morin by H2O2 was investigated. It was found that when the pH of the system was between 9.90 and 10.30, the relative intensity of fluorescence emission ∆F was larger, as shown in Figure 3. Among them, Na2B4O7-NaOH buffer solution at pH 10.10 had the maximum fluorescence intensity, so the subsequent experiments were carried out in this buffer solution. When the pH of buffer solution was controlled, the experiment investigated that the relative intensity (∆F) of fluorescence emission was larger when the dosage of buffer solution was between 1.0 mL and 2.0 mL, as shown in Figure 4. When the dosage of buffer solution was 1.00 mL, the fluorescence intensity of the system was the maximum, so the dosage of buffer solution was selected as 1.00 mL in the subsequent experiments.


FIGURE 3: Effect of buffer solution acidity on fluorescence system.
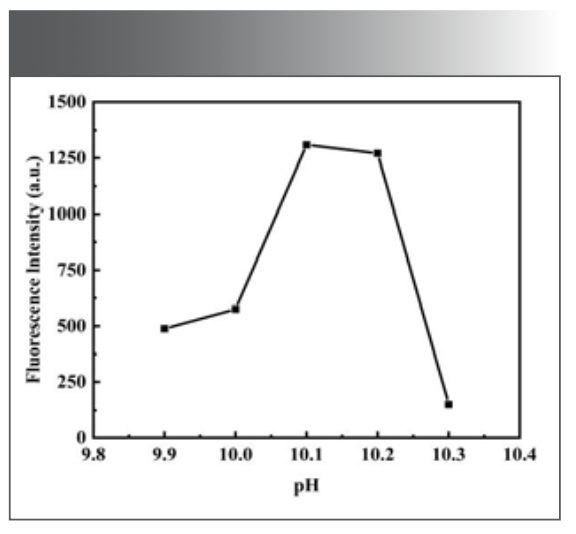


FIGURE 4: Effect of the dosage of buffer solution on the fluorescence intensity of the system.
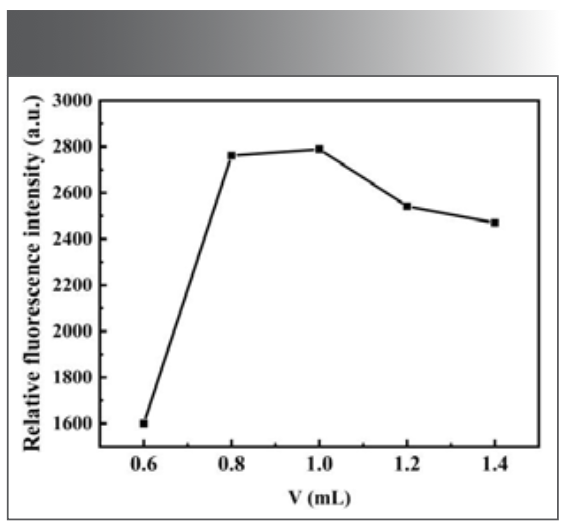
Effect of the Dosage of Morin Solution
There is a self-quenching effect with morin; therefore, if the dosage of morin is too much, the relative ΔF of the system will become smaller. On the contrary, its catalytic effect on the reaction system will be too strong, thereby narrowing the linear range of the system. For the above reasons, the experiment investigated the effect of the morin dosage under the above selected conditions. The results showed that when the dosage of morin was between 0.60 mL and 1.40 mL, the relative intensity of the fluorescence emission was large, as shown in Figure 5. Among them, when the dosage of morin was 1.00 mL, the fluorescence intensity of the system was the maximum, so the dosage of morin was 1.00 mL in the subsequent experiments.


FIGURE 5: Effect of the dosage of morin on the fluorescence intensity of the system.
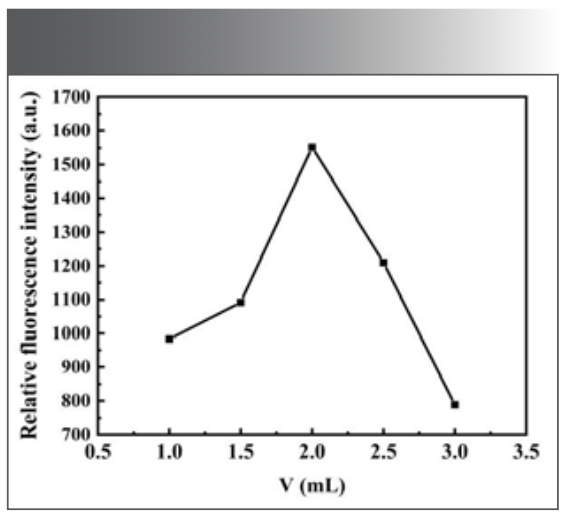
Effect of the Dosage of H2O2 Solution
The dosage of H2O2 will also have an impact on the experiment. Through experimental, it is found that when the dosage of H2O2 is between 0.50 mL and 3.00 mL, the ∆F is relatively large, as shown in Figure 6. When the dosage of H2O2 was 2.00 mL, the fluorescence intensity of the system was the maximum, so the dosage of H2O2 was selected as 2.00 mL in subsequent experiments.


FIGURE 6: Effect of H2O2 dosage on the fluorescence intensity of the system.
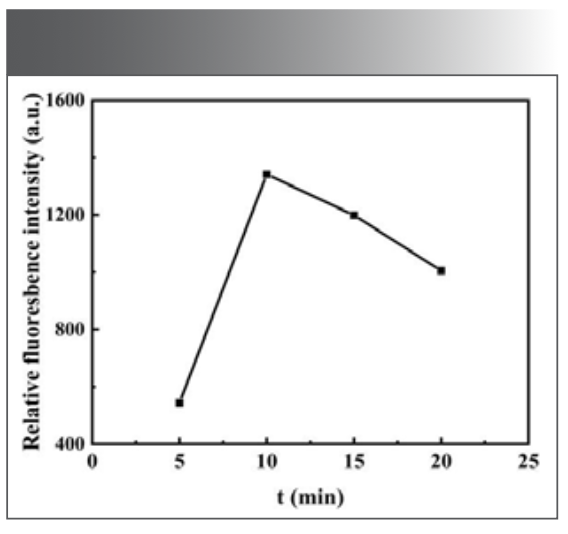
Effect of Reaction Time
The fluorescence intensity of the system was measured at different reaction times (5–20 min). The results showed that the relative ∆F of the system reached the maximum when the reaction time was 10 min, as shown in Figure 7. Therefore, 10 min was selected as the reaction condition in the subsequent experiments.


FIGURE 7: Effect of reaction time on the fluorescence intensity of the system.
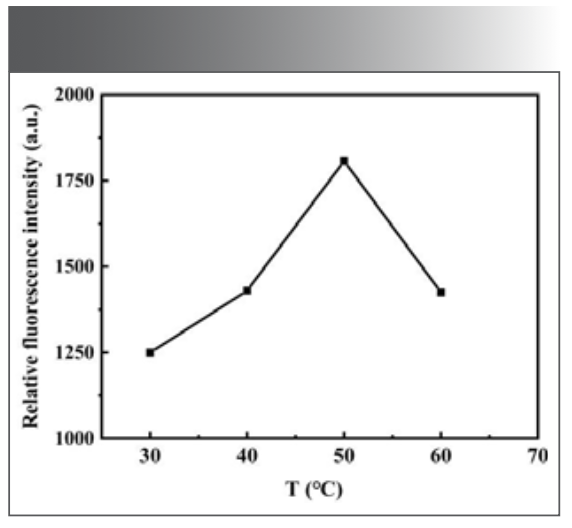
Effect of Reaction Temperature
The reaction temperature has a great influence on the experimental results. The fluorescence intensity of the reaction system at different temperatures was investigated. The experimental results show that the relative ∆F emission reaches the maximum when the temperature is 50 ℃, as shown in Figure 8. Therefore, 50 ℃ was chosen as the reaction condition in the subsequent experiments.


FIGURE 8: Effect of reaction temperature on the fluorescence intensity of the system.
Through the above experiments, the optimal reaction conditions were determined. The temperature is 50 ℃; Morin 1.0 mL; H2O2 2.0 mL; Na2B4O7-NaOH buffer solution with pH = 10.10 was 1.0 mL. The reaction time was 10 min.
Standard Curve and Detection Limit
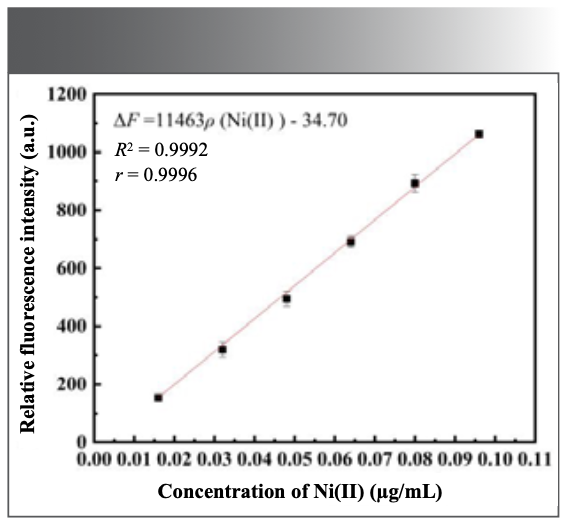
Under the optimal experimental conditions selected in the above experiment, the fluorescence intensity of different amounts of Ni(II) standard solutions were measured according to the experimental method. Figure 9 is the fluorescence image of the system. It can be seen from the figure that as the increase of the amount of Ni(II) standard solution added, the fluorescence intensity of the system gradually decreases, which shows a good regularity. When the concentration of Ni(II) is in the range of 1.6 × 10⁻²–9.6 × 10⁻² μg/mL, the ∆F of the system has a good linearity to Ni(II). The linear equation is ΔF = 11463ρ (μg/mL) – 34.70, and the R2 = 0.9992, as shown in Figure 10. At the same time, the fluorescence intensity of 11 blank samples was measured in parallel, the standard deviation (δ) was calculated, and 3δ was divided by the slope obtained from the standard working curve, and the detection limit of the assay method was 2.9 × 10⁻⁴ μg/mL.


FIGURE 10: Standard working curve.
Ion Interference Experiment
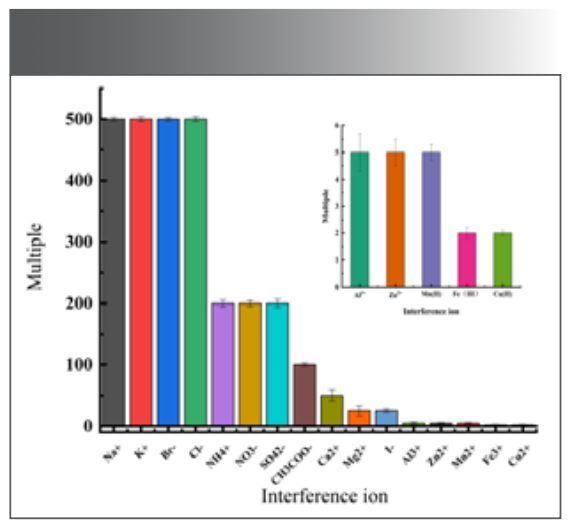
Under optimal experimental conditions, 2.0 μg/mL Ni(II) solution was measured, and different dosage of interfering ions were added to the reaction system. The relative error of the fluorescence measurement value was controlled within plus or minus 5.00%, as shown in Figure 11. Common coexisting ions are: 500 times of Na+, K+, Br-, Cl-, 200 times of NH4+, NO3-, SO42-, 100 times of CH3COO-, 50 times of Ca2+, 25 times of I-, Mg2+. In this experiment, the common ions Zn2+, Al3+, Fe3+, Mn2+ interfere greatly, and the masking agents NaF and Na2S2O3 can be added.


FIGURE 11: Ion interference experiment.
Discussion of Quenching Mechanism
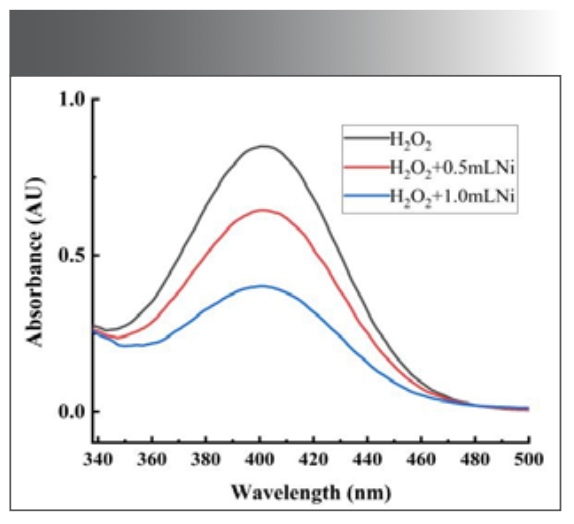
As shown in Figure 12, when a certain amount of H2O2 was added to Na2B4O7-NaOH buffer solution at pH 10.10, morin had an absorption peak at 403 nm. When the catalyst Ni(Ⅱ) was added, the absorbance decreased, and the position and shape of the maximum absorption peak did not change. The absorption curve of the system indicated that Ni(Ⅱ) did not coordinate with morin to form new substances during the reaction, but catalyzed the process of H2O2 oxidation of morin. The fluorescence spectrum and absorption spectrum of the reaction system with different concentrations of Ni(II) were analyzed, and it was found that the peak shape and peak position did not change. Only the intensity of the peak changes, and the degree of fluorescence quenching increases with the increase of the Ni(II) dosage. It was concluded that the quenching of morin fluorescence in the reaction system was dynamic quenching.

 morin + Na2B4O7 – NaOH + H2O2; (b,c) a + 0.048, and 0.096 μg/mL Ni(II).")
FIGURE 12: Absorption spectra of morin system: (a) morin + Na2B4O7 – NaOH + H2O2; (b,c) a + 0.048, and 0.096 μg/mL Ni(II).
Sample Analysis
Tap Water
50 mL tap water was diluted to 300 mL with distilled water, 0.5 mL of 20.0 g/L NaF solution and 0.5 mL of 100.0 g/L Na2S2O3 solution were added. The Ni(Ⅱ) content of 1 mL of this water sample was determined according to the experimental method.
Yellow River Water
50 mL filtered Yellow River water was diluted to 300 mL with second distilled water, and 0.5 mL 20.0 g/L NaF solution and 0.5 mL 100.0 g/L Na2S2O3 solution were added. The Ni(Ⅱ) content of 1 mL of this water sample was determined according to the experimental method.
Tea Water (20,21)
1.0003 g tea leaves were weighed and soaked in 100 mL of 2 mol/L HCl in water at 70 ℃ for 60 min. After the tea water is cooled and filtered, 50 mL tea water is measured and diluted to 300 mL with distilled water, and 20.0 g/L NaF solution and 0.5 ml 100.0 g/L Na2S2O3 solution are added. The Ni(Ⅱ) content of 1 mL of this water sample was determined according to the experimental method.
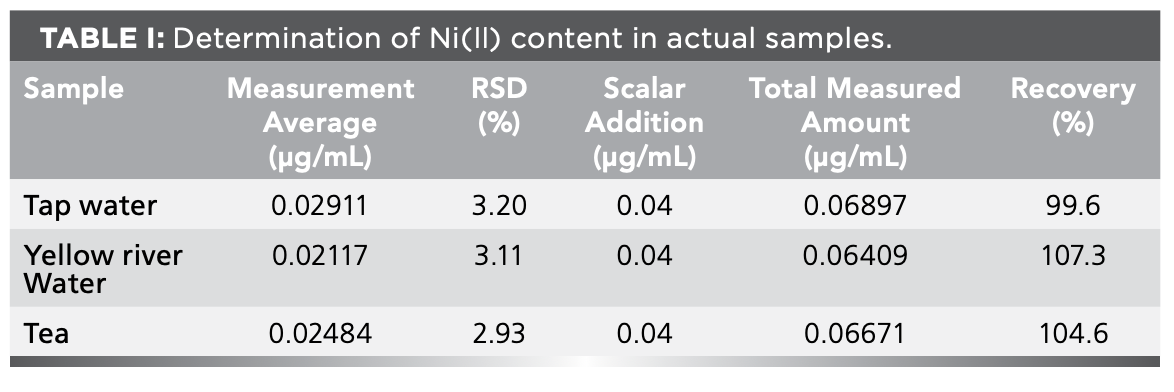
The above-mentioned samples were simultaneously measured for standard addition recovery, and the results were shown in Table Ⅰ.


Reaction Mechanism
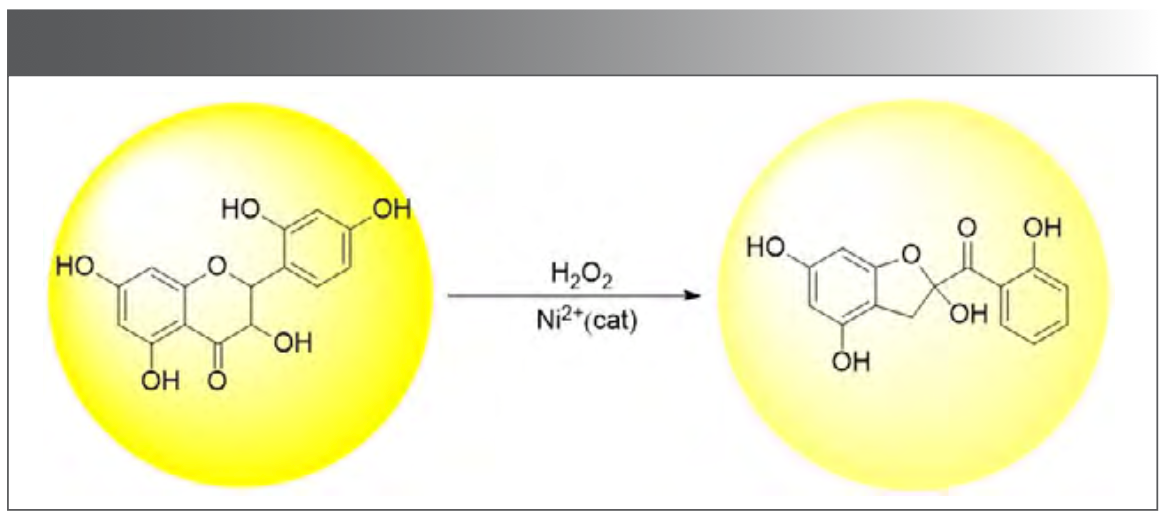
Morin belongs to flavonoids, and because the oxygen-containing heterocyclic ring in its structure and the aromatic ring on the left of its connection becomes a large conjugate system, it absorbs light and fluoresces. As an oxidant, hydrogen peroxide reacted with morin to destroy the conjugated structure and weaken its fluorescence, as shown in Figure 13. As a transition metal, Ni belongs to the d-block element, which provides empty orbitals and generates feedback bonds (frontier orbital theory). As a result, the activation energy of the reaction is reduced and the process of morin oxidation by hydrogen peroxide is accelerated. Moreover, the reaction rate is related to the concentration of catalyst, which was also verified in this experiment. With the increase of Ni(II) concentration, the fluorescence quenching speed is also accelerated.


FIGURE 13: Morin reacts with hydrogen peroxide.
Conclusion
In this paper, a kinetic fluorescence method for the determination of Ni(II) was established. The fluorescence intensity of the reaction system decreased linearly with the increase of the amount of Ni(II) added to the reaction system, so the content of Ni(II) in the sample could be detected. Under the best experimental conditions, when the concentration of Ni(Ⅱ) is in the range of 1.6 × 10⁻² – 9.6 × 10⁻² μg/mL, the ∆F of the system is linearly related to the concentration of Ni(Ⅱ). The linear regression equation was ΔF = 11463ρ (μg/mL) – 34.70, the R2 = 0.9992, and the method detection limit was 2.95 × 10⁻⁴ μg/mL. Then, tap water, Yellow River water and tea water were analyzed, and the recovery rates of standard addition were 99.6%, 107.3% and 104.6%, respectively. The results were satisfactory.
Declaration of Interests
The authors have no competing interests to declare that are relevant to the content of this article.
Compliance with Ethical Standards
All authors certify that they have no affiliations with or involvement in any organization or entity with any financial interest or non-financial interest in the subject matter or materials discussed in this manuscript.
Acknowledgments
The authors thank to the Instrument Analysis Center of Lanzhou Jiaotong University. In addition, they acknowledge the financial support from the National Natural Science Foundation of China (No. 62075007).
References
(1) Cameron, K. S.; Buchner, V.; Tchounwou, P. B. Exploring the Molecular Mechanisms of Nickel-Induced Genotoxicity and Carcinogenicity. Rev. Environ. Health. 2011, 26 (2), 81–92. DOI: 10.1515/reveh.2011.012
(2) Cetin, I.; Nalbantcilar, M. T.; Tosun, K.; Nazik, A. How Trace Element Levels of Public Drinking Water Affect Body Composition in Turkey. Biol. Trace Elem. Res. 2017. DOI: 10.1007/s12011-016-0779-z
(3) Wu, P.; Chen, H.; Cheng, G.; Hou, X. Exploring Surface Chemistry of Nano-TiO2 for Automated Speciation Analysis of Cr(III) and Cr(VI) in Drinking Water Using Flow Injection and ET-AAS Detection. J. Anal. At. Spectrom. 2009, 24 (8), 1098–1104. DOI: 10.1039/B904271G
(4) Satti, A. A.; Temuge, I. D.; Bektas, S.; Sahin, C. A. An Application of Coacervate-Based Extraction for the Separation and Preconcentration of Cadmium, Lead, and Nickel Ions Prior to Their Determination by Flame Atomic Absorption Spectrometry in Various Water Samples. Turk. J. Chem. 2016, 40 (6), 979–987. DOI: 10.3906/kim-1605-80
(5) Liu, Y.; Sun, G. Determination of Nickel and Lead in Hogwash Oil by Graphite Furnace Atomic Absorption Spectrometry with Graphite Digestion. Chem. Anal. Meterage. 2015, 6 (3), 902–905.
(6) Tariq, Z.; Adnan, S. Statistical Evaluation of Spectrophotometric Determination of Nickel(II) Using Micelle-Mediated Extraction. J. Phys. Conf. Ser, 2019, 1294, 052064.
(7) Zhou, F.; Wang, S.; Zhu, H.; Li, C. Simultaneous Determination of Polymetallic Ions by Ratio Second Derivative Ultraviolet Spectrophotometry. Optik 2021, 242, 167315. DOI: 10.1016/j.ijleo.2021.167315
(8) Ojeda, C. B.; Rojas, F. S.; Pavon, J. A Greener and Sensitive Procedure for Nickel Determination by Cloud Point Extraction and UV/Vis Spectrophotometry. Res. J. Pharm., Biol. Chem. Sci., 2010, 1 (4), 514–523.
(9) Kocot, K.; Sitko, R.; Trace and Ultratrace Determination of Heavy Metal Ions by Energy-Dispersive X-ray Fluorescence Spectrometry Using Graphene as Solid Sorbent in Dispersive Micro Solid-Phase Extraction. Spectrochim. Acta Part B At Spectrosc. 2014, 94–95, 7–13. DOI: 10.1016/j.sab.2014.02.003
(10) Zheng, H.; Jia, B.; Zhu, Z.; Tang, Z.; Hu, S. Determination of Trace Amounts of Pb, Cd, Ni and Co by Wavelength-Dispersive X-ray Fluorescence Spectrometry After Preconcentration with Dithizone Functionalized Graphene. Anal. Methods 2014, 6 (21), 8569–8576. DOI: 10.1039/C4AY01381F
(11) Pytlakowska, K.; Pilch, M.; Hachula, B.; et al. Energy Dispersive X-ray Fluorescence Spectrometric Determination of Copper, Zinc, Lead and Chromium Species After Preconcentration on Graphene Oxide Chemically Modified with Mercapto-groups. J. Anal. At. Spectrom. 2019, 34 (7), 1416–1425. DOI: 10.1039/C9JA00081J
(12) Huang, C.; Beauchemin, D. Simultaneous Determination of Two Conditional Stability Constants by IC-ICP-MS. J. Anal. At. Spectrom. 2006, 21 (12), 1419–1422. DOI: 10.1039/b608140a
(13) Zhou, Z.; Bing, F.; Tao, W.; Song, X. Alternative Method for the Determination of the Antioxidant Content in Transformer Oil by Electrochemical Techniques. IEEE Trans. Dielectr. Electr. Insul. 2012, 19 (5), 1498–1501. DOI: 10.1109/TDEI.2012.6311492
(14) Kokkinos, C.; Economou, A.; Raptis, I.; Speliotis, T. Novel Disposable Microfabricated Antimony-Film Electrodes for Adsorptive Stripping Analysis of Trace Ni(II). Electrochem. Commun. 2009, 11 (2), 250–253. DOI: 10.1016/j.elecom.2008.11.022
(15) Liu, L.; Mi, Z.; Hu, Q.; et al. Green Synthesis of Fluorescent Carbon Dots as an Effective Fluorescence Probe for Morin Detection. Anal. Methods 2019, 11 (3), 353–358. DOI: 10.1039/C8AY02361A
(16) Luo, W.; Nan, S. Research of Inhibition Mechanism of Morin on Tumor Cells Aminopeptidase. Int. J. Chem. Pharm. Res. 2014, 6 (5), 1510–1516.
(17) Bark, K.; Lm, S.; Seo, J.; Park, O.; Park. H. Spectroscopic Study on the Stability of Morin in Aqueous Solution. Bull. Korean Chem. Soc. 2015, 36 (2), 498–502. DOI: 10.1002/bkcs.10093
(18) Im, K. H.; Baek, S. A.; Choi, J.; Lee, T. S. Antioxidant, Anti-Melanogenic and Anti-Wrinkle Effects of Phellinus vaninii. Mycobiology 2019, 47 (5), 1–12. DOI: 10.1080/12298093.2019.1673595
(19) Nekouei, F; Nekouei, S. Spectrophotometric Determination of Low Levels Nickel(II) in Various River Water Samples by Simultaneous Mixed-Micelle Mediated Extraction and Ternary Ion Association System as a Prior Step. J. Indian Chem. Soc. 2015, 92 (8), 1207–1212.
(20) Ananingsih, V. K.; Sharma, A.; Zhou, W. Green Tea Catechins During Food Processing and Storage: A Review on Stability and Detection. Food Res. Int. 2013, 50 (2), 469–479. DOI: 10.1016/j.foodres.2011.03.004
(21) Liu, S. H.; Zang, X. H.; Chang, Q. Y.; et al. ZIF-8 Derived Nitrogen-Containing Porous Carbon as Adsorbent for Solid-Phase Extraction of Six Metal Ions from Tea Samples. Chinese J. Anal. Chem. 2018, 46 (8), 1282–1288. DOI: 10.11895/j.issn.0253-3820.171193
Zhang Xin, Sheng Li, Han Feng, and Su Bi-quan are with the School of Chemistry and Chemical Engineering at Lanzhou Jiaotong University, in Lanzhou, China. Li Hai-su is with the Key Institute of Lightwave Technology at Beijing Jiaotong University, in Beijing, China. Direct correspondence to Sheng Li at 3193446636@qq.com ●


Tracking Molecular Transport in Chromatographic Particles with Single-Molecule Fluorescence Imaging
May 18th 2012An interview with Justin Cooper, winner of a 2011 FACSS Innovation Award. Part of a new podcast series presented in collaboration with the Federation of Analytical Chemistry and Spectroscopy Societies (FACSS), in connection with SciX 2012 ? the Great Scientific Exchange, the North American conference (39th Annual) of FACSS.


