Evaluation of Shifted-Excitation Raman Difference Spectroscopy and Comparison to Ordinary Portable Raman Spectroscopy in Identification of Seized Drugs
Rapid and accurate identification and detection of illicit drugs are important for combating drug crimes. As a newly developed technology, shifted-excitation Raman difference spectroscopy (SERDS) can greatly reduce the interference caused by fluorescence and improve the potential of Raman for distinguishing drug compounds in seized samples with fluorescent additives. In this work, 43 random seized drugs were scanned and analyzed by both SERDS and ordinary portable Raman spectrometers for the first time. The detected results of two Raman technologies were confirmed with gas chromatographic mass spectrometry test results, and compared in detail in the aspects of detection rate and matching accuracy. SERDS had significant advantages in eliminating fluorescence interference with a very high detection rate of 93.0%, compared with 53.3% obtained by an ordinary Raman spectrometer, although the ordinary Raman spectrometer analyzed the composition of multi-component mixed samples with higher accuracy. To some extent, the two Raman spectrometers realized functional complementarity, and a rational use of the two types of Raman spectrometers may be of benefit in the rapid detection of seized drugs.
Drugs as illicit substances, including methamphetamine, ketamine, methylene dioxymethamphetamine (MDMA), diamorphine and so on, can cause euphoria, hallucination, and addiction (1). Of drugs seized by authorities, the most common in Chinese markets is called “Magu” (a mixture of methamphetamine and caffeine), while other drugs, such as ketamine and diamorphine, are relatively uncommon. Abuse of illegal drugs not only has a seriously negative impact on the body’s physical and mental health, but also contributes to increasing levels of disruption, violence, and crime. Thus, it has been considered one of the great challenges in the criminal justice system to reduce drug misuse and drug harms (2). In the process of combating drug crimes, how to realize the rapid detection and identification of drug components in seized samples is seen as a crucial link.
At present, commonly used drug detection technologies include high performance liquid chromatography coupled to mass spectrometry (HPLC–MS) (3), gas chromatographic–mass spectrometry (GC–MS) (4–6), fiber spray ionization mass spectrometry (7), and Raman spectroscopy (8,9). Among these methods, HPLC–MS and GC–MS are the most widely used and well established because of the advantages of standard operation methods, and accurate qualitative and quantitative results. However, both of these methods are timeconsuming, expensive, and labor-intensive, needing a long and complex sample preparation process before sample testing, and can only be operated in laboratories due to their large-size and sophisticated equipment (10,11). These methods do not meet the needs of rapid analysis and judgment of seized samples at the crime scene.
Raman spectroscopy has been extensively used in analytical methods (8–12). Fortunately, in contrast to HPLC–MS or GC–MS, miniature and portable Raman spectrometers have recently been developed in addition to conventional largescale Raman instruments. To some extent, the appearance of portable Raman spectroscopy has filled the gap left by HPLC–MS and GC–MS techniques and their inability to analyze field samples. Portable Raman instruments have the advantages of short detection time, simplicity of operation, accurate qualitative results, and on site availability. However, traditional Raman has had certain limitations, for example, weak Raman signal and low anti-fluorescent interference ability (13). To address the shortcomings of Raman, many strategies were proposed by researchers, such as the surface-enhanced Raman scattering (SERS) technique. The SERS technique could increase the intensity of the Raman signal of target molecules by using SERS materials, such as nanoscale roughness metals, thus greatly reducing the detection limits of target compounds. SERS exhibits high sensitivity, and good reproducibility, and has demonstrated significant impact on life sciences, environmental monitoring, and homeland security (11–16). For instance, Rana et al. obtained the normal Raman and SERS spectra of morphine, codeine, and hydrocodone, respectively, and found that surface enhancement by Ag nanoparticles not only enhanced the Raman signals, but also suppressed the fluorescence, enabling far more sensitive detection and identification (17). Haddad et al. proposed a paper-based substrate impregnated with Ag nanoparticles for the detection and quantitation of trace fentanyl alone and as an adulterant in heroin by SERS (18). Wang et al. adopted three methods, SERS based on gold or silver nanospheres and nanostars, conventional Raman, and density functional theory analysis, respectively, to detect fentanyl and six analogs. The results indicated that SERS technology showed great potential in distinguishing fentanyl analogs (19). Fedick et al. also published a method to apply a commercial paper SERS substrate to the identification and confirmation of fentanyl using portable SERS and paper spray ionization mass spectrometry (8). Bell et al. screened low concentrations of 2,5-Dimethoxy-4-bromoamphetamine in seized tablets using silver colloids as the SERS reagent (20). Halouzka et al. reported a strategy to detect designer drugs by SERS with copper nanowire-coated carbon fibers as efficient substrates (21). Although SERS had gained some progress in drug testing and has shown advantages, such as achieving trace detection, improving the detection sensitivity, and eliminating fluorescence interference to a certain extent, essential SERS substrates are expensive. In particular, most SERS substrates are suited only to specific target compounds, and the operators need to select the appropriate reagent according to the actual situation. The lack of universal substrates has affected not only the experiment cost, but also the operative difficulty.
Usually, drugs circulating in the Chinese market were processed and disguised as colorful tablets, candies, and such, with a lot of fluorescently-colored additives, which inevitably created a potential hindrance for the determination of drugs using Raman. Shifted-excitation Raman difference spectroscopy (SERDS) is an emerging Raman detection technology developed in recent years (22–27). This technology mainly depends on the principle that when samples are excited by two lasers with similar wavelengths, the fluorescence spectra of samples does not shift with the slight change of the wavelengths, although the position of Raman peaks would obviously change. Based on this, fluorescence interference could be effectively removed by subtracting the two original signals to obtain the differential Raman spectra, and the spectrum intensity also could be improved at the same time (22–24). To the best of our knowledge, SERDS technology has been successfully applied to the analysis and identification of food additives (22,23), artwork (25), rocks (26), biological components (27), chrysophorons (24), and so on, but rarely in the testing of drugs.
In this work, SERDS and ordinary portable Raman spectrometers were both applied to the rapid analysis and identification of drugs for the first time by choosing 43 kinds of random seized drugs as samples. The detected results of the two Raman technologies were confirmed with GC–MS test results and compared in detail in the aspects of detection rate and matching accuracy.
Materials and Methods
Reagents and Materials
The samples described in this study were all non-judicial samples seized by the Jiangsu Provincial Public Security Department in China. These samples were immediately placed in polythene evidence bags and stored securely after seizure. After going through judicial proceedings, the samples were set aside for this study. Methanol, for the extraction of the seized drugs, was HPLC grade (≥99.8% purity) and supplied by Merck.
Rapid Component Analysis of Seized Drugs through Raman Spectrometer
The 43 seized drug samples were directly analyzed without any pretreatment by two kinds of Raman spectrometers, a Thermo Fisher portable Raman spectrometer (First Defender RMX, Thermo Fisher Equipment Co., Ltd., USA) and SERDS (SERDS Portable-BASE, Jianzhi Instrument Equipment Co., Ltd., Nanjing, China), to obtain ordinary Raman and SERDS spectra, respectively. The two collected kinds of Raman spectra were matched with the database provided by each instrument to obtain the rapid component analysis results of samples.
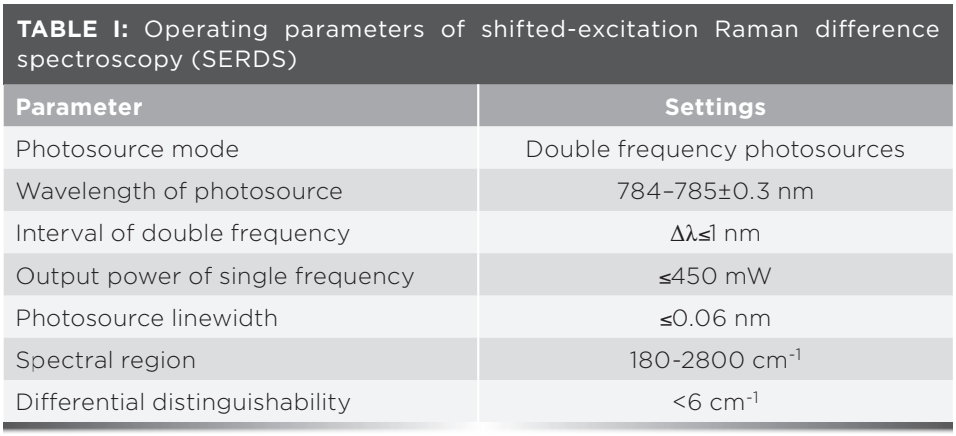
For collecting ordinary Raman spectra, an excitation source of 785 nm with the laser power set to 5 mW was used. Detailed instrument parameters of SERDS are listed in Table I. The differences in instrument parameters between the ordinary Raman equipment and SERDS primarily concern the unique detection principle of SERDS, its use of dual-frequency light sources as a core technology. As previously stated, SERDS mainly depends on the principle that when samples are excited by two lasers with similar wavelengths (784–785 ± 0.3 nm in this work), the fluorescence spectra of samples does not shift with the slight change of the wavelengths, but the position of Raman peaks does change. Therefore, the SERDS spectrum could be extracted from the original noise by filtering the difference feature after subtracting the strong background signal from the double frequency photosources.


Sample Preparation for GC–MS Analysis
In order to verify the accuracy of Raman analysis results, the seized samples were also detected by GC–MS. Before the measurement of GC–MS, the samples were pretreated, and the pretreatment method was as follows: Each sample weighing approximately 10 mg was dissolved in 1.0 mL methanol followed by sufficient vortexing and ultrasonicating at room temperature. Subsequently, the mixture was centrifuged at 18,000 rpm for 5 min to obtain the supernatant for the following GC–MS analysis.
GC–MS Analysis
The experiments were performed on an Agilent 7890B gas chromatograph system coupled with a mass selective detector model 5977A (Agilent Technologies), using helium as the carrier gas with a constant flow rate of 1.0 mL/min. A DB-5MS elastic silica capillary column (30 m × 0.25 mm × 0.25 µm, J&W Scientific) was chosen for chromatographic separation with other chromatographic conditions as follows: The injection temperature was 280 °C; 1 µL sample solution was injected for analysis under splitting mode with a split ratio of 20:1; and the oven temperature started at 100 °C, keeping for 1.00 min, increased from 100 to 290 °C under a heating rate of 8 °C/min, and then was held at 290 °C for 10.00 min. The total run time was 34.75 min. The MS analyses were performed in full-scan mode with masses in the 40-500 Da range and delay time of 3.00 min. The temperature of ion source and single quadrupole analyzer were 230 and 150 °C, respectively.
Results and Discussion
Differences Between Ordinary Raman and SERDS in Seized Drug Testing
Due to differences in the ways of signal acquisition and data processing, the Raman spectra obtained by SERDS and ordinary Raman were different, as the Raman spectra of an example drug sample (Sample No. 2) shows in Figure 1. It can be seen clearly from Figure 1 that for the ordinary Raman, the signal response of the sample was not significant. Even after multiple smoothing treatments, the ordinary Raman spectrum still had a low signal-to-noise ratio (S/N), which might be affected by the addition of fluorescent components in seized drugs. The continuous fluorescence spectrum can mask a part of the scattered Raman characteristic peaks (25), which caused only two small peaks belonging to the stretching vibrations of xanthine group (~550 cm-1) and C=O bonds (~1700 cm-1) in caffeine, respectively, which can be observed clearly. The peaks belonging to methamphetamine, meanwhile, were barely visible. What’s more, considering that most samples had low transmittance and could easily be damaged by highintensity lasers, only low excitation energy would be applied in the determination. As a result, the useful information of samples obtained by conventional portable Raman was very limited, as was the number of measured characteristic peaks.

 Ordinary and (b) SERDS: Raman spectra of drug sample (Sample No. 2), and ordinary Raman spectra: (c) of pure caffeine, and (d) methamphetamine.")
Figure 1: (a) Ordinary and (b) SERDS: Raman spectra of drug sample (Sample No. 2), and ordinary Raman spectra: (c) of pure caffeine, and (d) methamphetamine.
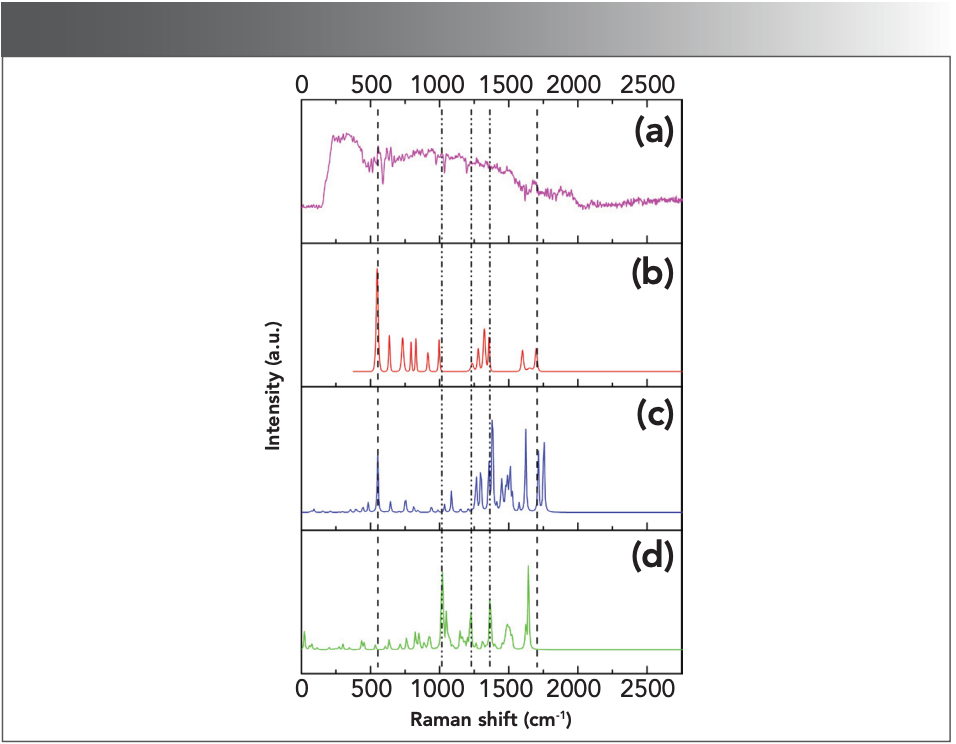
Conversely, as stated above, the SERDS spectrum could be extracted from the original noise by filtering the difference feature, after subtracting the strong background signal from the double frequency photosources. Under this SERDS mode, the Raman characteristics of samples could be accurately obtained from the original signal, even with high fluorescence and low signal-to-noise ratio. Not only that, the power of photosources could be greatly reduced on the premise of ensuring the accuracy of Raman peak measurements, to avoid the sample burning. Therefore, as shown in Figure 1, although some characteristic peaks were slightly shifted due to the mutual interference of Raman spectra of different components in the drug sample, many characteristic peaks of methamphetamine were also very obvious, such as the peaks attributed to the flexural vibrations of benzene group and the stretching vibrations of benzene-C and C-C bonds at ~1000, 1225 and 1360 cm-1, respectively, in addition to the two peaks at ~550 and 1700 cm-1 belonging to caffeine. Sufficient characteristic peaks were very important for the identification of components in complex samples, especially for methamphetamine in drug samples. We regret that the specific data processing and calculation methods involved in SERDS are commercial secrets, and have been applied for patent protection by the relevant instrument manufacturers. Therefore, the processing algorithm of Raman signal data cannot be described in more detail at this time.
Statistical Comparison and Analysis of Ordinary Portable Raman and SERDS Detection Results in Seized Drug Testing
Successful Detection Rate
It was a prerequisite for the practical application of the Raman spectrometers to pass through the scanning process successfully and obtain matching results. Therefore, we firstly investigated and compared the detection rates of two kinds of Raman. Herein, the successful detection was calculated based on whether the sample had matching reports for each Raman spectrometer or not.
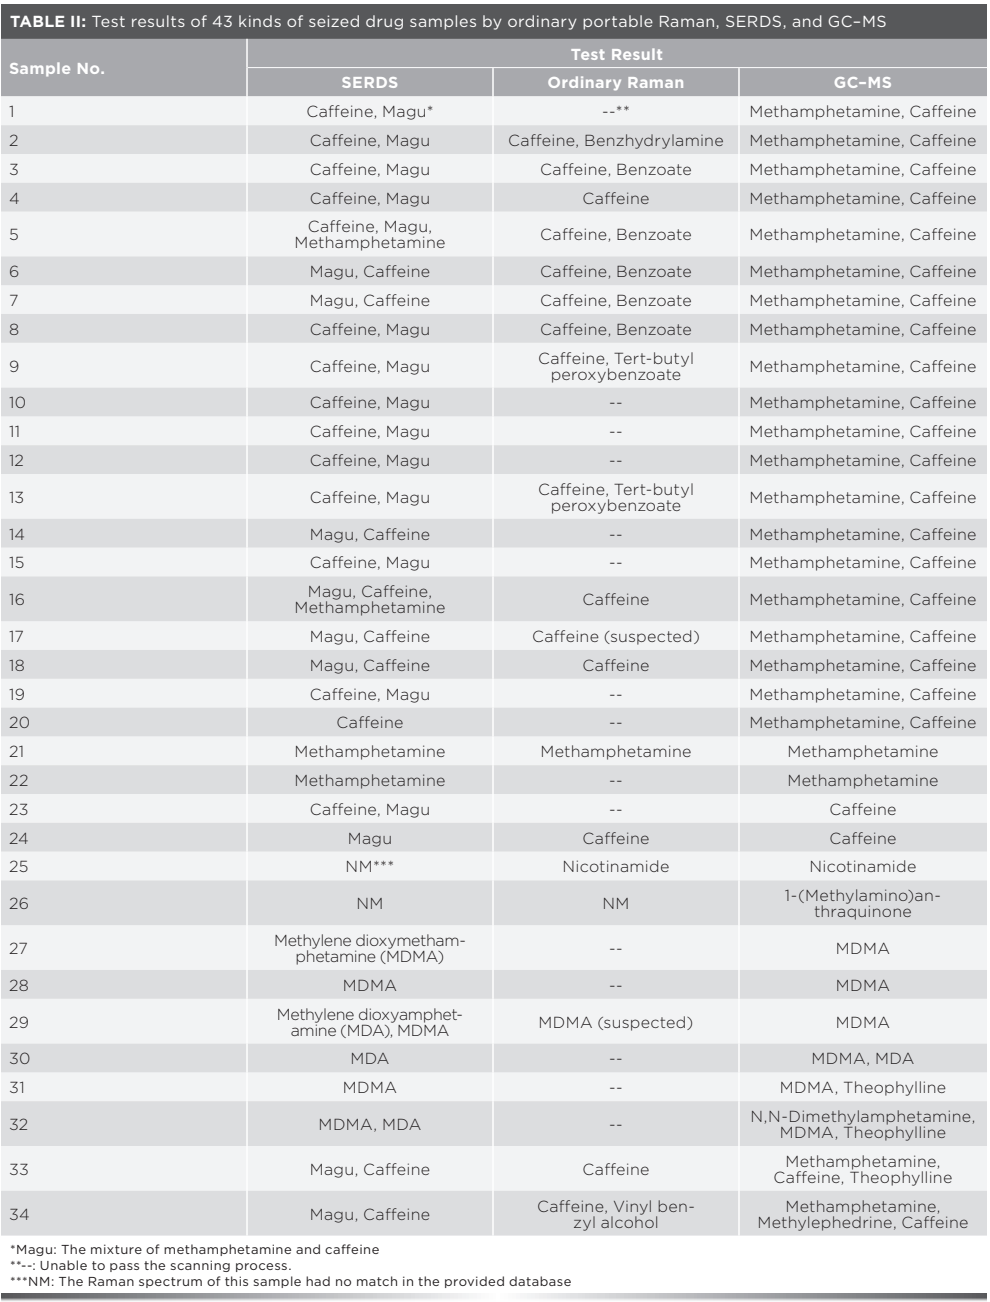
The test results of 43 kinds of seized drug samples by ordinary portable Raman, SERDS, and GC–MS, respectively, are listed in Table II, in which “--” means that the sample was unable to pass the scanning process, and “NM” means that the Raman spectrum of this sample had no match in the provided database. Due to fluorescence interference, the seized drug samples proved difficult to be successfully scanned by the ordinary portable Raman spectrometer after statistical analysis. Unfortunately, among the 43 total kinds of seized drugs, 20 samples were unable to complete the entire scanning process and one sample had no match, for a successful detection rate of 53.5%. Even for the detected 23 samples, the scanning processes took several minutes. In contrast, for SERDS, all the samples passed through the scanning process and 40 seized drug samples obtained matching results, which meant that the successful detection rate of SERDS for the 43 samples was 93.0%, much higher than that of ordinary Raman. Not only that, the scanning time for most samples was only a few seconds, and very few samples took even as long as one minute. The higher successful detection rate, less scanning time, and lack of additionally required SERS reagents made SERDS more advantageous than ordinary Raman in quick inspection and preliminary screening for high-fluorescence samples.


Accuracy of Matching Results
In addition to the detection rate, accuracy of matching results is also a very important index for evaluating the practicability of detection methods, especially when it comes to drug testing, which may concern the safety of the state and citizens, as well as the sentencing and punishment of criminals. Therefore, the seized drug samples applied in this experiment were also detected by GC–MS to further confirm the compositions of samples. The results obtained by GC–MS were taken as the evaluation standard of matching accuracy, so as to measure the accuracy of two kinds of Raman in the determination of drugs.
Based on the detailed GC–MS results listed in Table II, most of these random seized drug samples correlated to Magu (the mixture of methamphetamine and caffeine), the most popular drug on the market in China. For simple Magu samples (Nos. 1~20), all the results gained from SERDS contained the matched result “Magu” except one (No. 20); however, ordinary Raman only reported caffeine and some benzoic acid analogs, without methamphetamine. This phenomenon could be explained clearly through the Raman spectra. In the qualitative analysis of Raman, it was judged by matching the characteristic peaks of a possible component, while some important information and characteristic peaks were covered by the high fluorescence signal. Fortunately, these lost peaks could be recovered by SERDS to some extent. One of the most important characteristic peaks of methamphetamine was at ~1000 cm-1, which was quite distinct in the SERDS spectra. But the peak at ~1000 cm-1 was basically unobservable in the spectra of ordinary Raman, especially when the concentrations of methamphetamine were low, such as for Sample No. 2 in Figure 1, which greatly reduced the accuracy of methamphetamine recognition. Thus, compared with ordinary Raman, SERDS made a great improvement for recognizing Magu.
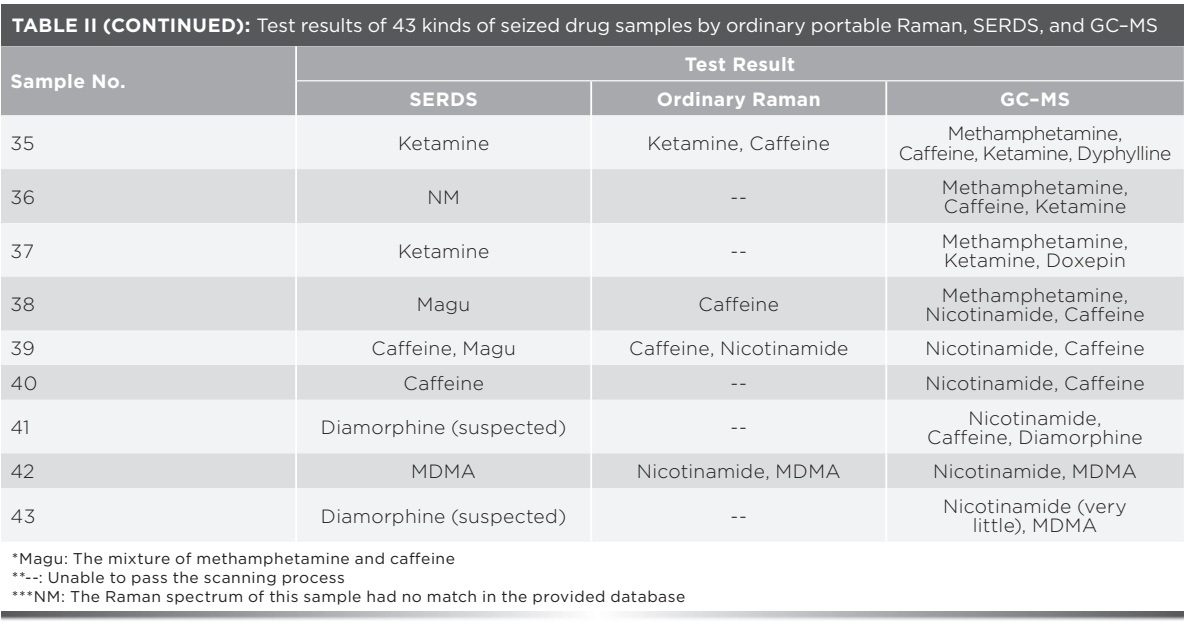
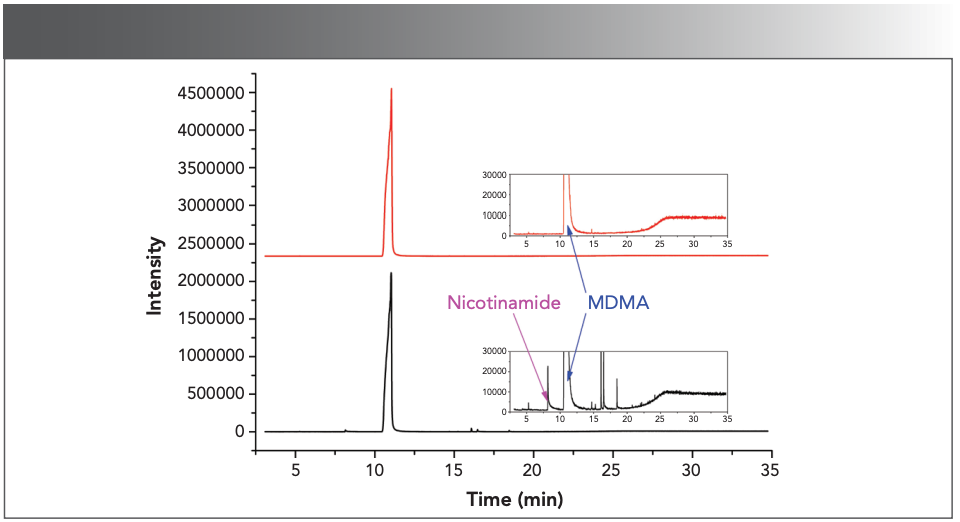
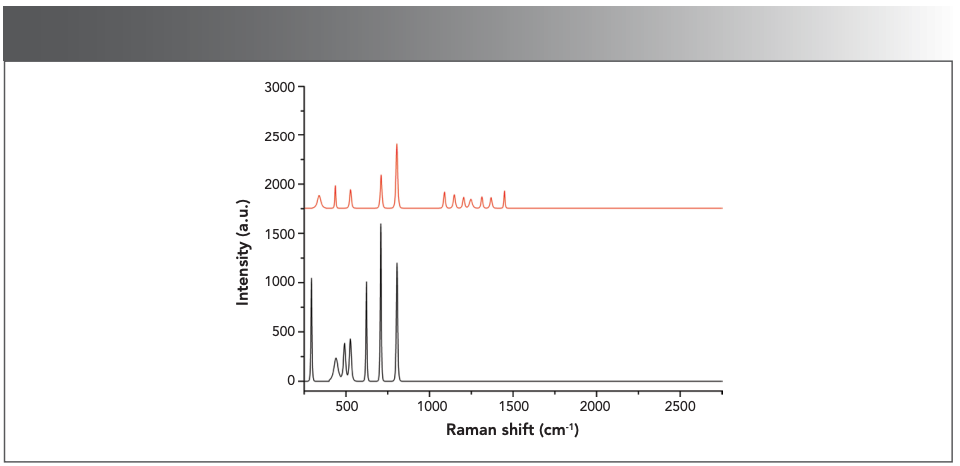
In addition to simple Magu, there were some samples containing a single drug component, like methamphetamine, caffeine, or methylene dioxymethamphetamine (MDMA) (Nos. 21~30), and some other samples adulterated with many kinds of drugs (Nos. 31~43). It was found that for the single drug samples, the results of SERDS were comparatively accurate. Unsatisfactorily, only parts of the principal components were reported for complex multicomponent drug samples in the SERDS results. One sample was a no-match (No. 36) and another was mismatched (No. 43). One reason was that most drug samples were flaky and not evenly mixed in the production process. Another reason might be the complexity of the Raman spectra of mixture samples. As can be observed from the GC–MS image of Sample No. 43 (Figure 2), the proportions of nicotinamide and some other impurities were very small compared with MDMA in the sample. Although such a low concentration of nicotinamide was difficult to qualitatively detect by Raman spectroscopy, it might still affect the Raman spectrum and interfere with the matching result, thus causing certain errors, which could be confirmed from the very different Raman spectrum of Sample No. 43 from Sample No. 27, the one only including MDMA (Figure 3). In addition, it was also noteworthy that nicotinamide had been detected in many seized samples (Nos. 38~43), which indicated that nicotinamide was a common ingredient in popular drugs on the market. However, none of the SERDS results of all samples containing nicotinamide (Nos. 38~43) included “nicotinamide.” The most probable reason for this was that the provided database of SERDS did not contain the standard SERDS spectrum of nicotinamide. Therefore, it was necessary to extend nicotinamide data into the corresponding drug database of SERDS. In general, based on the SERDS results of the 43 seized drug samples, for the drugs with relatively simple components (Magu and single-component samples), the SERDS method had a complete matching accuracy rate of 82.6% with a matching accuracy rate of principal components of up to 93.1%. Even for multi-component complex drug samples, the matching accuracy rate of principal components was 85.7%.

 and No. 43 (black). The retention time of nicotinamide was ~8.15 min, and the retention time of MDMA was ~11.00 min.")
Figure 2: GC–MS images of Sample No. 27 (red) and No. 43 (black). The retention time of nicotinamide was ~8.15 min, and the retention time of MDMA was ~11.00 min.

 and No. 43 (black).")
Figure 3: SERDS Raman spectra of Sample No. 27 (red) and No. 43 (black).
Surprisingly, although some samples did not pass through the scanning process of ordinary portable Raman because of their high fluorescence, the ordinary portable Raman spectrometer from Thermo Fisher showed outstanding performance in complex sample composition identification among the obtained results. For instance, both the composition of caffeine and nicotinamide in Sample No. 39 and nicotinamide and MDMA in Sample No. 42 were identified, respectively, and two main compositions (ketamine and caffeine) were reported for Sample No. 35, which was very helpful for law enforcement officers to make a quick and full assessment of seized drugs. This mainly benefited from the unique multi-component analysis system of Thermo Fisher, which provided excellent performance for the determination of mixture components. Overall, although the ordinary Raman failed to report methamphetamine in Magu, it still had a 95.7% matching accuracy rate of principal components for the 23 successfully detected samples. Especially for multi-component complex samples, half of the samples were successfully matched with two kinds of principal components by ordinary Raman.
On the whole, the listed matching results had high accuracy including main compositions of samples for both kinds of Raman, except for the result of SERDS Raman for Sample No. 43 differing from that of GC–MS to some extent. Comparatively speaking, SERDS Raman had some advantages in analyzing simple-component samples and distinguishing between Magu and pure caffeine, and ordinary portable Raman from Thermo Fisher had outstanding performance in component identification of multicomponent samples.
Conclusions
In this work, 43 kinds of seized unknown drug samples were randomly picked out as representatives and analyzed by ordinary portable Raman, SERDS, and GC–MS, respectively. The practical application effects of two Raman spectrometers in the rapid determination of the components of seized drugs were discussed in detail from the aspects of detection rate and matching accuracy, through the analysis and comparison of three reported results. Notably, the SERDS Raman had significant advantages in eliminating fluorescence interference to improve the detection rate, without expensive SERS reagents. And the ordinary portable Raman spectrometer from Thermo Fisher was better to analyze the composition of multi-component mixed samples in relative terms, which benefited the comprehensiveness and accuracy of reports. In some extent, the two Raman spectrometers realized functional complementarity. Thereby, during the rapid test of samples, especially of seized drugs on site, it is necessary to select an appropriate Raman analyzer according to the actual situation, or take the two Raman results into consideration, thus helping relevant departments to achieve more accurate and effective crackdowns on drug production, trafficking and other crimes.
Conflict of Interest
The authors declare that they have no conflict of interest.
Acknowledgments
This work was supported by the Open Topics of Key Laboratory of Drug Prevention and Control Technology of Zhejiang Province (2019001), the Natural Science Foundation of the Jiangsu Higher Education Institutions of China (22KJB1500023), the National Natural Science Foundation of China (22204063), the Doctoral Program of Entrepreneurship and Innovation of Jiangsu Province (JSSCBS20210600), the Natural Science Major Project of Jiangsu Education Department (18KJA620001), and the Scientific Research Innovation Team of Jiangsu Police Institute (2018SJYTD03).
References
(1) Rocha, L. R.; Mendonça, J. D. C.; Capelari, T. B.; Medeiros, R. A.; Tarley, C. R. T. Development of a reliable and selective voltammetric method for determination of designer drug 1-(3-chlorophenyl)piperazine (mCPP) using boron-doped diamond electrode and exploiting surfactant-mediated measurements. Sens. Actuators, B 2020, 310, 127812. DOI: 10.1016/j.snb.2020.127812
(2) Norman, C.; Walker, G.; McKirdy, B.; et al. Detection and quantitation of synthetic cannabinoid receptor agonists in infused papers from prisons in a constantly evolving illicit market. Drug Test. Anal. 2020, 12, 538–554. DOI: 10.1002/dta.2767
(3) Cüpper, M.; Dalsgaard, P. W.; Linnet, K. Identification of New Psychoactive Substances in Seized Material Using UHPLC–QTOF-MS and an Online Mass Spectral Database. J. Anal. Toxicol. 2020, 44, 1047–1051. DOI: 10.1093/jat/bkaa028
(4) Fiorentin, T. R.; Logan, B. K.; Martin, D. M.; Browne, T.; Rieders, E. F. Assessment of a portable quadrupole-based gas chromatography–mass spectrometry for seized drug analysis. Forensic Sci. Int. 2020, 313, 110342. DOI: 10.1016/j.forsciint.2020.110342
(5) Mesihää, S.; Rasanen, I.; Ojanperä, I. Purity estimation of seized stimulant-type new psychoactive substances without reference standards by nitrogen chemiluminescence detection combined with GC–APCI-QTOF-MS. Forensic Sci. Int. 2020, 312, 110304. DOI: 10.1016/j.forsciint.2020.110304
(6) Slosse, A.; Durme, F. V.; Samyn, N.; Mangelings, D. Heyden, Y. V. Evaluation of data preprocessings for the comparison of GC–MS chemical profiles of seized cannabis samples. Forensic Sci. Int. 2020, 310, 110228. DOI: 10.1016/j.forsciint.2020.110228
(7) Filho, J. F. A.; dos Santos, N. A.; Borges, K. B.; Lacerda, V., Jr.; Pelição, F. S.; Romão, W. Fiber spray ionization mass spectrometry in forensic chemistry: A screening of drugs of abuse and direct determination of cocaine in urine. Rapid Commun. Mass Spectrom. 2020, 34, e8747. DOI: 10.1002/rcm.8747
(8) Fedick, P. W.; Pu, F.; Morato, N. M.; Cooks, R. G. Identification and Confirmation of Fentanyls on Paper using Portable Surface-Enhanced Raman Spectroscopy and Paper Spray Ionization Mass Spectrometry. J. Am. Soc. Mass Spectrom. 2020, 31, 735–741. DOI: 10.1021/jasms.0c00004
(9) de Oliveira Penido, C. A. F.; Pacheco, M. T. T.; Lednev, I. K.; Silveira, L., Jr. Raman spectroscopy in forensic analysis: identification of cocaine and other illegal drugs of abuse. J. Raman Spectrosc. 2016, 47, 28–38. DOI: 10.1002/jrs.4864
(10) Ganbold, E.; Lee, C. M.; Cho, E. M.; et al. Subnanomolar detection of ochratoxin A using aptamer-attached silver nanoparticles and surface-enhanced Raman scattering. Anal. Methods 2014, 6, 3573–3577. DOI: 10.1039/c4ay00440j
(11) Pan, Y.; Guo, X.; Zhu, J.; et al. A new SERS substrate based on silver nanoparticle functionalized polymethacrylate monoliths in a capillary, and its application to the trace determination of pesticides. Microchim. Acta 2015, 182, 1775–1782. DOI: 10.1007/s00604-015-1514-8
(12) Xu, S. C.; Zhang, Y. X.; Luo, Y. Y.; et al. Ag-decorated TiO2 nanograss for 3D SERS-active substrate with visible light self-cleaning and reactivation. Analyst 2013, 138, 4519–4525. DOI: 10.1039/c3an00750b
(13) Wang, S.; Liu, C.; Wang, H.; et al. A Surface-Enhanced Raman Scattering Optrode Prepared by in Situ Photoinduced Reactions and Its Application for Highly Sensitive On-Chip Detection. ACS Appl. Mater. Interfaces 2014, 6, 11706–11713. DOI: 10.1021/am503881h
(14) Pan, Y.; Wang, X.; Zhang, H.; Kang, Y.; Wu, T.; Du, Y. Gold-nanoparticle, functionalized-porous-polymer monolith enclosed in capillary for on-column SERS detection. Anal. Methods 2015, 7, 1349–1357. DOI: 10.1039/c4ay02328e
(15) Li, Q.; Lu, Z.; Tan, X.; et al. Ultrasensitive detection of aflatoxin B1 by SERS aptasensor based on exonuclease-assisted recycling amplification. Biosens. Bioelectron. 2017, 97, 59–64. DOI: 10.1016/j.bios.2017.05.031
(16) Lee, W. W. Y.; Silverson, V. A. D.; Jones, L. E.; et al. Surface-enhanced Raman spectroscopy of novel psychoactive substances using polymer-stabilized Ag nanoparticle aggregates. Chem. Commun. 2016, 52, 493–496. DOI: 10.1039/c5cc06745f
(17) Rana, V.; Cañamares, M. V.; Kubic, T.; Leona, M.; Lombardi, J. R. Surface-enhanced Raman Spectroscopy for Trace Identification of Controlled Substances: Morphine, Codeine, and Hydrocodone. J. Forensic Sci. 2011, 56 (1), 200–207. DOI: 10.1111/j.1556-4029.2010.01562.x
(18) Haddad, A.; Comanescu, M. A.; Green, O.; Kubic, T. A.; Lombardi, J. R. Detection and Quantitation of Trace Fentanyl in Heroin by Surface-Enhanced Raman Spectroscopy. Anal. Chem. 2018, 90, 12678–12685. DOI: 10.1021/acs.analchem.8b02909
(19) Wang, L.; Deriu, C.; Wu, W.; Mebel, A. M.; McCord, B. Surface-enhanced Raman spectroscopy, Raman, and density functional theoretical analyses of fentanyl and six analogs. J. Raman Spectrosc. 2019, 50, 1405–1415. DOI: 10.1002/jrs.5656
(20) Bell, S. E. J.; Fido, L. A.; Sirimuthu, N. M. S.; Speers, S. J.; Peters, K. L.; Cosbey, S. H. Screening Tablets for DOB Using Surface-Enhanced Raman Spectroscopy. J. Forensic. Sci. 2007, 52, 1063–1067. DOI: 10.1111/j.1556-4029.2007.00515.x
(21) Halouzka, V.; Halouzkova, B.; Jirovsky, D.; et al. Copper nanowire coated carbon fibers as efficient substrates for detecting designer drugs using SERS. Talanta 2017, 165, 384–390. DOI: 10.1016/j.talanta.2016.12.084
(22) Zhou, H.; Cai, Z.; Wu, J. Fluorescence Rejection in Raman Testing of Illegal Food Additives. Chin. J. Lasers 2013, 40, 0915001. DOI: 10.3788/CJL201340.0915001
(23) Fang, G.; Yin, L.; Liu, F.; Dong, Z. Application research of fluorescence suppression based on differential Raman technique. Laser Technol. 2019, 43, 359–362. DOI: 10.7510/jgjs.issn.1001-3806.2019.03.013
(24) Tang, Z.; Zhang, M.; Lu, T.; et al. Identification of Amber by Portable Differential Raman Spectroscopy. In Proceedings of the China International Jewelry Academic Exchange Conference, Beijing, November 13, 2019; pp . 426–430. DOI: 10.26914/c.cnkihy.2019.013616
(25) Conti, C.; Botteon, A.; Bertasa, M.; Colombo, C.; Realini, M.; Sali, D. Portable Sequentially Shifted Excitation Raman spectroscopy as an innovative tool for in situ chemical interrogation of painted surfaces. Analyst 2016, 141, 4599–4607. DOI: 10.1039/c6an00753h
(26) Li, J.; Zha, M. Study on Differential Raman Spectroscopy of Fluid Inclusions in Carbonate Reservoirs. Spectrosc. Spectral Anal. (Beijing, China) 2010, 30, 2397–2400. DOI: 10.3964/j.issn.1000-0593(2010)09-2397-04
(27) Cordero, E.; Korinth, F.; Stiebing, C.; Krafft, C.; Schie, I.; Popp, J. Evaluation of Shifted Excitation Raman Difference Spectroscopy and Comparison to Computational Background Correction Methods Applied to Biochemical Raman Spectra. Sensors 2017, 17, 1724. DOI: 10.3390/s17081724
About the Author
Ling-yu Zhao and Guo-ping Wu are with the Department of Criminal Science and Technology of Jiangsu Police Institute, in Nanjing, China, and the Jiangsu Provincial Engineering Laboratory for Technical and Criminal Inspection of Food, Drug, and Environmental Cases, in Nanjing, China. Yuan-zhao Wu is with the Key Laboratory of Drug Prevention and Control Technology of Zhejiang Province at the Department of Criminal Science and Technology of Zhejiang Police College, in Hangzhou, China. Direct correspondence to: wuguoping@jspi.cn or wuyuanzhao@zjjcxy.cn


Nanometer-Scale Studies Using Tip Enhanced Raman Spectroscopy
February 8th 2013Volker Deckert, the winner of the 2013 Charles Mann Award, is advancing the use of tip enhanced Raman spectroscopy (TERS) to push the lateral resolution of vibrational spectroscopy well below the Abbe limit, to achieve single-molecule sensitivity. Because the tip can be moved with sub-nanometer precision, structural information with unmatched spatial resolution can be achieved without the need of specific labels.


