Flexible Stacked Partial Least Squares for Mid-Infrared Spectroscopy Glucose Detection
In this work, we propose a data fusion regression approach for quantitative analysis of glucose using mid-infrared (IR) spectra. First, the approach computes the variable score index. Several submodels are then generated in terms of the index from the calibration set. Finally, the ensembled regression model is created by combining these submodels. In addition, five different regression approaches from the literature are comparatively assessed. Our research shows that one model proposed achieves good performance (with a correlation coefficient of 0.94). our conclusion is that the data fusion model can provide an accurate and robust prediction result for IR glucose measurements.
Experiments generally contain only a small number of samples limited by experimental conditions. However, the spectral signal obtained by the spectrometer often contains thousands of wavenumber data points, which highlights the problem of high-dimensional, small sample analysis (1). (Note in our modeling process, we used a two-dimensional array with wavenumbers on the x-axis and corresponding absorbance values for each sample on the y-axis. However, when constructing the quantitative model for glucose, we only processed the absorbance values. Therefore, for convenience, we often directly refer to the absorbance values of specific wavenumber regions using the corresponding wavenumber range.) Although wavenumber selection methods can reduce the dimension of the spectral signal and improve the prediction ability of the corrected model, spectral signals are still disturbed by spectral noise and multicollinearity. Therefore, it is necessary to further identify the strongly informative wavenumber data by model fusion strategies, thus improving the accuracy and robustness of the resulting regression models (2,3).
Zhang and associates (4) combine partial least squares (PLS) and boosting models based on prediction residuals during iterations, obtaining a more resistant model to overfitting. Xu and associates (5) propose the stacked PLS method based on Monte Carlo cross-validation (MCCV). The spectral signal is divided by a certain number of wavenumber data points, and the PLS model is constructed on the subinterval. The fusion model is obtained by giving the submodel weight by MCCV, which overcomes the disadvantage that only a wavenumber selection model may lose essential information. Different from reference (5), reference (6) proposes to use equal width and disjointed spectral subintervals, with each subinterval using the same latent variables to construct the PLS model.
However, we note that the effective information, redundant information, and invalid information are cross-distributed across the infrared spectral data. This directly divides the original spectral signal into different spectral subintervals so that the invalid information may exist in all spectral subintervals, and this reduces the prediction accuracy of the correction submodel and leads to poor prediction accuracy of the fusion model. Furthermore, the commonly used multivariate correction technology only measures the linear relationship between spectral signal at specific wavenumbers and the glucose concentration. When there is a nonlinear relationship between spectral signal and glucose concentration information, the accuracy and robustness of the correction model constructed by using the linear multivariate correction technology are poor.
This paper presents a solution methodology, which aims to achieve high prediction performance and high robustness for a regression model for prediction of glucose concentration. The regression model proposed computes the score of each wavenumber signal through quadratic programming and the maximum information coefficient (MIC). Quadratic programming identifies the informative, redundant, and uninformative wavenumber data. The spectrum is flexibly divided according to scores of the wavenumber, reducing the multicollinearity of subinter- vals and improving the prediction performance of the regression model. The MIC evaluates the linear and nonlinear relationship between variables at the same time, to further improve the prediction accuracy of the regression model. The performance of the proposed approach is evaluated by comparing five regression model types presented in the literature.
Materials and Methods
Reagents and Sample Preparation
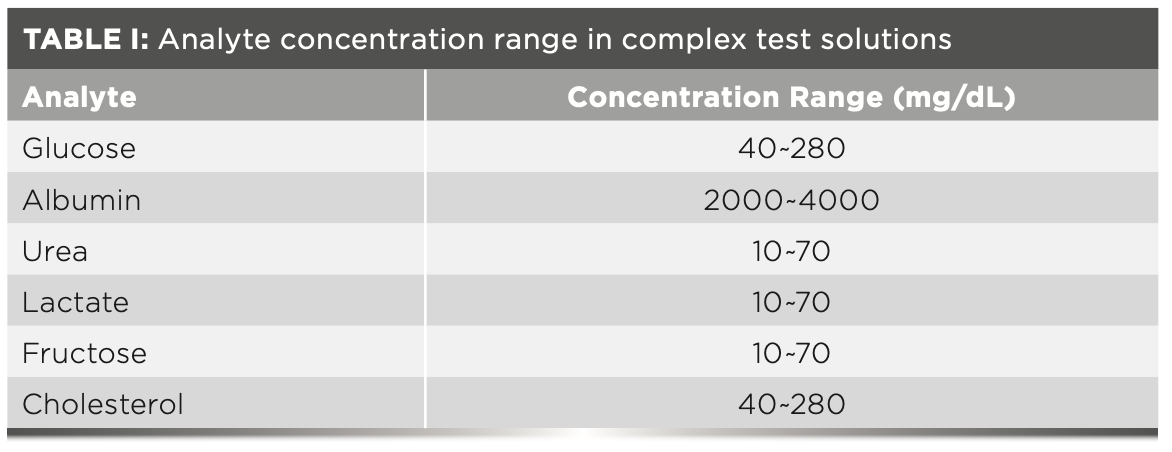
We used 20% fat emulsion injection (C14-24, Fresenius Kabi SSPC) diluted to 10% as the background solution, which was used to simulate the human environment and maintain a constant pH. The purity of glucose is Analytical Reagent grade (AR), the purity of albumin is Biological Reagent grade (BR), the purity of urea is 99%, AR, the purity of lactate is 85%~90%, AR, the purity of fructose is 99%, and the purity of cholesterol is 99%. The six previously mentioned samples were obtained from Shanghai Macklin Biochemical Co., Ltd. Then, 64 glucose mixed solutions were prepared containing glucose, albumin, urea, lactate, fructose, and cholesterol; an overview of analyte concentration range is shown in Table I. Design of experiments (DoE) technology (Minitab 20, LLC) was introduced to randomly allocate analyte concentrations, to ensure the robustness of a few samples experiment.


Data Collection
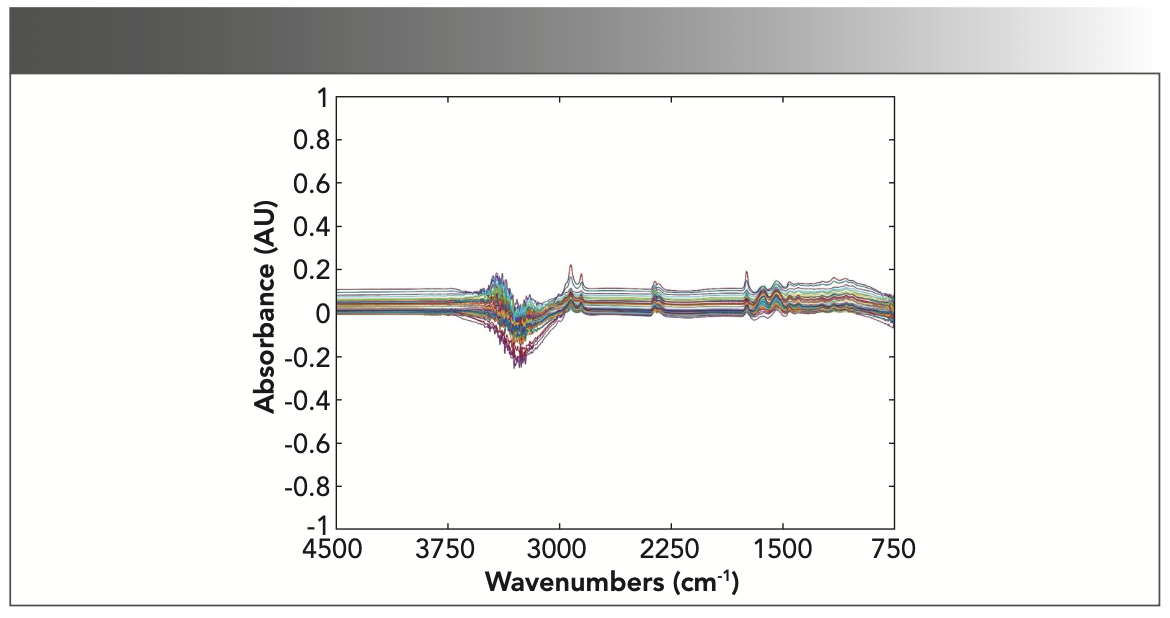
The study was conducted using a Fourier transform infrared (FT-IR) spectrometer (Brucker INVENIO-R) with a liquid nitrogen cooled-mercury cadmium telluride (LN-MCT) detector and attenuated total reflection (ATR) equipment. Each sample is detected in the range of 4497 cm−1 to 400 cm−1 with a resolution of 4 cm−1 by using 16 scans. After each measurement, the ATR crystal was cleaned with distilled water and dried with mirror paper. The MIR absorption spectrum of 64 glucose mixed solutions is shown in Figure 1. Furthermore, 15 samples are detected as outliers and eliminated before the data analysis. The calibration set has 39 solutions, and the validation set has 10 solutions.


FIGURE 1: Infrared absorption spectra of glucose solutions.
Theory and Methodology
Flexible Interval Division
Model fusion strategy improves the robustness of regression models through multimodel decision making. However, informative wavenumbers are not centrally distributed in the spectral signal, reducing the prediction performance of the fusion model. Reference (7) concludes that wavenumbers can be divided into four classes—strong correlation wavenumbers, strong correlation but redundant wavenumbers, weak correlation wavenumbers, and weak correlation but redundant wavenumbers. Therefore, the strong correlation wavenumbers are the most informative and have the greatest impact on regression models. The wavenumber absorbance of spectra needs to be rearranged according to its correlation with glucose concentration so as to make full use of the information contained in the strong correlation wavenumbers, thereby reducing the information interference caused by multicollinearity, and improving the prediction preference of the model. Therefore, the relationship between wavenumber and glucose concentration information is computed to identify informative wavenumbers and uninformative wavenumbers. We then reorganized the spectral signal to concentrate the effective information, so as to further enhance the advantage of multimodel decision-making. Meanwhile, MIC is introduced to mitigate any nonlinearity in the spectral data variables (8).
However, strong multicollinearity between wavenumbers related to glucose concentration information may exist in the model. PLS alleviates the distortion of the model caused by multicollinearity to a certain extent through feature extraction, which improves the performance of the regression models. However, the generation of the subinterval may contain high collinearity of wavenumbers, making the model unable to effectively estimate the distribution function of glucose concentration in spectral signals, and resulting in low prediction accuracy and poor robustness.
Therefore, quadratic programming is introduced to distinguish the correlation or redundancy between (and detect the prediction ability of) wavenumbers, while at the same time concentrating the informative wavenumber effectively and retaining the synergy so as to improve the accuracy of the fusion model. The definition of wavenumber importance is shown in equation 1:


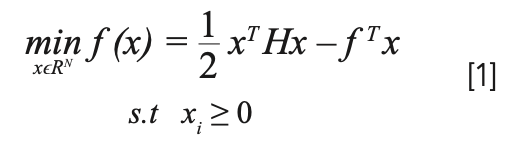
where H represents the MIC between wavenumbers, f represents MIC between wavenumber and glucose concentration, and x represents the scores index of wavenumbers. It can be seen from equation 1 that, the higher the score, the more information about glucose concentration is contained in the wavenumber. Therefore, x is regarded as the evaluation standard of the importance of spectral wavenumbers.
In addition, the synergy is closely related to the performance of the regression model. The hard-uniform division of the spectral data requires a high number of iterations to ensure the reasonable size of the useful subintervals. Therefore, considering the synergy of wavenumber and the efficiency of the proposed method, a flexible interval division (FID) method is proposed to generate data subintervals—namely, several score intervals with equal width are divided from the minimum score to the maximum score, as shown in Figure 2.


FIGURE 2: Schematic diagram of FID data selection. Points represent wavenumbers, points with the same shape represent multicollinearity, points with different shapes represent the synergy between wavenumbers, and the depth of point color represents the score of wavenumbers.
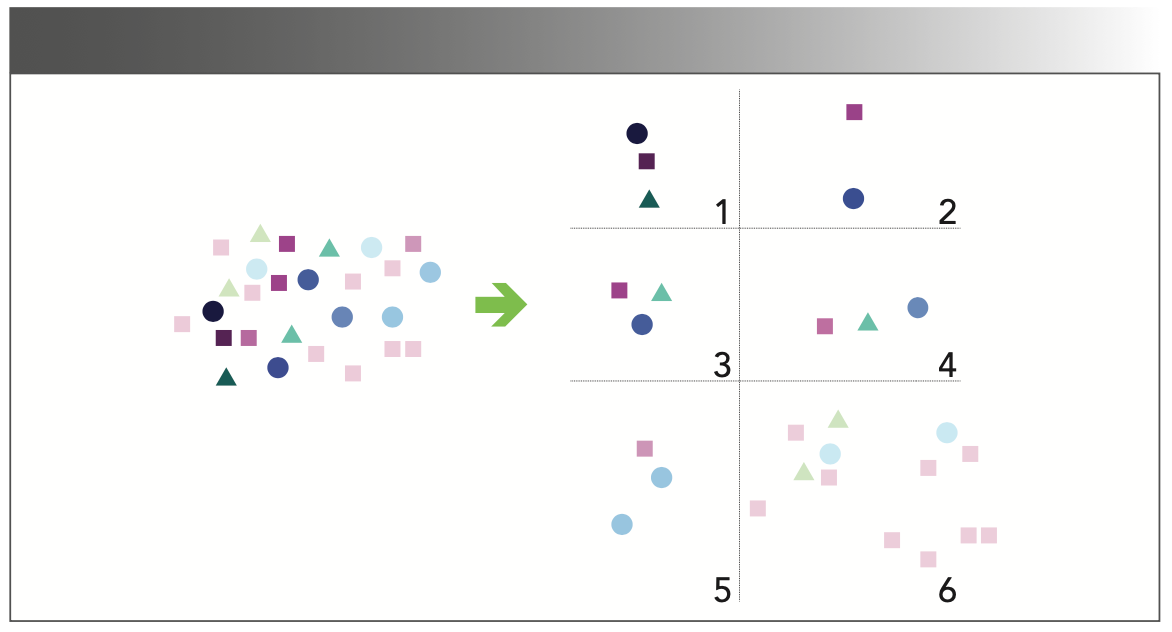
It can be seen from Figure 2 that FID divides the wavenumber data into six subintervals. The number of wavenumbers contained in each sub-interval is 3, 2, 3, 3, 3, and 13, respectively. Each subinterval contains all wavenumbers with synergy as much as possible, and the wavenumbers with multicollinearity are distributed in different subintervals as much as possible after FID. Although there are many same shape points in the sixth subinterval and the multicollinearity between wavenumbers is more serious, the score of this interval is the lowest, meaning that the impact on the fusion model is negligible.
In summary, quadratic programming combined with FID selects the informative wavenumber data, but, with multicollinearity distributed in different submodels, the risk of high multicollinearity is reduced and the synergy is retained. Therefore, the submodel can effectively estimate the distribution function of glucose concentration in the spectrum, improving the prediction accuracy and robustness of the fusion model.
Fusion Model Based on FID
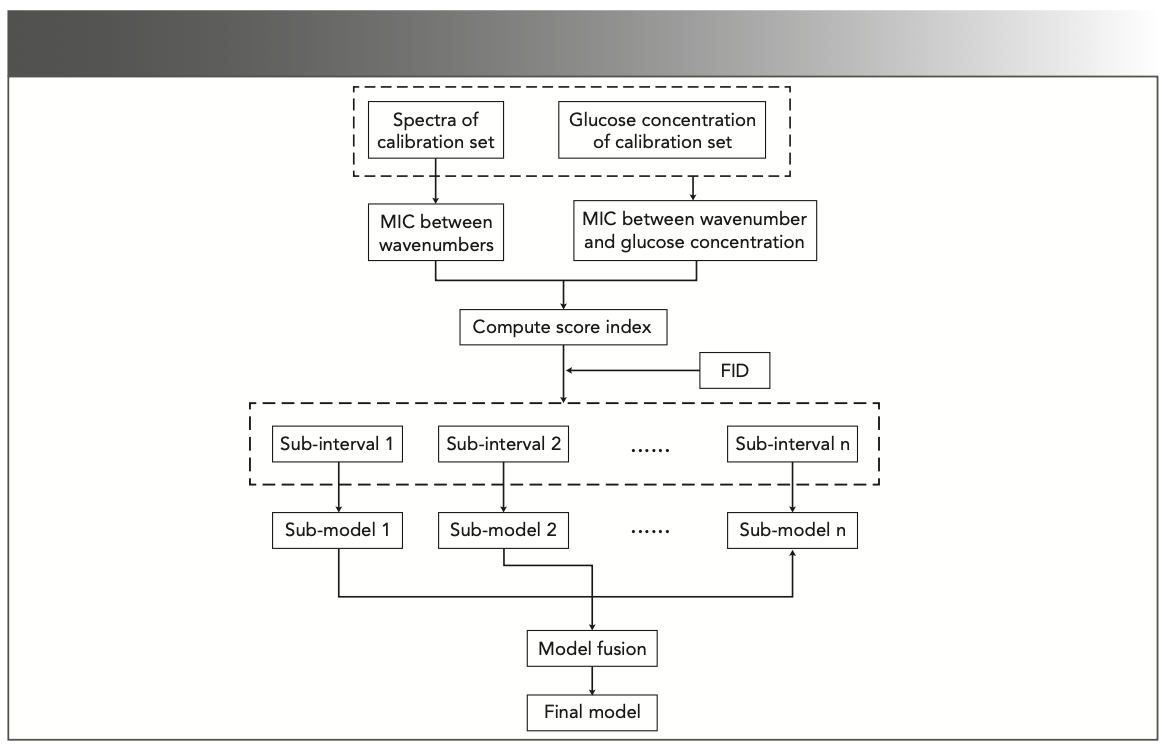
FID plays the advantages of multi-model decision-making, significantly improving the prediction accuracy of the regression model. Therefore, a fusion model method based on FID (FID-FM) is proposed. The basic idea of this model is to improve the prediction performance of the fusion model by forming a linear combination of different prediction factors so as to find a set of optimal submodel combination coefficients from the linear combination space. This allows for the measurement of the correlation index between each submodel and glucose concentration to maximize the prediction accuracy and robustness of the fusion model. Figure 3 draws the schematic diagram of FID-FM. The process of generating an optimal regression model can be designed by the following five steps:
- Step 1: Compute the MIC between variables.
- Step 2: Compute the score index using equation 1.
- Step 3: Generate submodels by FID.
- Step 4: Compute the weight of submodels, as shown in equation 2.

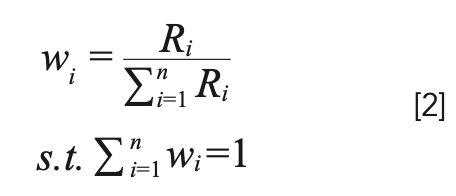

where wi represents the weight of ith submodel, and Ri represents the correction coefficient of ith submodel.
- Step 5: Generate the fusion model.


FIGURE 3: The schematic for FID-FM modeling.
Experimental and Results Discussion
In this work, the performance of five regression models—PLS, Derivative Spectra Fusion PLS Modeling (DSFPLS) (9), XGBoost (10), Classification-Before-Regression (CBR) (11), and Sammon’s Mapping Regression (SMR) (12)—are compared. Hyperparameters of each of the above models are optimized. All models are evaluated using correlation coefficient of the validation set (as R) and root mean square error of prediction (RMSEP).
Performance Comparisons
The results of the model prediction are summarized in Table II. It is shown that full PLS provided a poor prediction, followed by SMR model with R = 0.69 and RMSEP = 62.51 mg/dL. XGBoost has a better prediction performance compared with SMR. Although XGBoost has the best performance in the single-model decision-making model, its performance lags behind CBR, DSFPLS, and FID-FM, indicating the effectiveness of multi-model decision making to improve the prediction performance of the model.

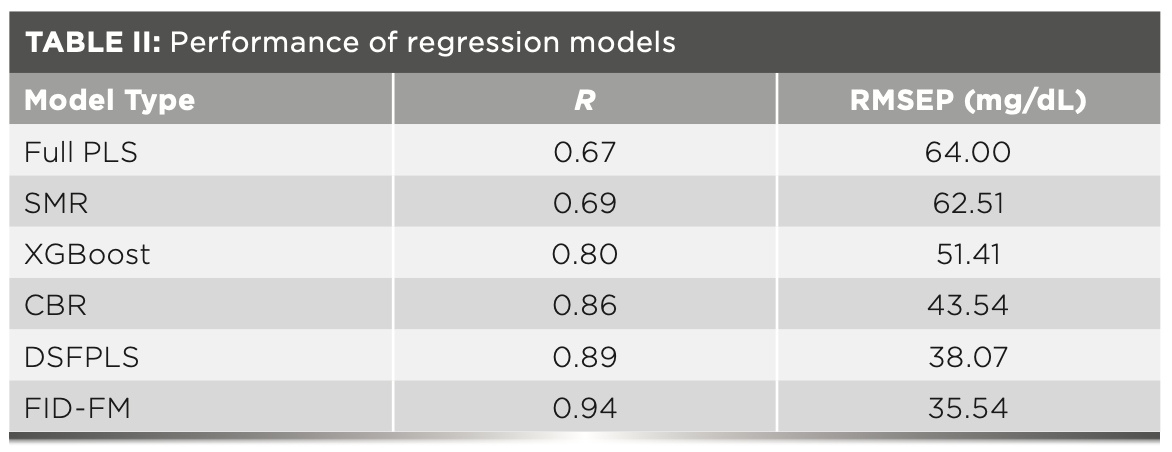
Moreover, CBR has been greatly improved compared with XGBoost (Table II), but submodels of CBR have strong multicollinearity due to the use of the full- spectrum, which makes the performance of the submodel weak. DSFPLS is slightly improved compared with CBR. However, the FID-FM model proposed in this work shows more accurate prediction performance. The method has the highest R and the lowest RMSEP among all regression models, which is 15.79% and 25.21% higher than the DSFPLS model, respectively, indicating that FID gives the fusion model better prediction performance by separating the effective information, the redundant information, and the invalid information in the algorithm.
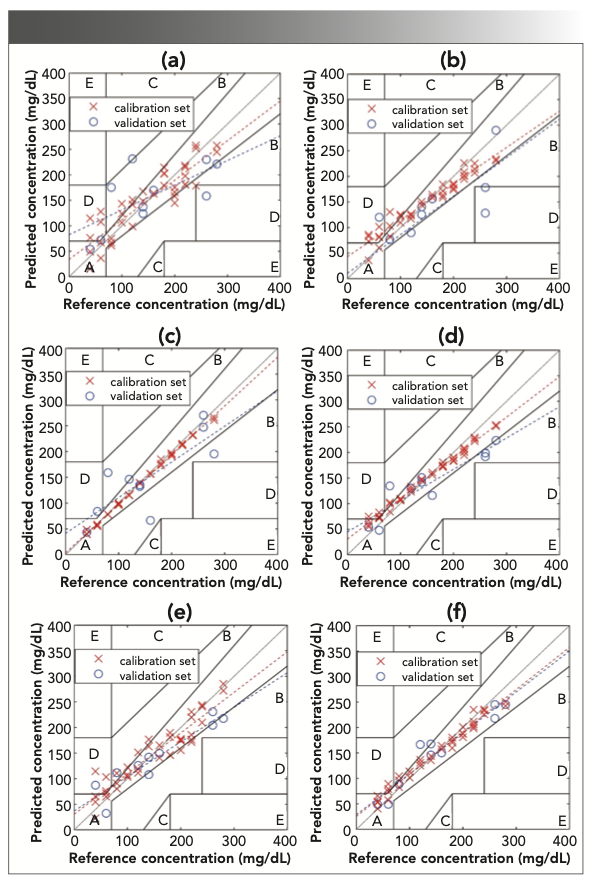
Figure 4 shows the Clarke Error Grids that denote varying regions of glucose prediction accuracy (13), in which the red line represents the regression line of the calibration set, the blue line represents the regression line of the validation set, and the black dotted line represents the ideal y = x line. It can be seen from Figure 4b that SMR has predicted negative glucose concentration levels at one point. However, SMR is not the model with the poorest performance (Table II), which shows that R and RMSEP cannot fully evaluate the performance of regression models when predicting the glucose concentration levels, The Clarke Error Grid gives a useful visual indicator of regression model performance for glucose prediction. It can be seen from Figure 4 that FID-FM achieves the optimal accuracy as compared with the other models, thus demonstrating that:
- FID-FM has the superior correlation coefficient and RMSEP.
- the regression line of FID-FM on the validation set is the closest to the ideal line.
- FID-FM contains the highest proportion of samples in region A of the Clarke Error Grid.

 full PLS model, (b) for full SMR model, (c) for full XGBoost model, (d) for full CBR model, (e) for full DSFPLS model, and (f) for full FID-FM model. Note that (f) demonstrates the best prediction performance as compared to other modeling types.")
FIGURE 4: Clarke Error Grids shown for (a) full PLS model, (b) for full SMR model, (c) for full XGBoost model, (d) for full CBR model, (e) for full DSFPLS model, and (f) for full FID-FM model. Note that (f) demonstrates the best prediction performance as compared to other modeling types.
To evaluate the robustness of the FID-FM model, we randomly split the 49 samples into an 80% and 20% calibration set and validation set, respectively, and used 10 iterations for testing. We then evaluated the correlation coefficient of each validation set. Finally, the confidence intervals were obtained using 1000 bootstrapping iterations with α = 0.05, as shown in Figure 5.


FIGURE 5: Confidence intervals of R for each modeling technique.
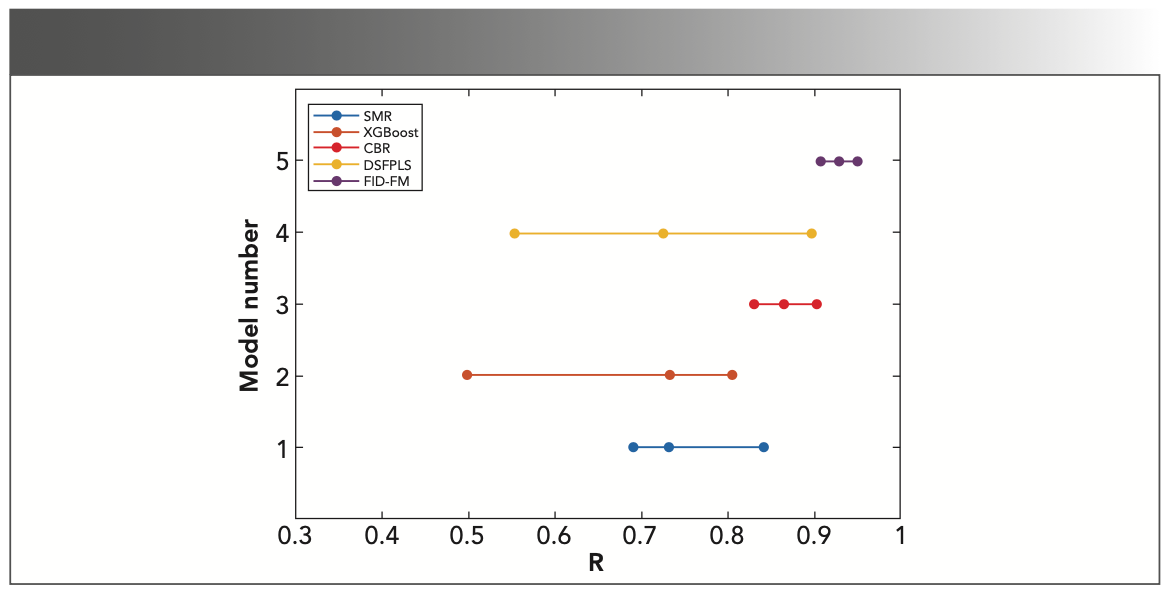
It can be seen from Figure 5 that the confidence interval of DSFPLS is the widest, with 95% probability of the real value of R is in the range of 0.55 to 0.95, indicating that it is more sensitive to the composition of the spectra, resulting in a poor credibility and robustness model. However, FID-FM has the narrowest confidence interval, and 95% of the real value of R falls between 0.91 and 0.97, indicating that the robustness of the model is the best; the reason being that FID accurately separates the effective information, the redundant information, and the invalid information for the model. The multimodel decision making effectively improves the robustness of FID-EM. Although the width of the confidence interval of CBR is equivalent to that of FID-FM, the accuracy of CBR is lower than that of FID-FM, thus confirming that the confidence interval of FID-FM is narrowest, and FID-FM is the most accurate and robust regression model.
Analysis of FID-FM
To get more insight into why the FID-FM model performs better than the other models, we studied the process of FID-FM and the submodels generated during the various iterations. Figure 6 shows the weight of each submodel, and demonstrates that the higher the average score of subintervals, the greater is the weight of the submodel generated by it. This indicates that the higher the score, the more glucose concentration information that set of wavenumbers contains, and the greater its contribution to the fusion model. Furthermore, the weights of 1st through 7th submodels are significantly greater than that of 8th through 22nd submodels, indicating that the FID we proposed effectively separates the informative wavenumbers and uninformative wavenumbers, avoiding the invalid information interfering with the prediction performance of the regression model.


FIGURE 6: Weight distribution map of each correction submodel in the fusion model.
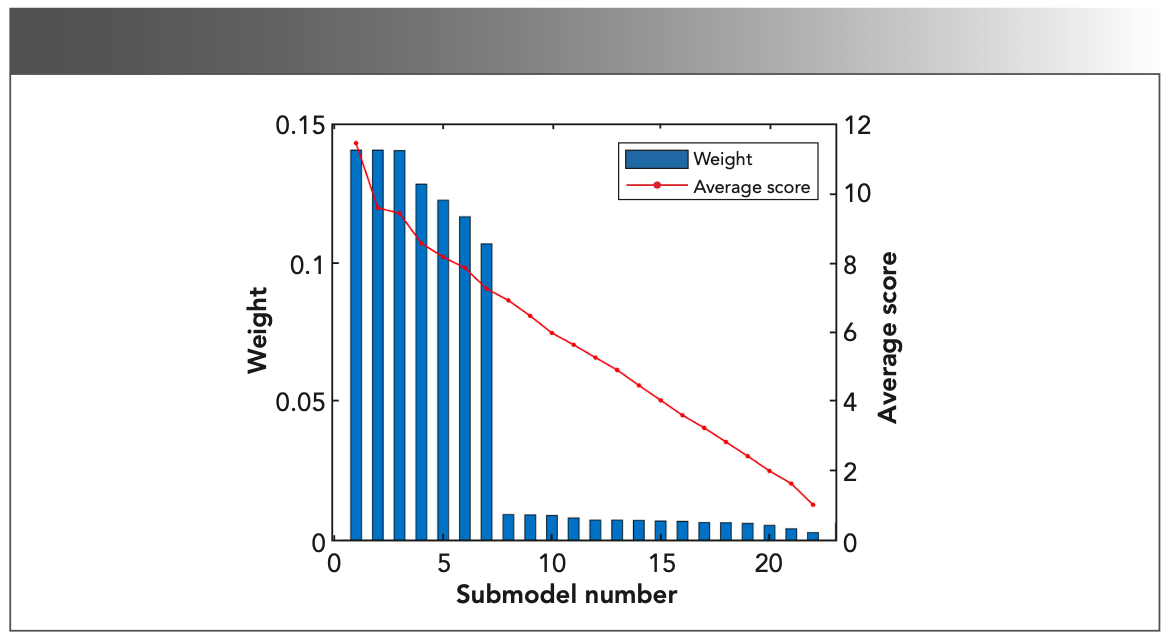
Furthermore, 1st through 3rd submodels have similar weights, and the weights of the 4th through 7th submodels are also quite similar, as shown in Figure 6, indicating that FID distributes a series of informative wavenumbers, avoiding the interference of multicollinearity on the prediction ability of the model. Thus, the FID modeling approach can more effectively correlate the potential characteristics related to glucose concentration information from the spectral signal.
Conclusions
Here, a new fusion model considering the noise that exists in spectra is proposed. The results show that the proposed FID-FM approach has obtained better prediction performance than full PLS, SMR, XGBoost, CBR, and DSFPLS modeling methods. Experimental results reveal that FID-FM can achieve superior prediction accuracy and robustness compared to other approaches, with the corresponding R and RMSEP at 0.94 and 35.54 mg/dL, respectively. The results also show that FID-FM can avoid the noise or interferences for infrared spectra, and may also serve as the optimum theoretical framework for glucose regression modeling.
Funding
National Natural Science Foundation of China (Grant Nos. 61501526 and 61178087); The Fundamental Research Funds for the Central Universities, South-Central MinZu University (Grant Number CZQ22006).
Acknowledgments
The author thanks College of Biomedical Engineering of South-Central Minzu University for providing support for this work.
Disclosures
The authors declare no conflicts of interest.
References
(1) Zou, X. B.; Zhao, J. W.; Povey, M. J. W.; Holmes, M.; Mao, H. P. Variables Selection Methods in Near-Infrared Spectroscopy. Anal. Chim. Acta 2010, 667 (1–2), 14–32 DOI: 10.1016/j.aca.2010.03.048
(2) Polikar, R. Ensemble Based Systems in Decision Making. IEEE Circuits Syst. Mag. 2006, 6 (3), 21–45. DOI: 10.1109/MCAS.2006.1688199
(3) Poerio, D. V.; Brown, S. D. Stacked Interval Sparse Partial Least Squares Regression Analysis. Chemometr. Intell. Lab. Syst. 2017, 166, 49–60. DOI: 10.1016/j.chemolab.2017.03.006
(4) Zhang, M. H.; Xu, Q. S.; Massart, D. L. Boosting Partial Least Squares. Anal. Chem. 2005, 77 (5), 1423–1431. DOI: 10.1021/ac048561m
(5) Lu, X.; Jiang, J. H.; Zhou, Y. P.; Wu, H. L.; Shen, G. L.; Yu, R. Q. MCCV Stacked Regression for Model Combination and Fast Spectral Interval Selection in Multivariate Calibration. Chemometr. Intell. Lab. Syst. 2007, 87 (2), 226–230. DOI: 10.1016/j.chemolab.2007.02.001
(6) Ni, W. D.; Brown, S. D. Stacked Partial Least Squares Regression Analysis for Spectral Calibration and Prediction R. J. Chemom. 2009, 23 (9–10), 505–517. DOI: 10.1002/cem.1246
(7) Kahmannm, A.; Anzanello, M. J.; Marcelo, M. C. A.; Pozebon, D. Near Infrared Spectroscopy and Element Concentration Analysis for Assessing Yerba Mate (Ilex paraguariensis) Samples According to the Country of Origin. Comput. Electron. Agric. 2017, 140, 348–360. DOI: 10.1016/j.compag.2017.06.007
(8) Reshef, D. N.: Reshef, Y. A.; Finucane, H. K.; Grossman, S. R.; Vean, G. M.; Turnbaugh, P. J.; Lander, E. S.; Mitzenmacher, M.; Sabeti, O. C. Detecting Novel Associations in Large Data Sets. Science 2011, 334 (6062), 1518–1524. DOI: 10.1126/science.1205438
(9) Li, Z. G.; Lv, H.; Li, T. H.; Si, G. Y.; Wang, Q. Y.; Lv, J. T.; Hu, X. F. Reagent-Free Simultaneous Determination of Glucose and Cholesterol in Whole Blood by FTIR-ATR. Spectrochim. Acta, Part A 2017, 178, 192–197. DOI: 10.1016/j.saa.2017.02.002
(10) Guang, P. W.; Huang, W. D.; Guo, L.; Yang, X. H.; Huang, F. R.; Yang, M. X.; Wen, W. R.; Li, L. Blood-based FTIR-ATR spectroscopy Coupled with Extreme Gradient Boosting for the Diagnosis of Type 2 Diabetes: A STARD Compliant Diagnosis Research. Medicine 2020, 99 (15), e19657. DOI: 10.1097/MD.0000000000019657
(11) Khadem, H.; Eissa, M. R.; Nemat, H.; Alrezj, O.; Benaissa, M. Classification Before Regression for Improving the Accuracy of Glucose Quantification Using Absorption Spectroscopy. Talanta 2020, 211, 120740. DOI: 10.1016/j.talanta.2020.120740
(12) Patchava, K. C.; Ge, S. S.; Benaissa, M. Sammon’s Mapping Regression for the Quantitative Analysis of Glucose from Both Mid Infrared and Near Infrared Spectra. Anal. Methods 2021, 13 (38), 4485–4494. DOI: 10.1039/D1AY00930C
(13) Yadav, J.; Rani, A.; Singh, V.; Murari, B. Prospects and Limitations of Non-Invasive Blood Glucose Monitoring Using Near-Infrared Spectroscopy. Biomed. Signal. Process. Control 201, 18, 214–227(2015). DOI: 10.1016/j.bspc.2015.01.005
Sicong Zhu, Zhushanying Zhang, Dongyun Zheng, Huimin Cao, and Qinlan Xie are with the College of Biomedical Engineering of South-Central MinZu University, in Wuhan, China, the Key Laboratory of Cognitive Science of the State Ethnic Affairs Commission, in Wuhan, China, and the Hubei Key Laboratory of Medical Information Analysis and Tumor Diagnosis Treatment, in Wuhan, China. Hanwen Gu and Jiming Sa are with the School of Information Engineering of Wuhan University of Technology, in Wuhan, China. Sa is also with the Hubei Key Laboratory of Medical Information Analysis and Tumor Diagnosis Treatment, in Wuhan, China. Direct correspondence to: syzhu@mail.scuec.edu.cn ●


Measurement of Ammonia Leakage by TDLAS in Mid-Infrared Combined with an EMD-SG Filter Method
April 9th 2024In this article, tunable diode laser absorption spectroscopy (TDLAS) is used to measure ammonia leakage, where a new denoising method combining empirical mode decomposition with the Savitzky-Golay smoothing algorithm (EMD-SG) is proposed to improve the signal-to-noise ratio (SNR) of absorbance signals.

Childhood Obesity Serum Samples Analyzed Using Fourier Transform Infrared Spectroscopy
April 9th 2024A group of scientists led by Zozan Guleken of the Gaziantep University of Science and Technology in Gaziantep, Turkey looked into the blood serum composition of childhood obesity (CO) tissues using Fourier transform infrared (FT-IR) spectroscopy.

